
Fantasy Sports Market Size, Share, Trends, and Forecast by Sports Type, Platform, Demographics, and Region, 2026-2034
Fantasy Sports Market Size, Share, Trends & Forecast (2026-2034)
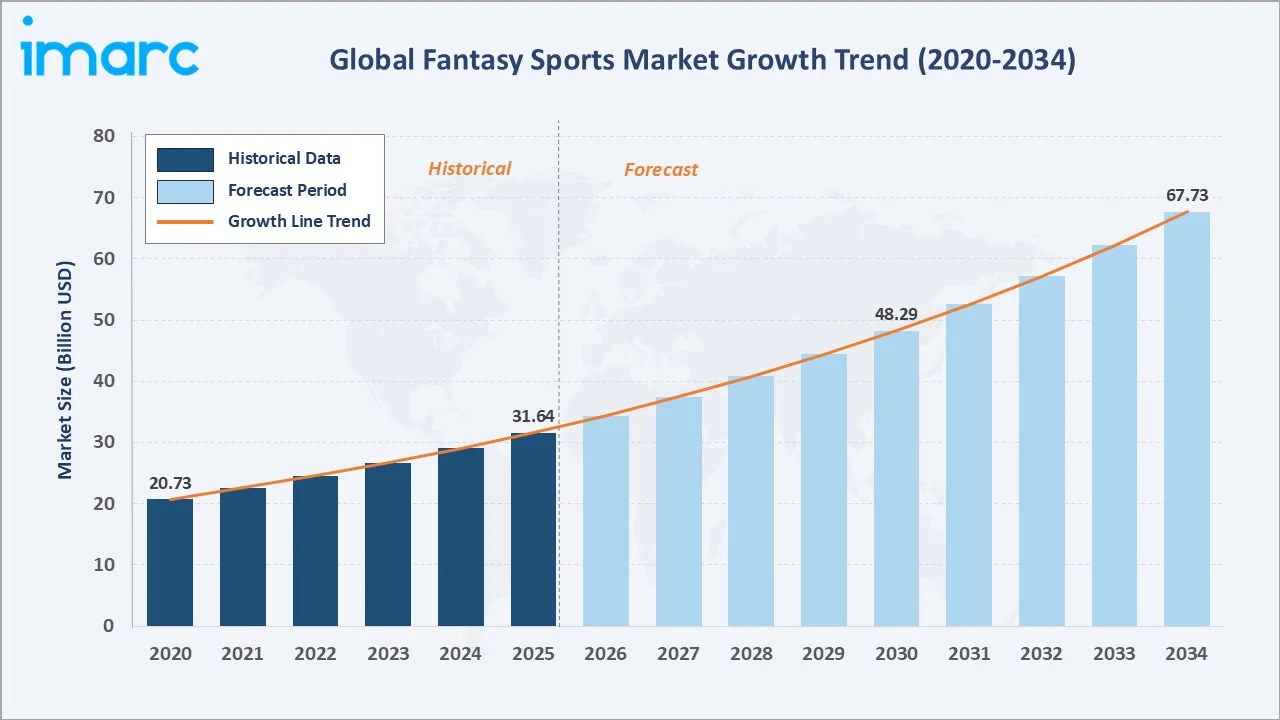
The global fantasy sports market reached USD 31.64 Billion in 2025 and is projected to reach USD 67.73 Billion by 2034, expanding at a CAGR of 8.82% during 2026-2034. Rising smartphone penetration and mobile internet accessibility, coupled with growing popularity of real-money gaming and sports engagement, and increasing availability of real-time sports data and analytics are the primary growth catalysts.
Market Snapshot
|
Metric |
Value |
|
Market Size (2025) |
USD 31.64 Billion |
|
Forecast Market Size (2034) |
USD 67.73 Billion |
|
CAGR (2026-2034) |
8.82% |
|
Base Year |
2025 |
|
Historical Period |
2020-2025 |
|
Forecast Period |
2026-2034 |
North America leads the global fantasy sports landscape, holding a 35.0% share in 2025, anchored by the region's deeply established professional sports culture and widespread real-money gaming adoption. The 25–40 years demographic commands the largest share of the market at 43.7%, reflecting sustained engagement among working-age sports enthusiasts with high disposable income.
To get more information on this market, Request Sample
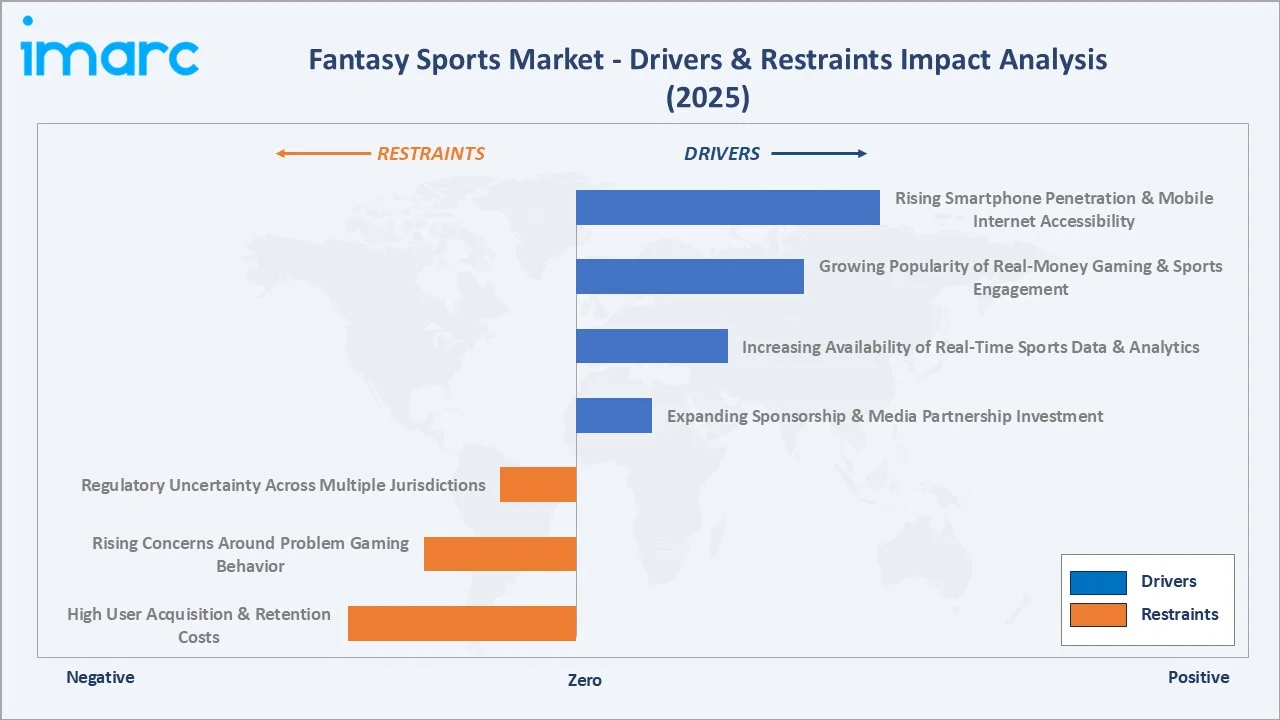
The fantasy sports market is underpinned by three structural forces: rising smartphone penetration and mobile internet accessibility, growing popularity of real-money gaming and sports engagement, and increasing availability of real-time sports data and analytics. Each force independently reinforces category growth, sustaining steady CAGR expansion through 2034 despite regulatory uncertainty across multiple jurisdictions.
Executive Summary
The fantasy sports market is experiencing steady expansion, driven by rising smartphone penetration, growing real-money gaming popularity, and increasing availability of real-time sports data and analytics. The market was valued at USD 31.64 Billion in 2025 and is forecast to reach USD 67.73 Billion by 2034, growing at a CAGR of 8.82%.
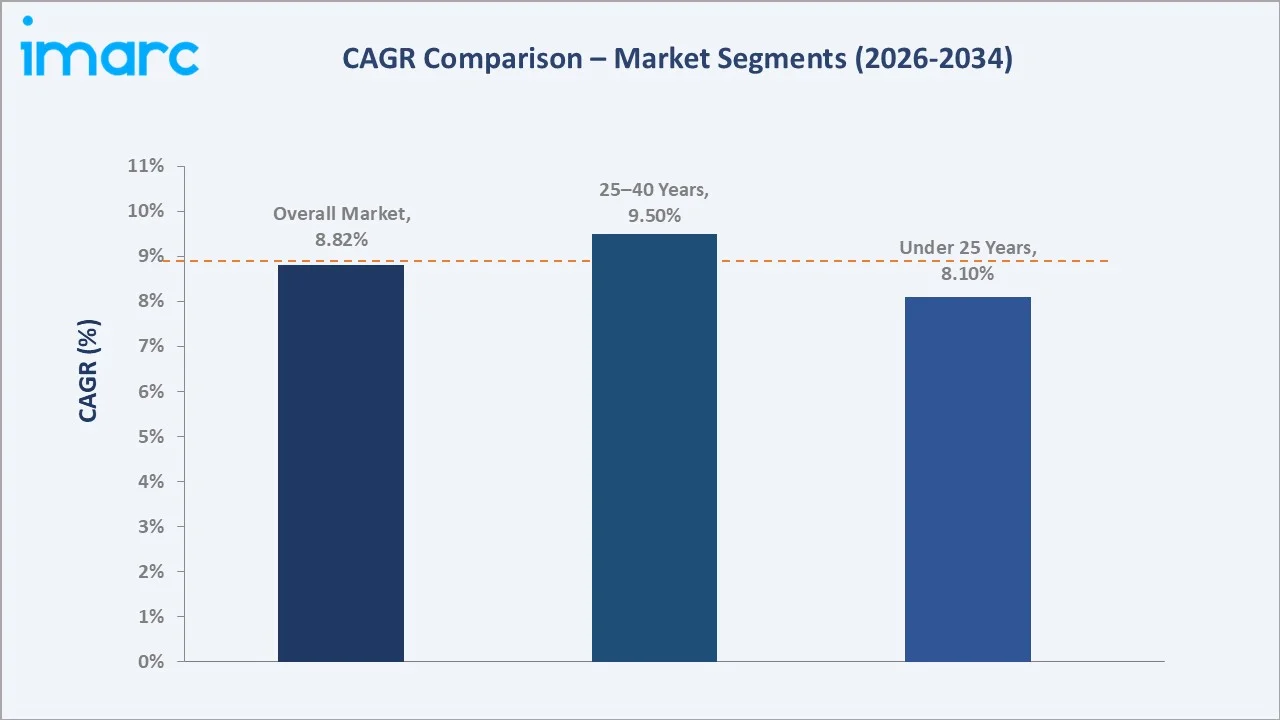
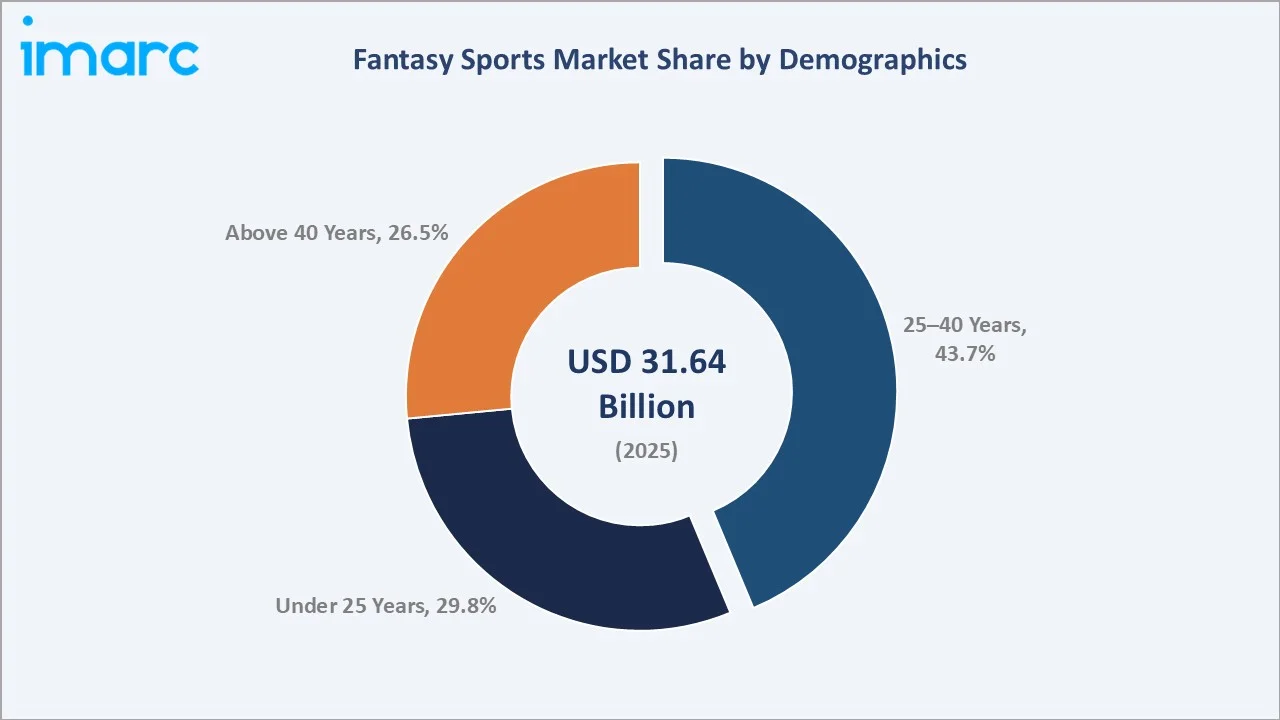
The 25–40 years age group dominates the demographics segment with a 43.7% share in 2025, encompassing working-age professionals with sustained disposable income and sports engagement, while under 25 years accounts for 29.8% and above 40 years accounts for 26.5%, reflecting the market's broad appeal across age cohorts.
Mobile application leads the platform segment at 55.0% share, supported by widespread smartphone adoption and preference for on-the-go contest participation, followed by website-based access at 45.0%, reflecting continued relevance of desktop and browser-based engagement. North America leads regionally at 35.0%, anchored by the region's deeply established professional sports culture and widespread real-money gaming adoption.
Key Market Insights
|
Insight |
Data |
|
Largest Demographics Segment |
25–40 Years – 43.7% share (2025) |
|
Fastest Growing Demographics Segment |
25–40 Years – ~9.5% CAGR (2026-2034) |
|
Largest Platform Segment |
Mobile Application – 55.0% share (2025) |
|
Leading Region |
North America – 35.0% share (2025) |
|
Top Companies |
Dream Sports Inc., Flutter Entertainment, M-League Ltd., RealTime Fantasy Sports, Inc., Paramount Skydance Corporation |
Key Analytical Observations Supporting The Above Data:
- The 25–40 years age group accounts for 43.7% of the fantasy sports market in 2025. This dominance reflects sustained engagement among working-age professionals with high disposable income.
- Mobile application remains the leading platform at 55.0% share (2025), supported by widespread smartphone adoption and preference for on-the-go contest participation.
- The under 25 years segment is expanding steadily at 29.8% share (2025), as growing youth engagement with digital sports gaming continues to drive category growth.
- North America's 35.0% share (2025) reflects its deeply established professional sports culture and widespread real-money gaming adoption.
- Rising convergence of fantasy sports with AI-powered player analytics and recommendation technology is broadening the addressable market across mobile and web platforms.
Fantasy Sports Market Overview
The fantasy sports market encompasses demographic cohorts across 25–40 years, under 25 years, and above 40 years engaging through website and mobile application platforms, offering real-money and free-to-play contest formats built around real-time sports data and player statistics. The fantasy sports ecosystem spans sports data providers, platform developers, and an expanding network of payment processing and compliance partners.
Macroeconomic drivers include rising smartphone penetration and mobile internet accessibility, growing popularity of real-money gaming and sports engagement, and increasing availability of real-time sports data and analytics. Operators are simultaneously investing in AI-powered player analytics, expanded regulatory licensing frameworks, and mobile-first platform experiences to improve product engagement, positioning the fantasy sports sector for continued innovation-led growth through 2034 despite regulatory uncertainty across multiple jurisdictions.
Market Dynamics
To evaluate market opportunities, Request Sample
Market Drivers
- Rising Smartphone Penetration & Mobile Internet Accessibility: The latest data indicates that 70.4% of the global population now uses mobile phones, with the number of unique mobile users reaching 5.83 billion as of April 2026. This growth of smartphone and mobile internet adoption globally is driving sustained fantasy sports adoption across mobile application platforms.
- Growing Popularity of Real-Money Gaming & Sports Engagement: Rising consumer interest in real-money contest formats is accelerating adoption across working-age and youth demographic segments.
- Increasing Availability of Real-Time Sports Data & Analytics: Growing access to granular player statistics and analytics is enhancing user engagement and contest participation frequency.
- Expanding Sponsorship & Media Partnership Investment: Rising sponsorship and broadcast partnership investment is broadening the addressable market for fantasy sports operators. For instance, fantasy sports companies are increasing investments in cricket to drive user engagement, expand their platforms, and capitalize on the sport’s large fan base in India.
Market Restraints
- Regulatory Uncertainty Across Multiple Jurisdictions: Inconsistent regulatory treatment of real-money gaming across regions can constrain operator expansion and slow market entry. The Promotion and Regulation of Online Gaming Act (PROG Act), 2025 introduces a regulatory framework for online gaming in India, focusing on consumer protection, responsible gaming, and oversight of digital gaming platforms.
- Rising Concerns Around Problem Gaming Behavior: Growing scrutiny around responsible gaming practices can complicate platform design and increase compliance costs.
- High User Acquisition & Retention Costs: Significant marketing and promotional spending required to acquire and retain users can constrain smaller operators' profitability.
Market Opportunities
- AI-Powered Player Analytics Expansion: A Qlik survey found that 31% of fantasy football fans are open to using AI to manage their teams, highlighting growing interest in AI-driven decision-making and analytics in fantasy sports.
- Regulatory Clarity & Licensing Expansion: Rising regulatory clarity across emerging markets offers opportunities for operators expanding into newly licensed jurisdictions.
- Multi-Sport Format Expansion: Growing interest in diversified sport formats beyond traditional offerings creates opportunities for operators entering underpenetrated sport categories.
Market Challenges
- Balancing Engagement and Responsible Gaming: Operators must balance contest engagement features with responsible gaming safeguards and user protection measures.
- Addressing Cross-Border Compliance Complexity: Ensuring compliant operations across varied regional gaming regulations requires ongoing legal investment and process adaptation.
Emerging Market Trends
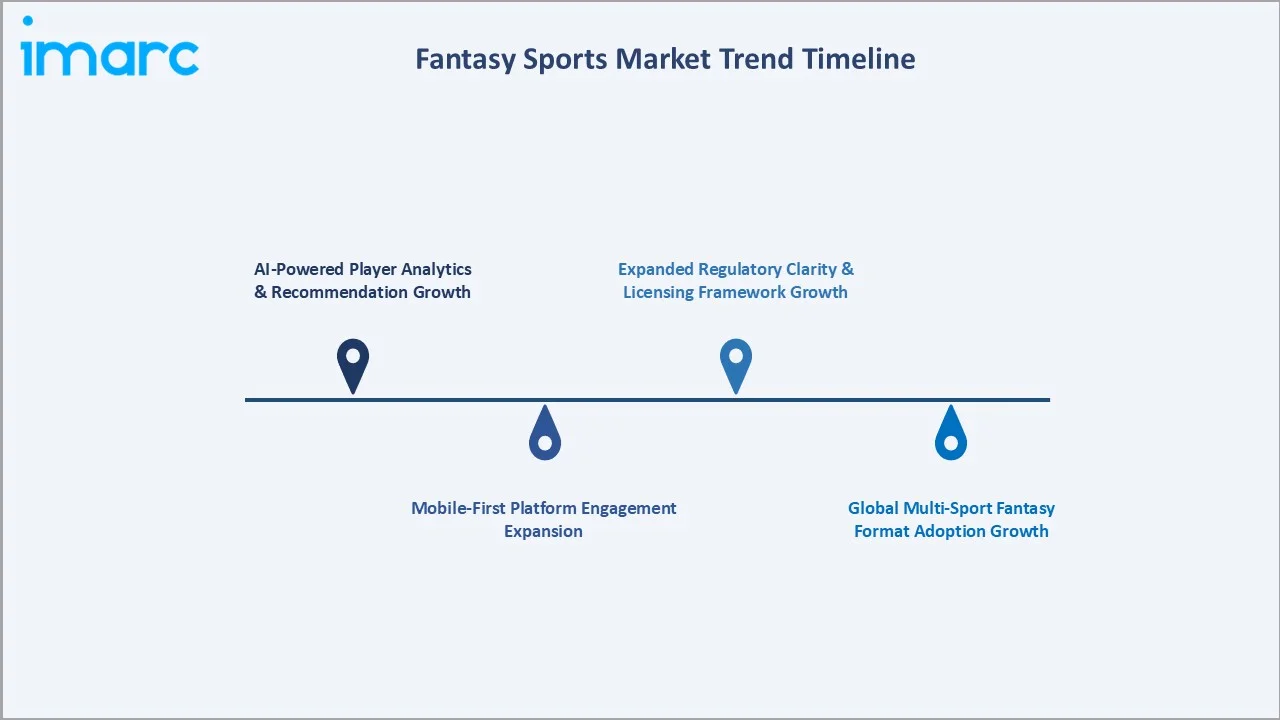
1. AI-Powered Player Analytics & Recommendation Growth
Operators are increasingly integrating AI-powered analytics into fantasy sports platforms, enabling personalized player recommendations and improved contest engagement. In September 2025, IBM introduced watsonx AI-powered insights for ESPN Fantasy Football to provide users with advanced player analysis, predictions, and data-driven recommendations for the 2025 fantasy season.
2. Mobile-First Platform Engagement Expansion
Growing adoption of mobile-first platform design is expanding on-the-go contest participation and driving higher user engagement frequency across smartphone users. Fantasy sports operators are enhancing mobile applications with real-time match updates and seamless payment features to improve user retention and participation.
3. Expanded Regulatory Clarity & Licensing Framework Growth
Rising regulatory clarity and licensing framework development across jurisdictions is accelerating operator expansion into previously restricted or ambiguous markets. Clearer regulations are enabling fantasy sports platforms to establish compliant operations, attract investments, and build long-term growth strategies in emerging markets.
4. Global Multi-Sport Fantasy Format Adoption Growth
Growing operator adoption of diversified multi-sport contest formats is broadening the addressable market beyond traditional football and cricket-centric offerings. For instance, in June 2026, bet365 launched its Fantasy Sports platform, introducing a multi-sport fantasy competition format that enables users to engage across different sports through interactive team management and gameplay features.
Industry Value Chain Analysis
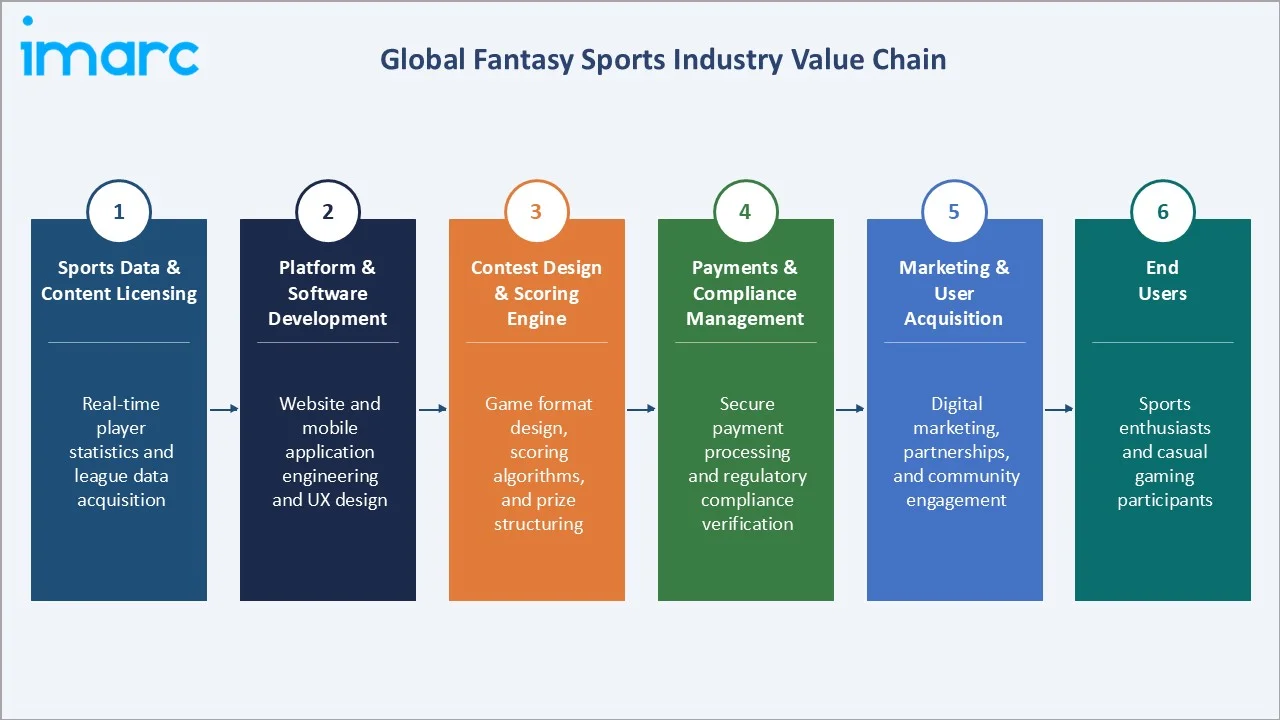
The fantasy sports value chain spans sports data licensing through end-user delivery, with each stage occupied by specialized data providers, platform developers, and payment compliance partners whose performance directly influences contest reliability, user trust, and cost-effectiveness.
|
Stage |
Key Activities |
|
Sports Data & Content Licensing |
Real-time player statistics and league data acquisition |
|
Platform & Software Development |
Website and mobile application engineering and UX design |
|
Contest Design & Scoring Engine |
Game format design, scoring algorithms, and prize structuring |
|
Payments & Compliance Management |
Secure payment processing and regulatory compliance verification |
|
Marketing & User Acquisition |
Digital marketing, partnerships, and community engagement |
|
End Users |
Sports enthusiasts and casual gaming participants |
Technology Landscape in the Fantasy Sports Industry
Advanced Player Analytics Technology
Operators are advancing player analytics technology to improve recommendation accuracy and reliability, supporting broader engagement among mobile and web platform users. Growing use of machine learning models is further refining player performance predictions based on historical and situational data.
Mobile-First Platform Development
Growing investment in mobile-first platform technology is expanding on-the-go contest participation capacity, addressing rising demand for seamless smartphone-native experiences. Enhanced app performance optimization is further reducing load times during high-traffic live contest moments.
Regulatory Compliance & Licensing Systems
Operators are engineering advanced compliance and licensing management systems to extend adoption across demanding multi-jurisdictional regulatory environments. Automated geolocation verification and KYC checks are further strengthening adherence to varying state and regional regulations.
Real-Time Data Integration Innovation
Expanding investment in real-time sports data integration technology is strengthening contest scoring reliability, supporting premium positioning across leading fantasy sports platforms. Low-latency data feeds from live game events are further ensuring instant, accurate scoring updates for users.
Market Segmentation Analysis
The report covers the following segments:
|
Segment Category |
Leading Segment |
Market Share |
Year |
|
Demographics |
25–40 Years |
43.7% |
2025 |
|
Platform |
Mobile Application |
55.0% |
2025 |
|
Sports Type |
🔒 |
🔒 |
2025 |
|
Region |
North America |
35.0% |
2025 |

By Demographics
The 25–40 years age group dominates with a 43.7% share in 2025. This segment encompasses working-age professionals with sustained disposable income and sports engagement, supported by strong contest participation frequency.
To access detailed market analysis, Request Sample
Under 25 years represents 29.8% of the market (2025), reflecting growing youth engagement with digital sports gaming, while above 40 years accounts for 26.5%, underscoring continued relevance among older, established sports enthusiasts.
By Platform
Mobile application leads the platform segment at 55.0% share (2025), supported by widespread smartphone adoption and preference for on-the-go contest participation across global user bases.
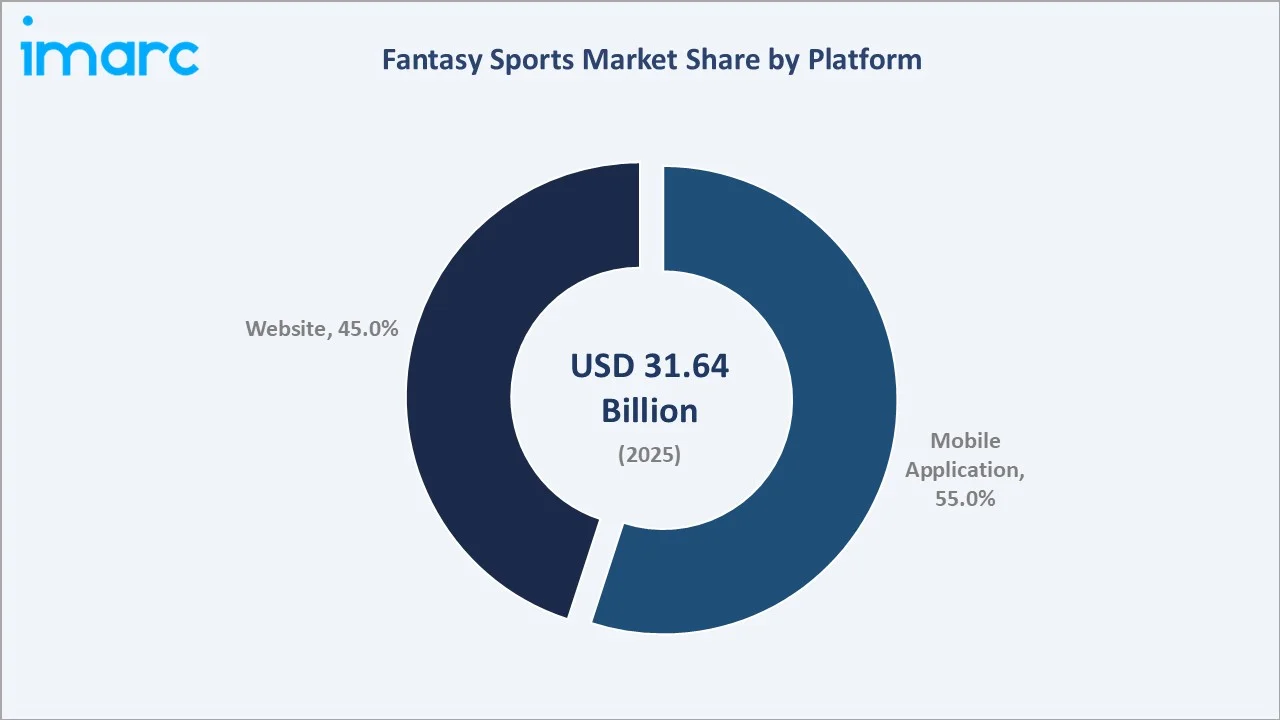
Website-based access accounts for 45.0% of the market (2025), reflecting continued relevance of desktop and browser-based engagement among users seeking a fuller contest management experience.
Regional Market Insights
North America's market leadership (35.0%, 2025) reflects its deeply established professional sports culture and widespread real-money gaming adoption. Growing mobile-first platform engagement and expanding AI-powered analytics capacity combine to sustain its dominant position through 2034.
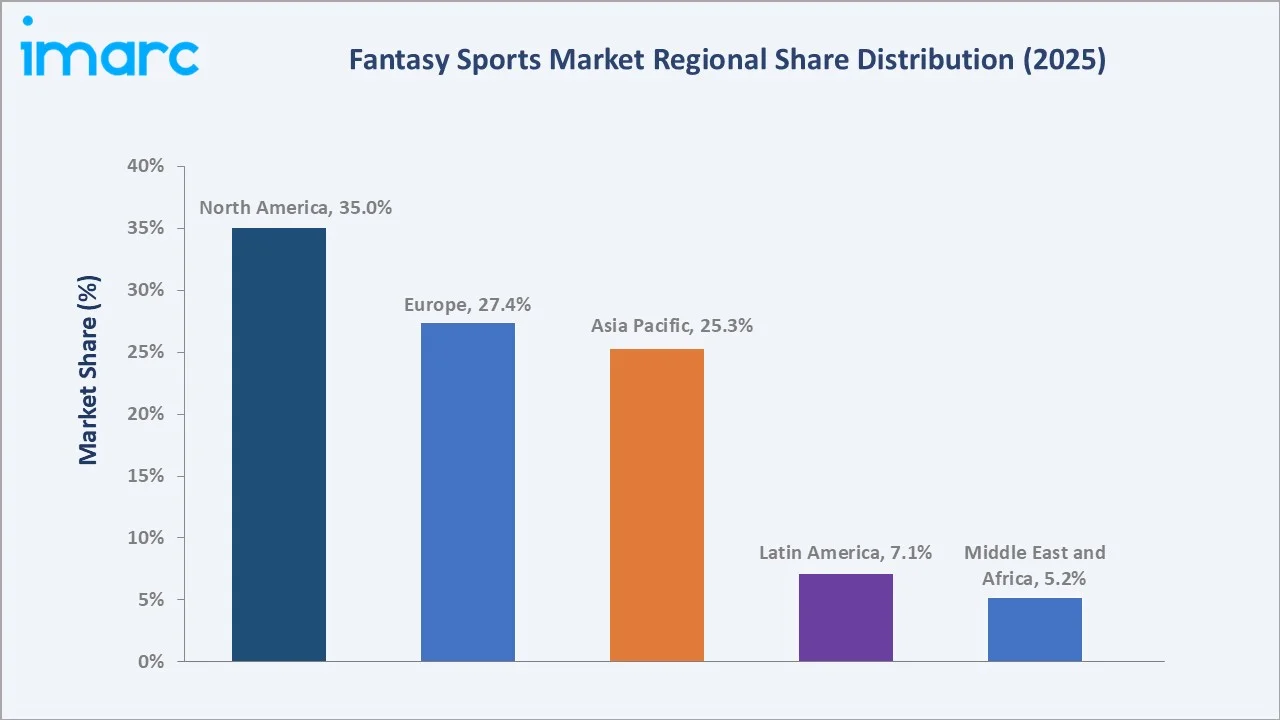
Europe at 27.4% (2025) represents the second-largest fantasy sports market regionally. Growing football-centric fantasy contest adoption and expanding mobile platform engagement are sustaining steady growth, positioning the region as a key contributor alongside North America through the forecast period.
|
Region |
Share (2025) |
Key Growth Drivers |
|
North America |
35.0% |
Deeply established professional sports culture and widespread real-money gaming adoption |
|
Europe |
27.4% |
Growing football-centric fantasy contest adoption and expanding mobile platform engagement |
|
Asia Pacific |
25.3% |
Rapidly expanding cricket-centric fantasy sports adoption and growing smartphone penetration |
|
Latin America |
7.1% |
Emerging football-focused fantasy sports adoption and expanding mobile internet access |
|
Middle East and Africa |
5.2% |
Growing smartphone adoption and gradual real-money gaming regulatory clarity |
Competitive Landscape
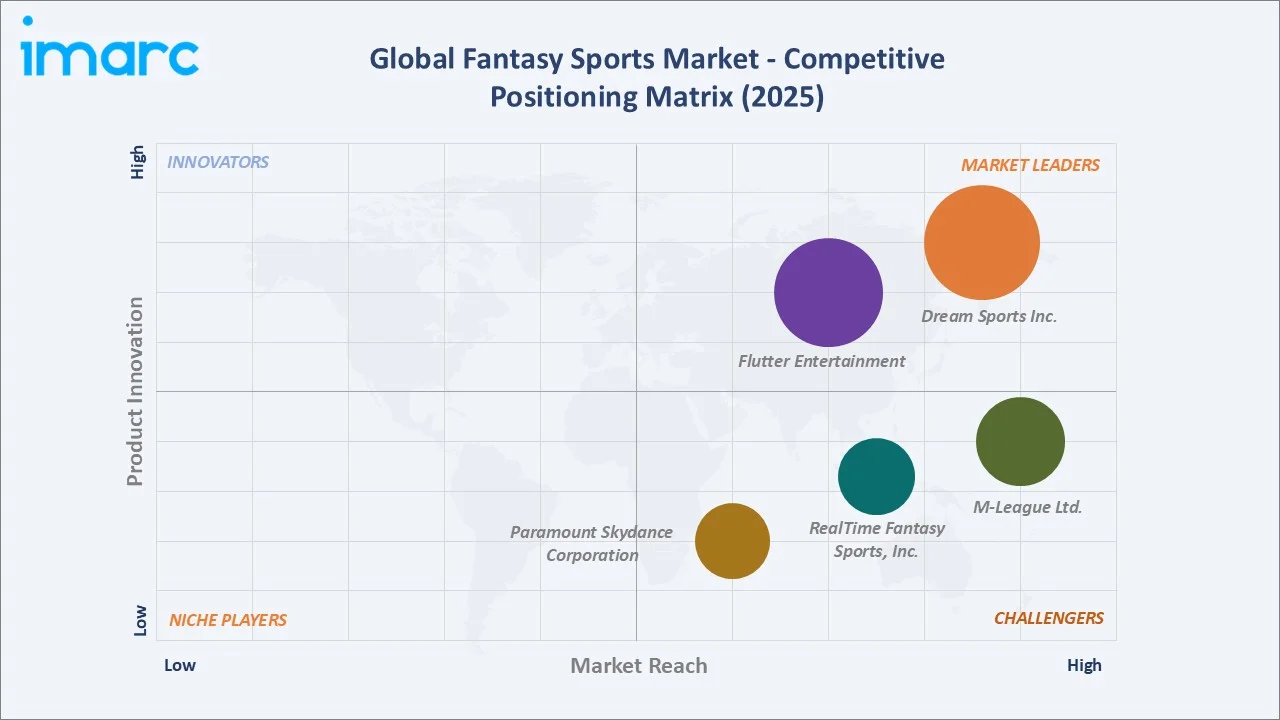
The fantasy sports market exhibits moderate concentration, with leading operators collectively holding a significant share of market revenue in 2025, reflecting sustained investment in product innovation and platform reach.
|
Company Name |
Brand Name |
Market Position |
Core Strength |
|
Dream Sports Inc. |
Dream11, FanCode, DreamSetGo, Dream Cricket
|
Market Leader |
One of the leading fantasy sports operators with an extensive multi-sport contest portfolio and user base |
|
Flutter Entertainment |
Junglee Games, Pokerstars, Sisal, SNAI, tombola, FanDuel |
Market Leader |
Established real-money gaming operator with strong North American market presence |
|
M-League Ltd. |
MPL, Gameduell, Blast, XSquads |
Strong Challenger |
Established multi-game platform provider with growing fantasy sports integration |
|
RealTime Fantasy Sports, Inc. |
RealTime Fantasy Sports |
Challenger |
Specialized fantasy sports technology provider with strong niche contest applications |
|
Paramount Skydance Corporation |
CBS Sports |
Challenger |
Established media and broadcasting provider with integrated fantasy sports content offerings |
Dream Sports Inc. and Flutter Entertainment dominate through comprehensive contest portfolios and extensive user reach, supported by continuous investment. M-League Ltd., RealTime Fantasy Sports, Inc., and Paramount Skydance Corporation compete through targeted regional platform integration, investment scale, and media content differentiation, respectively.
Key Company Profiles
Dream Sports Inc.
Dream Sports Inc. is one of the leading global fantasy sports operators with an extensive multi-sport contest portfolio serving cricket, football, and kabaddi applications under its flagship Dream11 platform.
- Product Portfolio: Multi-sport fantasy contests, real-money gaming formats, and integrated player analytics under the Dream11, FanCode, DreamSetGo, and Dream Cricket brands.
- Recent Developments: In October 2025, Dream Sports Inc. owned Dream11 expanded its fantasy sports platform into the US, UK, and other international markets as part of a global growth strategy, offering fantasy contests across cricket, soccer, and other sports.
- Strategic Focus: Strengthening multi-sport contest breadth; expanding AI-powered analytics technology across emerging application segments.
Flutter Entertainment
Flutter Entertainment is one of the leading real-money gaming operators with a strong presence across North American fantasy sports and sports betting applications through its FanDuel platform.
- Product Portfolio: Real-money fantasy contests, sports betting integration, and analytics dashboards under the Junglee Games, Pokerstars, Sisal, SNAI, tombola, and FanDuel brands.
- Recent Developments: In July 2026, Flutter Entertainment owned FanDuel expanded its Canadian footprint by launching its Casino and Sportsbook platform in Alberta, offering users access to regulated online gaming experiences.
- Strategic Focus: Scaling real-money contest capabilities; deepening regulatory compliance and licensing partnerships.
Market Concentration Analysis
The fantasy sports market exhibits moderate concentration, with Dream Sports Inc., Flutter Entertainment, and M-League Ltd. collectively accounting for a significant share of total category revenue in 2025, reflecting sustained product investment, user loyalty, and extensive platform reach across the industry.
Consolidation pressure remains limited as leading operators maintain distinct strategic positioning: Dream Sports Inc. and Flutter Entertainment through comprehensive multi-sport and real-money gaming portfolios, M-League Ltd. and RealTime Fantasy Sports, Inc. through regional platform and multi-game integration scale positioning, and Paramount Skydance Corporation through diversified investment and specialized media differentiation, rather than pursuing direct M&A consolidation.
Investment & Growth Opportunities
Fastest Growing Segments
The 25–40 years demographic (~9.5% CAGR) represents the highest-growth investment vector through 2034, driven by expanding working-age engagement and continuous innovation across AI-powered analytics technologies. This subcategory addresses a rapidly expanding addressable market within the fantasy sports ecosystem.
Emerging Market Expansion
The Latin America and Middle East and Africa regional markets collectively represent an incremental growth opportunity beyond North America, Europe, and Asia Pacific by 2034, as rising smartphone adoption and expanding regulatory clarity accelerate category penetration in these emerging markets.
Venture and Institutional Investment Trends
- Operator investment toward AI-powered player analytics and mobile-first platform technology is creating opportunities for technology vendors serving the fantasy sports sector.
- Growing real-money gaming demand is sustaining institutional interest in specialty contest platform providers.
- Multi-sport format expansion and regulatory licensing innovation, led by major operators, is opening opportunities for technology and data vendors serving the global fantasy sports industry.
Future Market Outlook (2026-2034)
The fantasy sports market is positioned for steady, technology-driven expansion through 2034. From a base of USD 31.64 Billion in 2025, the market is projected to reach USD 67.73 Billion by 2034, representing substantial incremental value creation at a CAGR of 8.82%. This growth is underpinned by rising smartphone penetration, growing real-money gaming popularity, and increasing real-time sports data availability.
The demographics and platform segment will continue evolving through 2034, with the 25–40 years segment gaining further share as AI-powered analytics and recommendation innovation accelerate. This shift creates opportunities for operators investing in mobile-first platform experiences, regulatory licensing expansion, and multi-sport format capabilities to capture the next phase of the fantasy sports market growth.
Research Methodology
Primary Research
Primary research comprised structured interviews with industry participants across 2024-2025, including fantasy sports operator executives, sports data provider specialists, payment compliance managers, and digital gaming technology experts across major global regions. Expert input validated market sizing, segmentation trends, and regional consumption patterns.
Secondary Research
Secondary research encompassed operator annual reports, online gaming association publications, and trade press covering contest format innovation, regulatory trends, and regional market dynamics across major markets.
Forecasting Models
Market size estimations were derived using top-down and bottom-up forecasting, incorporating demographics and platform segment transitions and operator product disclosures. A base-case CAGR of 8.82% reflects consensus estimates validated against announced product investment timelines and operator strategic development plans.
Fantasy Sports Market Report Scope:
| Report Features | Details |
|---|---|
| Base Year of the Analysis | 2025 |
| Historical Period | 2020-2025 |
| Forecast Period | 2026-2034 |
| Units | Billion USD |
| Scope of the Report |
Exploration of Historical and Forecast Trends, Industry Catalysts and Challenges, Segment-Wise Historical and Future Market Assessment:
|
| Sport Types Covered | Football, Baseball, Basketball, Hockey, Cricket, Others |
| Platforms Covered | Website, Mobile Application |
| Demographics Covered | Under 25 Years, 25-40 Years, Above 40 Years |
| Region Covered | Asia Pacific, Europe, North America, Latin America, Middle East and Africa |
| Countries Covered | United States, Canada, Germany, France, United Kingdom, Italy, Spain, Russia, China, Japan, India, South Korea, Australia, Indonesia, Brazil, Mexico |
| Companies Covered | Dream Sports Inc., Flutter Entertainment, M-League Ltd., RealTime Fantasy Sports, Inc., Paramount Skydance Corporation, etc. |
| Customization Scope | 10% Free Customization |
| Post-Sale Analyst Support | 10-12 Weeks |
| Delivery Format | PDF and Excel through Email (We can also provide the editable version of the report in PPT/Word format on special request) |
Key Benefits for Stakeholders:
- IMARC’s industry report offers a comprehensive quantitative analysis of various market segments, historical and current market trends, market forecasts, and dynamics of the fantasy sports market from 2020-2034.
- The research report provides the latest information on the market drivers, challenges, and opportunities in the global fantasy sports market.
- The study maps the leading, as well as the fastest-growing, regional markets. It further enables stakeholders to identify the key country-level markets within each region.
- Porter's five forces analysis assists stakeholders in assessing the impact of new entrants, competitive rivalry, supplier power, buyer power, and the threat of substitution. It helps stakeholders to analyse the level of competition within the fantasy sports industry and its attractiveness.
- The competitive landscape allows stakeholders to understand their competitive environment and provides insight into the current positions of key players in the market.
Frequently Asked Questions About the Fantasy Sports Market Report
The fantasy sports market reached USD 31.64 Billion in 2025 and is projected to reach USD 67.73 Billion by 2034.
The market is expected to grow at a CAGR of 8.82% during 2026-2034, driven by rising smartphone penetration and growing real-money gaming popularity.
North America leads with a 35.0% share in 2025, anchored by its deeply established professional sports culture and widespread real-money gaming adoption.
The 25–40 years age group dominates with a 43.7% share in 2025, driven by sustained engagement among working-age professionals with high disposable income.
Mobile application leads with a 55.0% share in 2025, supported by widespread smartphone adoption and preference for on-the-go contest participation.
Some of the key players include Dream Sports Inc., Flutter Entertainment, M-League Ltd., RealTime Fantasy Sports, Inc., and Paramount Skydance Corporation.
The 25–40 years age group is growing fastest at an estimated 9.5% CAGR as working-age engagement with real-money contest formats accelerates.
Key challenges include regulatory uncertainty across multiple jurisdictions, rising concerns around problem gaming behavior, and high user acquisition and retention costs.
AI-powered player analytics expansion, regulatory clarity and licensing expansion, and multi-sport format expansion represent leading investment opportunities.
Above 40 years, at 26.5% share, continues to reflect steady participation among established sports enthusiasts, complementing growth among younger demographic cohorts.
Need more help?
- Speak to our experienced analysts for insights on the current market scenarios.
- Include additional segments and countries to customize the report as per your requirement.
- Gain an unparalleled competitive advantage in your domain by understanding how to utilize the report and positively impacting your operations and revenue.
- For further assistance, please connect with our analysts.
 Request Customization
 Speak to an Analyst
 Request Brochure
 Inquire Before Buying
Benefits of Customization
- Personalize this research
- Triangulate with your data
- Get data as per your format and definition
- Gain a deeper dive into a specific application, geography, customer, or competitor
- Any level of personalization
Get in Touch With Us
UNITED STATES
Phone: +1-201-971-6302
INDIA
Phone: +91-120-433-0800
UNITED KINGDOM
Phone: +44-753-714-6104
Email: [email protected]
Client Testimonials




.webp)




.webp)













Related Reports

Choose your plan
*Please note that the prices mentioned below are starting prices for each bundle type. Kindly contact our team for further details.*
Single User License
- 1 User License, Access on 2 Devices
- PDF Report + Excel Dataset (Password Protected)
- Lifetime Access
- No Printing Rights
- 10% Free Report Customization
- 10–12 Weeks of Analyst Support
Five User License
- Access for 5 Users, 2 Devices per User
- PDF Report + Excel Dataset (Password Protected)
- Lifetime Access
- Dedicated Account Manager
- 12–14 Weeks of Analyst Support
- No Printing Rights
- 15% Free Report Customization
- 25% Discount on Your Next Purchase
Corporate User License
- Unlimited User Access (Within Your Organization)
- PDF Report + Excel Dataset
- Lifetime Access
- Dedicated Account Manager
- 14–20 Weeks of Analyst Support
- No Printing Rights
- 20% Free Report Customization
- 30% Discount on Your Next Purchase
Essential Insights
What's included:
3 reports
- Lifetime Access
- PDF Reports
- Excel Datasets
- 2 Weeks of Free Analyst Support
- 2 User Licenses
- Access on 2 Devices
- Printing Rights
- Complimentary PowerPoint (PPT) Version
- Complimentary License Upgrade
Professional Access
What's included:
5 reports
- Lifetime Access
- PDF Reports
- Excel Datasets
- 8 Weeks of Free Analyst Support
- 2 User Licenses
- Access on 2 Devices
- Printing Rights
- Complimentary PowerPoint (PPT) Version
- Complimentary License Upgrade
Business Advantage
What's included:
8 reports
- Lifetime Access
- PDF Reports
- Excel Datasets
- 14 Weeks of Free Analyst Support
- 2 User Licenses
- Access on 2 Devices
- Printing Rights
- Complimentary PowerPoint (PPT) Version
- Complimentary License Upgrade
Enterprise Intelligence
What's included:
10 reports
- Lifetime Access
- PDF Reports
- Excel Datasets
- 20 Weeks of Free Analyst Support
- 2 User Licenses
- Access on 2 Devices
- Printing Rights
- Complimentary PowerPoint (PPT) Version
- Complimentary License Upgrade