
Float Glass Prices, Trend, Chart, Demand, Market Analysis, News, Historical and Forecast Data Report 2026 Edition
Float Glass Price Trend, Index and Forecast
Track the latest insights on float glass price trend and forecast with detailed analysis of regional fluctuations and market dynamics across North America, Latin America, Central Europe, Western Europe, Eastern Europe, Middle East, North Africa, West Africa, Central and Southern Africa, Central Asia, Southeast Asia, South Asia, East Asia, and Oceania.
Float Glass Prices Outlook Q2 2026
- Germany: USD 678/MT
- France: USD 705/MT
- United Kingdom: USD 854/MT
- USA: USD 1115/MT
- China: USD 1322/MT
Float Glass Price Chart

Get real-time access to monthly/quarterly/yearly prices Request Sample
During the second quarter of 2026, the float glass prices in Germany reached USD 678/MT in June. Prices showed a slight upward movement, supported by steady demand conditions across construction linked consumption. The market reflected a gradual price increase driven by controlled production output from domestic manufacturers. Supply remained well balanced, but mild tightening supported firm pricing behavior in selected procurement cycles. Energy linked production costs added a supportive tone to pricing movement during the quarter.
During the second quarter of 2026, the float glass prices in France reached USD 705/MT in June. Prices moved upward at a measured pace, supported by stable demand from renovation and architectural applications. The market experienced mild firmness as producers maintained disciplined output aligned with consumption levels. Supply conditions remained steady but slightly tightened in certain procurement periods, contributing to price strengthening.
During the second quarter of 2026, the float glass prices in the United Kingdom reached USD 854/MT in June. Prices showed a mild upward trend driven by steady consumption from construction and refurbishment activity. Import dependency influenced supply availability, contributing to firmer pricing behavior in domestic markets. Suppliers maintained controlled output in response to stable order inflows, supporting gradual price strengthening.
During the second quarter of 2026, the float glass prices in the USA reached USD 1115/MT in June. Prices moved slightly upward, supported by stable demand from residential construction and automotive glazing sectors. Domestic production remained steady but aligned closely with consumption levels, supporting a balanced market structure. Import activity supplemented supply but did not create downward pressure on pricing. Consistent procurement from downstream industries contributed to gradual price firmness.
During the second quarter of 2026, the float glass prices in China reached USD 1322/MT in June. Prices recorded a slight upward movement, supported by steady infrastructure and construction driven demand. Production levels were managed in a controlled manner, helping prevent excess supply in the domestic market. Export activity remained stable, supporting overall market absorption and limiting downward pressure. Downstream procurement from real estate and industrial sectors contributed to consistent consumption.
Float Glass Prices Outlook Q1 2026
- Germany: USD 671/MT
- France: USD 695/MT
- United Kingdom: USD 843/MT
- USA: USD 1104/MT
- China: USD 1312/MT
During the first quarter of 2026, the float glass prices in Germany reached 671 USD/MT in March. The market recorded a slight upward movement supported by stable demand from the construction and automotive sectors. Production levels remained controlled, while steady energy costs influenced manufacturing expenses. Supply conditions remained balanced due to consistent plant operations and stable import flows.
During the first quarter of 2026, the float glass prices in France reached 695 USD/MT in March. The market experienced a modest increase driven by steady demand from infrastructure and residential construction activities. Supply conditions remained stable due to consistent production and balanced inventory levels. Demand from downstream industries supported consumption, while procurement remained measured.
During the first quarter of 2026, the float glass prices in the United Kingdom reached 843 USD/MT in March. The market observed a slight decline due to moderated demand from the construction and renovation sectors. Supply availability remained sufficient due to stable domestic production and imports. Buyers maintained conservative purchasing strategies, reducing large volume procurement.
During the first quarter of 2026, the float glass prices in the USA reached 1104 USD/MT in March. The market experienced a gradual decline influenced by sufficient supply and moderated demand from the construction sector. Production levels remained steady, while inventory availability reduced urgency among buyers. Consumption remained stable but lacked strong growth.
During the first quarter of 2026, the float glass prices in China reached 1312 USD/MT in March. The market recorded a noticeable decline driven by excess supply and subdued demand from the real estate and manufacturing sectors. Production remained steady, while export demand showed limited strength. Inventory levels remained adequate, reducing buying pressure. Stable processing costs provided limited support, resulting in a gradual price decrease.
Float Glass Prices Outlook Q4 2025
- Germany: USD 663/MT
- France: USD 690/MT
- United Kingdom: USD 854/MT
- USA: USD 1130/MT
- China: USD 1370/MT
During the fourth quarter of 2025, the float glass prices in Germany reached 663 USD/MT in December. Prices moved upward due to steady demand from residential construction and renovation projects. Manufacturing output remained disciplined, preventing excessive supply in the domestic market. Procurement activity from downstream processors stayed consistent, supporting stable order flows. Export commitments within Europe also reduced domestic availability, reinforcing price firmness. Additionally, stable logistics performance ensured uninterrupted deliveries, which supported supplier confidence.
During the fourth quarter of 2025, the float glass prices in France reached 690 USD/MT in December. The market witnessed firm pricing due to consistent demand from the construction and architectural glazing sectors. Producers managed inventories efficiently, which limited spot market availability. Imports remained controlled, reducing competitive pressure on domestic suppliers. Downstream demand remained stable, particularly from refurbishment and commercial building segments.
During the fourth quarter of 2025, the float glass prices in the United Kingdom reached 854 USD/MT in December. Prices declined as construction activity softened and buyers adopted cautious procurement strategies. Market participants delayed purchases amid uncertainty in project timelines, which reduced immediate demand. Import availability increased competition, prompting suppliers to offer price concessions. Inventory levels at distributor locations remained sufficient, limiting restocking urgency.
During the fourth quarter of 2025, the float glass prices in the USA reached 1130 USD/MT in December. Prices trended lower due to easing construction demand and balanced supply conditions. Manufacturing output remained steady, ensuring adequate availability across regional markets. Buyers exercised restraint in procurement amid slower commercial project activity. Improved logistics efficiency reduced distribution-related cost pressures. Additionally, increased import competition influenced pricing negotiations.
During the fourth quarter of 2025, the float glass prices in China reached 1370 USD/MT in December. Prices declined sharply due to persistent oversupply and weak downstream demand. Construction sector activity remained sluggish, limiting large-scale procurement. Manufacturing plants continued operating at elevated utilization rates, leading to inventory accumulation. Export demand softened, reducing an important outlet for excess material. Market participants focused on destocking, intensifying price competition.
Float Glass Prices Outlook Q3 2025
- Germany: USD 648/MT
- France: USD 678/MT
- United Kingdom: USD 872/MT
- South Korea: USD 427/MT
- Turkey: USD 494/MT
During the third quarter of 2025, the float glass prices in Germany reached 648 USD/MT in September. The upward movement reflected pressures from elevated energy tariffs for furnace operations, tighter supply as some production lines underwent maintenance, and rising raw-material input costs for soda ash and silica sand. Logistic and port handling surcharges also increased, contributing to the incremental delivered cost.
During the third quarter of 2025, the float glass prices in France reached 678 USD/MT in September. Price growth was driven by a combination of high input cost inflation, particularly electricity and natural gas used in float-line production and procurement difficulties for key feedstocks. The construction sector maintained moderate activity in glazing and curtain-wall systems, while manufacturing plants faced scheduling and transportation constraints, all of which placed upward pressure on domestic glass pricing.
During the third quarter of 2025, the float glass prices in the United Kingdom reached 872 USD/MT in September. Pricing strength was supported by constrained domestic supply due to scheduled furnace downtime and maintenance, while raw-material and energy cost inflation remained persistent. Export demand also lifted as regional trade routes shifted, creating favorable margins for producers.
During the third quarter of 2025, the float glass prices in South Korea reached 427 USD/MT in September. The market saw modest upward movement as energy and feedstock costs climbed and import constraints for certain materials influenced supply flexibility. Downstream sectors such as construction and electronics maintained demand, albeit with some caution, which allowed producers to adjust pricing upward in this quarter.
During the third quarter of 2025, the float glass prices in Turkey reached 494 USD/MT in September. Price increases were moderated but still positive, influenced by elevated domestic energy and transportation costs, depreciation of the local currency affecting imported inputs, and sustained demand from infrastructure and real-estate glazing projects.
Float Glass Prices Outlook Q2 2025
- Germany: USD 637/MT
- France: USD 664/MT
- United Kingdom: USD 863/MT
- South Korea: USD 421/MT
- Turkey: USD 490/MT
During the second quarter of 2025, the float glass prices in Germany reached 637 USD/MT in June. Float glass prices in Germany this quarter were influenced by elevated energy and raw material costs, particularly for soda ash and natural gas. Production facilities operated at reduced capacities due to maintenance schedules and subdued demand from the construction and automotive sectors. Additionally, logistics disruptions within Central Europe affected inbound material deliveries and outbound distribution, leading to supply-side inefficiencies across the value chain.
During the second quarter of 2025, float glass prices in France reached 664 USD/MT in June. In France, float glass pricing was impacted by fluctuating energy tariffs and procurement challenges related to silica sand and dolomite. Demand from the residential construction sector softened amid slower housing starts, while automotive glass orders remained stable. Labor-related slowdowns at manufacturing plants and elevated transportation charges contributed to higher input costs. Regional supply chains also faced intermittent delays due to port congestion.
During the second quarter of 2025, the float glass prices in the United Kingdom reached 863 USD/MT in June. The United Kingdom saw float glass price fluctuations due to tight domestic supply resulting from ongoing furnace repairs at certain plants. Energy cost volatility added pressure to production margins. Demand from the commercial glazing and fenestration sectors showed regional variability. Delays in raw material imports, particularly soda ash, due to customs and port clearance issues, further influenced manufacturing schedules and delivery commitments.
During the second quarter of 2025, the float glass prices in South Korea reached 421 USD/MT in June. Float glass prices in South Korea were shaped by increased costs of key raw materials and elevated industrial energy tariffs. Supply chain disruptions linked to shipping container shortages affected the timely delivery of silica and soda ash. The construction sector exhibited mixed demand, while export-oriented producers faced challenges due to regional trade frictions. Operational adjustments at key facilities also influenced production output.
During the second quarter of 2025, the float glass prices in Turkey reached 490 USD/MT in June. In Turkey, float glass pricing trends reflected heightened energy and transportation expenses, coupled with increased sourcing costs for raw materials such as limestone and soda ash. Domestic demand from the infrastructure and real estate sectors remained robust, placing pressure on production capacity. Currency depreciation contributed to higher import costs for certain inputs, while geopolitical risks in neighboring regions affected trade flows and logistics.
Float Glass Prices Outlook Q1 2025
- Germany: USD 615/MT
- France: USD 635/MT
- United Kingdom: USD 820/MT
- South Korea: USD 410/MT
- Turkey: USD 480/MT
During the first quarter of 2025, the float glass prices in Germany reached 615 USD/MT in March. As per the float glass price chart, prices experienced changes due to a combination of factors, including rising raw material costs, firm demand from glass manufacturing and water treatment sectors, and the impact of the broader European market.
During the first quarter of 2025, float glass prices in France reached 635 USD/MT in March. Rising energy costs, especially for electricity and natural gas, significantly impacted production expenses and prices. Logistical disruptions, such as severe weather events or labor strikes, impacted the supply chain, leading to price volatility.
During the first quarter of 2025, the float glass prices in the United Kingdom reached 820 USD/MT in March. Raw materials like sand and soda ash, which are essential for float glass production, were experiencing price fluctuations, pushing up the cost of manufacturing. Moreover, the UK government's focus on energy efficiency and building standards also influenced the demand for glass products.
During the first quarter of 2025, the float glass prices in South Korea reached 410 USD/MT in March. Float glass prices in South Korea were experiencing both increases and decreases depending on the specific type and application. Prices were fluctuating due to factors like rising energy costs and elevated demand for energy-efficient and sustainable building materials.
During the first quarter of 2025, the float glass prices in Turkey reached 480 USD/MT in March. Import regulations, antidumping and countervailing duties, and sanctions impacted float glass prices. Besides, economic stagnation, inflation, and geopolitical uncertainties also influenced pricing trends.
Regional Coverage
The report provides a detailed analysis of the market across different regions, each with unique pricing dynamics influenced by localized market conditions, supply chain intricacies, and geopolitical factors. This includes price trends, price forecast and supply and demand trends for each region, along with spot prices by major ports. The report also provides coverage of FOB and CIF prices, as well as the key factors influencing float glass prices.
Europe Float Glass Price Trend
Q2 2026:
The float glass price index in Europe reflected a mild upward movement. Prices increased gradually across major European economies supported by steady construction related demand. Supply conditions remained balanced but showed slight tightening due to controlled production levels. Energy cost pressures influenced manufacturing economics, indirectly supporting firmer pricing behavior. Import flows within the region stayed stable, preventing sharp fluctuations. Downstream demand from architectural applications maintained consistent consumption patterns.
Q1 2026:
The float glass price index in Europe showed mixed trends with slight upward support in some markets and mild downward pressure in others. Demand from the construction and automotive sectors remained stable but uneven across countries. Supply conditions remained balanced due to steady production and consistent import flows. Buyers maintained cautious procurement strategies, while stable energy and operational costs provided limited price support.
Q4 2025:
The float glass price index in Europe reflected mixed trends shaped by uneven demand conditions across the region. Western European markets benefited from steady construction and renovation activity, which supported baseline consumption levels. Producers maintained disciplined production schedules, preventing excess material from entering the market. Limited import pressure further enabled domestic suppliers to sustain pricing stability. However, demand varied between countries due to differences in project execution and procurement timing, leading to divergent price movements within the region.
Q3 2025:
The float glass price index for Q3 2025 reflected a general upward trend across key European markets. Elevated energy costs, particularly electricity and natural gas used in glass-melting operations, continued to squeeze margins and support higher pricing. At the same time, supply-chain bottlenecks, such as maintenance downtime at regional float lines and constrained rail or road logistics, limited throughput and pressured availability. Downstream demand from construction glazing, automotive windshields and architectural facades remained steady, which kept producers from discounting. Currency stability across Western Europe also limited cost advantages from imports, further supporting domestic pricing.
Q2 2025:
As per the float glass price index, European prices this quarter were influenced by high energy costs, particularly natural gas, which significantly affected furnace operations. Several plants underwent maintenance or capacity curtailments, tightening supply. Demand from the construction and automotive sectors remained uneven across the region. Additional cost pressures stemmed from logistics delays and elevated prices for raw materials such as soda ash, silica sand, and dolomite.
Q1 2025:
As per the float glass price index, price trends in Europe for Q1 2025 were influenced by various factors, including raw material costs, demand from the construction and automotive industries, and regulatory changes. Besides, import regulations, sanctions, and trade policies affected float glass prices. Moreover, producers faced significantly higher energy expenses due to Europe’s energy crisis.
This analysis can be extended to include detailed float glass price information for a comprehensive list of countries.
| Region | Countries Covered |
|---|---|
| Europe | Germany, France, United Kingdom, Italy, Spain, Russia, Turkey, Netherlands, Poland, Sweden, Belgium, Austria, Ireland, Switzerland, Norway, Denmark, Romania, Finland, Czech Republic, Portugal, and Greece, among other European countries. |
North America Float Glass Price Trend
Q2 2026:
The float glass price index in North America showed a bullish movement. Prices increased gradually due to stable demand from residential construction and automotive sectors. Production levels remained consistent, but aligned closely with consumption, supporting firmer pricing behavior. Import volumes helped balance supply but did not exert downward pressure. Procurement activity from downstream industries remained steady, reinforcing upward price movement. Energy and logistics costs contributed to mild price firmness across the region.
Q1 2026:
The float glass price index in North America reflected a slight decline, primarily influenced by adequate supply levels and moderated demand from construction and infrastructure sectors. Production activity across the region remained steady, ensuring continuous availability of material in the market. At the same time, inventory levels were sufficient, reducing the urgency among buyers to secure additional volumes. Demand from residential and commercial construction segments remained stable but lacked strong expansion, limiting upward price momentum.
Q4 2025:
The float glass price index in North America weakened as construction activity slowed across both residential and commercial segments. Manufacturing output remained steady, resulting in sufficient market availability. Buyers adopted cautious procurement strategies amid uncertainty surrounding project pipelines, which reduced spot market activity. Increased availability of imported material intensified competition among suppliers, pressuring pricing negotiations. Distributors managed inventories conservatively, further limiting urgent restocking demand.
Q3 2025:
The float glass price index in Q3 2025 in North America saw some upward pressure as input costs rose and supply flexibility tightened. Raw-material inflation, especially soda ash, silica sand and energy for glass furnaces, added directly to production cost. In addition, logistics disruptions, longer transit times for imported feedstocks and rail bottlenecks increased delivered costs. Construction activity in both residential and commercial segments remained firm, enabling producers to pass on cost increases. Tariff and trade policy considerations also limited import substitution, supporting domestic pricing power. As a result, float glass prices edged higher in Q3 in the North American region.
Q2 2025:
As per the float glass price index, in North America, float glass pricing was shaped by consistent construction activity, particularly in residential and commercial segments, which sustained steady demand. Input costs rose due to increased prices of soda ash and fuel, while some facilities faced equipment maintenance, limiting production efficiency. Cross-border transportation bottlenecks and longer lead times for imported materials contributed to volatility in supply availability and delivery schedules.
Q1 2025:
North America’s residential, commercial, and auto construction sectors remained strong, sustaining demand for architectural and automotive float glass. Besides, continued uncertainty from tariffs, trade probes, and regulatory shifts influenced import flexibility and pricing trends. Moreover, shipping disruptions, impacted by geopolitical tensions, also played a significant role.
Specific float glass prices and historical data within the United States and Canada can also be provided.
| Region | Countries Covered |
|---|---|
| North America | United States and Canada |
Middle East and Africa Float Glass Price Trend
Q2 2026:
According to the float glass price chart, prices in the Middle East and Africa changed due to a complex interplay of events, including supply chain disruptions, seasonal demand swings, and geopolitical effects.
Q1 2026:
As per the float glass price chart, the prices in the Middle East and Africa fluctuated due to a complex interplay of factors, primarily driven by supply chain disruptions, seasonal demand shifts, and geopolitical influences.
Q3 2025:
In the Middle East and Africa region during Q3 2025, float glass pricing was influenced by rising freight and shipping costs across regional trade flows, port handling delays and an increase in energy input charges. Infrastructure and real-estate glazing demand in Gulf states remained robust, which reduced downward pressure on local prices. At the same time, geographic supply constraints and variable import duties in certain African markets added cost uncertainties. These dynamics jointly contributed to moderate upward pricing pressures for float glass across the MEA region in Q3.
Q2 2025:
A tight supply from refineries, exacerbated by maintenance rounds and unplanned outages, put pressure on prices. Simultaneously, demand from the agrochemical sector during the planting season contributed to price changes.
Q1 2025:
As per the float glass price chart, logistical challenges, including shipping delays, higher freight rates, and port congestion, continued from late 2024 into Q1 2025, influencing supply and prices. Besides, geopolitical tensions and shifting trade policies in some MEA countries added further complexity and costs. Moreover, significant investment in construction projects, particularly in countries like the United Arab Emirates and Saudi Arabia, drove demand for float glass, potentially affecting prices.
In addition to region-wise data, information on float glass prices for countries can also be provided.
| Region | Countries Covered |
|---|---|
| Middle East & Africa | Saudi Arabia, UAE, Israel, Iran, South Africa, Nigeria, Oman, Kuwait, Qatar, Iraq, Egypt, Algeria, and Morocco, among other Middle Eastern and African countries. |
Asia Pacific Float Glass Price Trend
Q2 2026:
The Asia Pacific float glass market recorded an increasing price trend. Prices increased gradually due to steady demand from construction and industrial applications. Production remained controlled in several key markets, helping maintain balanced supply conditions. Export activity provided additional support to market absorption. Domestic consumption stayed steady across major economies, reinforcing upward price movement. Supply chains operated efficiently, ensuring consistent availability without oversupply pressure.
Q1 2026:
In the Asia Pacific region, float glass prices showed a downward trend driven by sufficient supply and moderated demand from the real estate and manufacturing sectors. Production levels across major economies remained stable, ensuring the consistent availability of float glass in the market. However, demand from property development and industrial applications showed limited growth, which reduced pressure on supply. Export demand also remained subdued, further contributing to adequate inventory levels across the region.
Q4 2025:
Asia Pacific markets faced notable downward pressure on float glass prices due to persistent oversupply and weak construction demand. High operating rates at manufacturing facilities led to inventory accumulation, intensifying competition among suppliers. Domestic consumption remained subdued, while export demand softened, reducing opportunities to absorb surplus material. Market participants prioritized destocking, which increased price competition in spot markets. These conditions collectively weighed on regional pricing, resulting in widespread declines across major Asia Pacific markets.
Q3 2025:
During Q3 2025 in the Asia Pacific region, float glass prices rose modestly as production costs edged upward and shipping constraints lingered. In markets like South Korea, higher energy tariffs and logistic delays for imported inputs weighed on costs. In larger economies such as China and India, demand from construction and solar-module industries remained supportive, though competition and export-oriented supply chains placed some downward pressure on margins. Nonetheless, the combination of steady downstream demand and rising input/logistics costs resulted in a moderate increase in float glass pricing across the region.
Q2 2025:
Float glass prices in the Asia Pacific region were impacted by elevated production costs tied to rising energy tariffs and raw material constraints. In China, environmental inspections disrupted output at key facilities. Southeast Asian countries faced logistics disruptions from port congestion and weather-related delays. Regional demand varied, with strong construction activity in some markets, while exports were affected by fluctuating trade routes and freight costs.
Q1 2025:
Trade disruptions and geopolitical uncertainties created instability in supply chains, leading to cautious purchasing behavior from buyers. These factors contributed to pressure on prices. Besides, other inputs like soda ash, limestone, and cullet also saw cost hikes amid broader commodity inflation, adding further pressure on manufacturing costs.
This float glass price analysis can be expanded to include a comprehensive list of countries within the region.
| Region | Countries Covered |
|---|---|
| Asia Pacific | China, India, Indonesia, Pakistan, Bangladesh, Japan, Philippines, Vietnam, Thailand, South Korea, Malaysia, Nepal, Taiwan, Sri Lanka, Hongkong, Singapore, Australia, and New Zealand, among other Asian countries. |
Latin America Float Glass Price Trend
Q2 2026:
Latin America's float glass market is heavily influenced by its abundant natural resources, particularly in Chile and Brazil. However, political uncertainty and different regulatory regimes can cause enormous fluctuation in float glass pricing.
Q1 2026:
Latin America's float glass market is predominantly influenced by its rich natural reserves, particularly in countries like Chile and Brazil. However, political instability and inconsistent regulatory frameworks can lead to significant volatility in float glass prices.
Q3 2025:
Infrastructure challenges and logistical inefficiencies often impact the supply chain, affecting the region's ability to meet international demand consistently. Moreover, the float glass price index, economic fluctuations, and currency devaluation are critical factors that need to be considered when analyzing float glass pricing trends in this region.
This comprehensive review can be extended to include specific countries within the region.
| Region | Countries Covered |
|---|---|
| Latin America | Brazil, Mexico, Argentina, Columbia, Chile, Ecuador, and Peru, among other Latin America countries. |
Float Glass Pricing Report, Market Analysis, and News
IMARC's latest publication, “Float Glass Prices, Trend, Chart, Demand, Market Analysis, News, Historical and Forecast Data Report 2026 Edition,” presents a detailed examination of the float glass market, providing insights into both global and regional trends that are shaping prices. This report delves into the spot price of float glass at major ports and analyzes the composition of prices, including FOB and CIF terms. It also presents detailed float glass prices trend analysis by region, covering North America, Europe, Asia Pacific, Latin America, and Middle East and Africa. The factors affecting float glass pricing, such as the dynamics of supply and demand, geopolitical influences, and sector specific developments, are thoroughly explored. This comprehensive report helps stakeholders stay informed with the latest market news, regulatory updates, and technological progress, facilitating informed strategic decision-making and forecasting.
Float Glass Industry Analysis
The global float glass market size reached USD 52.28 Billion in 2025. By 2034, IMARC Group expects the market to reach USD 84.03 Billion, at a projected CAGR of 5.42% during 2026-2034. The market is primarily driven by the rising construction and infrastructure activity, increasing demand for energy efficient facades and automotive glazing, and the expansion of solar module and building automation applications.
Latest News and Developments:
- October 2025: GlassKote FGI secured over AUD 1.2 billion (USD 781 million) in financing to establish two low iron float glass manufacturing facilities in Australia and the United Arab Emirates.
- September 2025: Pilkington Technology Management Limited, a subsidiary of the NSG Group and a recognized global innovator in glass manufacturing technologies, entered into an agreement with NovaSklo to provide engineering and technical support for establishing a new float glass production facility in Ukraine’s Kyiv region.
Product Description
Float glass is a transparent flat glass produced by floating molten glass on a layer of molten tin, which ensures uniform thickness and smooth surface quality. It is primarily composed of silica sand, soda ash, limestone, and other minor additives that enhance clarity and durability. The manufacturing process produces optically clear sheets with high structural consistency, making it suitable for further processing such as tempering, laminating, or coating. Float glass is widely used in architectural glazing, automotive windshields, mirrors, furniture, and solar panels. It is valued for its high light transmission, smooth finish, and mechanical strength. Its adaptability allows it to serve as a base material for advanced glass products used in energy efficient buildings and industrial applications.
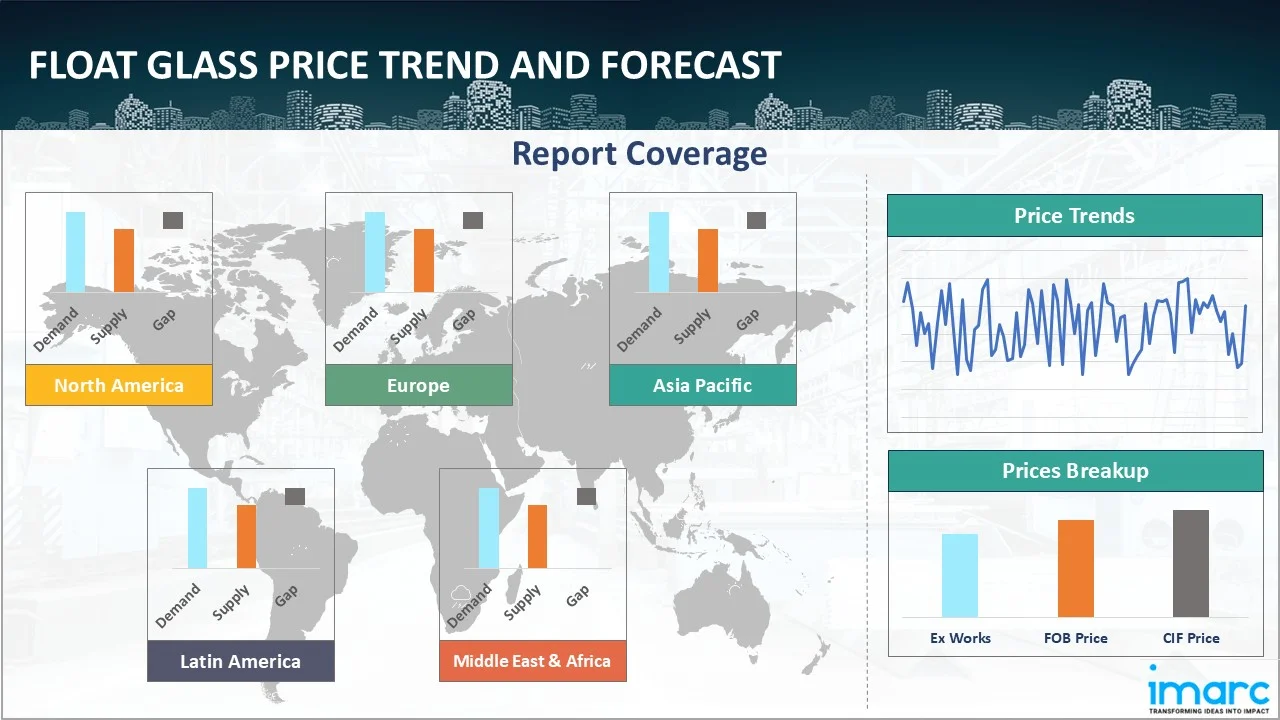
Report Coverage
| Key Attributes | Details |
|---|---|
| Product Name | Float Glass |
| Report Features | Exploration of Historical Trends and Market Outlook, Industry Demand, Industry Supply, Gap Analysis, Challenges, Float Glass Price Analysis, and Segment-Wise Assessment. |
| Currency/Units | US$ (Data can also be provided in local currency) or Metric Tons |
| Region/Countries Covered | The current coverage includes analysis at the global and regional levels only. Based on your requirements, we can also customize the report and provide specific information for the following countries: Asia Pacific: China, India, Indonesia, Pakistan, Bangladesh, Japan, Philippines, Vietnam, Thailand, South Korea, Malaysia, Nepal, Taiwan, Sri Lanka, Hongkong, Singapore, Australia, and New Zealand Europe: Germany, France, United Kingdom, Italy, Spain, Russia, Turkey, Netherlands, Poland, Sweden, Belgium, Austria, Ireland, Switzerland, Norway, Denmark, Romania, Finland, Czech Republic, Portugal and Greece North America: United States and Canada Latin America: Brazil, Mexico, Argentina, Columbia, Chile, Ecuador, and Peru Middle East & Africa: Saudi Arabia, UAE, Israel, Iran, South Africa, Nigeria, Oman, Kuwait, Qatar, Iraq, Egypt, Algeria, and Morocco The list of countries presented is not exhaustive. Information on additional countries can be provided if required by the client. |
| Information Covered for Key Suppliers |
|
| Customization Scope | The report can be customized as per the requirements of the customer |
| Report Price and Purchase Option |
Plan A: Monthly Updates - Annual Subscription
Plan B: Quarterly Updates - Annual Subscription
Plan C: Biannually Updates - Annual Subscription
|
| Post-Sale Analyst Support | 360-degree analyst support after report delivery |
| Delivery Format | PDF and Excel through email (We can also provide the editable version of the report in PPT/Word format on special request) |
Key Benefits for Stakeholders:
- IMARC’s report presents a detailed analysis of float glass pricing, covering global and regional trends, spot prices at key ports, and a breakdown of FOB and CIF prices.
- The study examines factors affecting float glass price trend, including input costs, supply-demand shifts, and geopolitical impacts, offering insights for informed decision-making.
- The competitive landscape review equips stakeholders with crucial insights into the latest market news, regulatory changes, and technological advancements, ensuring a well-rounded, strategic overview for forecasting and planning.
- IMARC offers various subscription options, including monthly, quarterly, and biannual updates, allowing clients to stay informed with the latest market trends, ongoing developments, and comprehensive market insights. The float glass price charts ensure our clients remain at the forefront of the industry.
Need more help?
- Speak to our experienced analysts for insights on the current market scenarios.
- Include additional segments and countries to customize the report as per your requirement.
- Gain an unparalleled competitive advantage in your domain by understanding how to utilize the report and positively impacting your operations and revenue.
- For further assistance, please connect with our analysts.
 Request Customization
 Inquire Before Buying
 Speak to an Analyst
 Request Brochure
Benefits of Customization
- Personalize this research
- Triangulate with your data
- Get data as per your format and definition
- Gain a deeper dive into a specific application, geography, customer, or competitor
- Any level of personalization
Get in Touch With Us
UNITED STATES
Phone: +1-201-971-6302
INDIA
Phone: +91-120-433-0800
UNITED KINGDOM
Phone: +44-753-714-6104
Email: [email protected]
Client Testimonials


.webp)


Why Choose Us
IMARC offers trustworthy, data-centric insights into commodity pricing and evolving market trends, enabling businesses to make well-informed decisions in areas such as procurement, strategic planning, and investments. With in-depth knowledge spanning more than 1000 commodities and a vast global presence in over 150 countries, we provide tailored, actionable intelligence designed to meet the specific needs of diverse industries and markets.
1000
+Commodities
150
+Countries Covered
3000
+Clients
20
+Industry
Robust Methodologies & Extensive Resources
IMARC delivers precise commodity pricing insights using proven methodologies and a wealth of data to support strategic decision-making.
Subscription-Based Databases
Our extensive databases provide detailed commodity pricing, import-export trade statistics, and shipment-level tracking for comprehensive market analysis.
Primary Research-Driven Insights
Through direct supplier surveys and expert interviews, we gather real-time market data to enhance pricing accuracy and trend forecasting.
Extensive Secondary Research
We analyze industry reports, trade publications, and market studies to offer tailored intelligence and actionable commodity market insights.
Trusted by 3000+ industry leaders worldwide to drive data-backed decisions. From global manufacturers to government agencies, our clients rely on us for accurate pricing, deep market intelligence, and forward-looking insights.