
Flow Battery Manufacturing Plant Project Report 2026: Industry Trends, Plant Setup, Machinery, Raw Materials, Investment Opportunities, Cost and Revenue
Flow Battery Manufacturing Plant Project Report (DPR) Summary:
IMARC Group's comprehensive DPR report, titled "Flow Battery Manufacturing Plant Project Report 2026: Industry Trends, Plant Setup, Machinery, Raw Materials, Investment Opportunities, Cost and Revenue," provides a complete roadmap for setting up a flow battery manufacturing unit. The flow battery market is experiencing significant growth as the demand for energy storage systems rises, particularly in the context of the increasing adoption of renewable energy sources such as solar and wind. Additionally, they are gaining attention in electric vehicle (EV) charging stations and microgrids due to their longer cycle life, improved safety, and the ability to store energy for extended periods without degradation. The flow battery market size was valued at USD 603.56 Million in 2025. According to IMARC Group estimates, the market is expected to reach USD 3,832.72 Million by 2034, exhibiting a CAGR of 22.8% from 2026 to 2034.
This feasibility report covers a comprehensive market overview to micro-level information such as unit operations involved, raw material requirements, utility requirements, infrastructure requirements, machinery and technology requirements, manpower requirements, packaging requirements, transportation requirements, etc.
The flow battery manufacturing setup cost is provided in detail covering project economics, capital investments (CapEx), project funding, operating expenses (OpEx), income and expenditure projections, fixed costs vs. variable costs, direct and indirect costs, expected ROI and net present value (NPV), profit and loss account, financial analysis, etc.
Access the Detailed Feasibility Analysis, Request Sample
What is a Flow Battery?
A flow battery is an energy storage device that generates electricity through the electrochemical reactions of two liquid electrolytes separated by a membrane. Unlike traditional batteries, which store energy in solid electrodes, flow batteries store energy in liquid form and use electrolytes that are pumped through the system. This design allows for larger energy capacity and the ability to scale storage as needed. Flow batteries are known for their long cycle life, rechargeability, scalability, and safety, making them suitable for grid energy storage, renewable integration, and backup power systems. Key types include vanadium redox flow and all-vanadium flow batteries.
Key Investment Highlights
- Process Used: Electrolyte production, electrode manufacturing, membrane production, cell assembly, system integration, and packaging.
- End-use Industries: Energy & utilities, transportation, telecommunications, industrial applications, and residential & commercial.
- Applications: Grid-scale energy storage, renewable energy integration, electric vehicle charging stations, backup power systems, and microgrids.
Flow Battery Plant Capacity:
The proposed manufacturing facility is designed with an annual production capacity ranging between 100-1,000 MWh, enabling economies of scale while maintaining operational flexibility.
Flow Battery Plant Profit Margins:
The project demonstrates healthy profitability potential under normal operating conditions. Gross profit margins typically range between 35-45%, supported by stable demand and value-added applications.
- Gross Profit: 35-45%
- Net Profit: 15-25%
Flow Battery Plant Cost Analysis:
The operating cost structure of a flow battery manufacturing plant is primarily driven by raw material consumption, particularly vanadium electrolyte, which accounts for approximately 60-70% of total operating expenses (OpEx).
- Raw Materials: 60-70% of OpEx
- Utilities: 10-15% of OpEx
Financial Projection:
The financial projections for the proposed project have been developed based on realistic assumptions related to capital investment, operating costs, production capacity utilization, pricing trends, and demand outlook. These projections provide a comprehensive view of the project’s financial viability, ROI, profitability, and long-term sustainability.
Major Applications:
- Energy and Utilities: Flow batteries are a promising solution for large-scale energy storage in the energy sector. They are used to store energy from renewable sources like solar and wind, enabling utilities to smooth out the intermittency of renewable generation.
- Transportation and EV Charging: Flow batteries are being integrated into EV charging stations, offering a solution for storing energy generated from renewable sources for efficient and fast EV charging.
- Telecommunications: Flow batteries are used as backup power systems in the telecommunications sector, ensuring that communication services remain operational during power outages.
- Industrial and Commercial Applications: Flow batteries offer off-grid power solutions for industries with high energy demands. They can provide energy storage and backup for manufacturing plants, data centers, and other industrial operations.
Why Flow Battery Manufacturing?
- Growing Demand for Energy Storage: As renewable energy sources such as solar and wind become more prevalent, the need for energy storage systems is increasing to ensure a stable power supply.
- Sustainability and Environmental Benefits: Flow batteries use non-toxic, abundant materials like vanadium and are less harmful to the environment compared to traditional lead-acid or lithium-ion batteries.
- Energy Independence and Security: Flow batteries support off-grid power solutions, providing energy security for remote locations, critical infrastructure, and microgrids.
- Technological Advancements: Advancements in flow battery technology, such as improvements in efficiency, energy density, and cost, are making these systems more competitive with other forms of energy storage.
Transforming Vision into Reality:
This report provides the comprehensive blueprint needed to transform your flow battery manufacturing vision into a technologically advanced and highly profitable reality.
Flow Battery Industry Outlook 2026:
The primary drivers of the flow battery market are the increasing needs for energy storage solutions for the integration of renewable energy sources. According to the Ministry of New and Renewable Energy (MNRE), India is achieving rapid progress in the development of renewable energy, which is targeted to reach 500 GW of non-fossil fuel capacity by the year 2030. As governments are pursuing ambitious renewable energy goals, technologies like flow batteries are crucial for grid stabilization, integration of renewables, and peak shaving. Additionally, as the environment becomes of primary concern worldwide, the flow battery market is poised to grow as it is considered a green solution.
Leading Flow Battery Manufacturers:
Leading manufacturers in the global flow battery industry include several multinational companies with extensive production capacities and diverse application portfolios. Key players include:
- CellCube Energy Storage GmbH
- Elestor
- ESS Tech, Inc.
- Invinity Energy Systems
- Jena Flow Batteries GmbH
- Largo Inc.
- Primus Power
all of which serve end-use sectors such as energy & utilities, transportation, telecommunications, industrial applications, and residential & commercial.
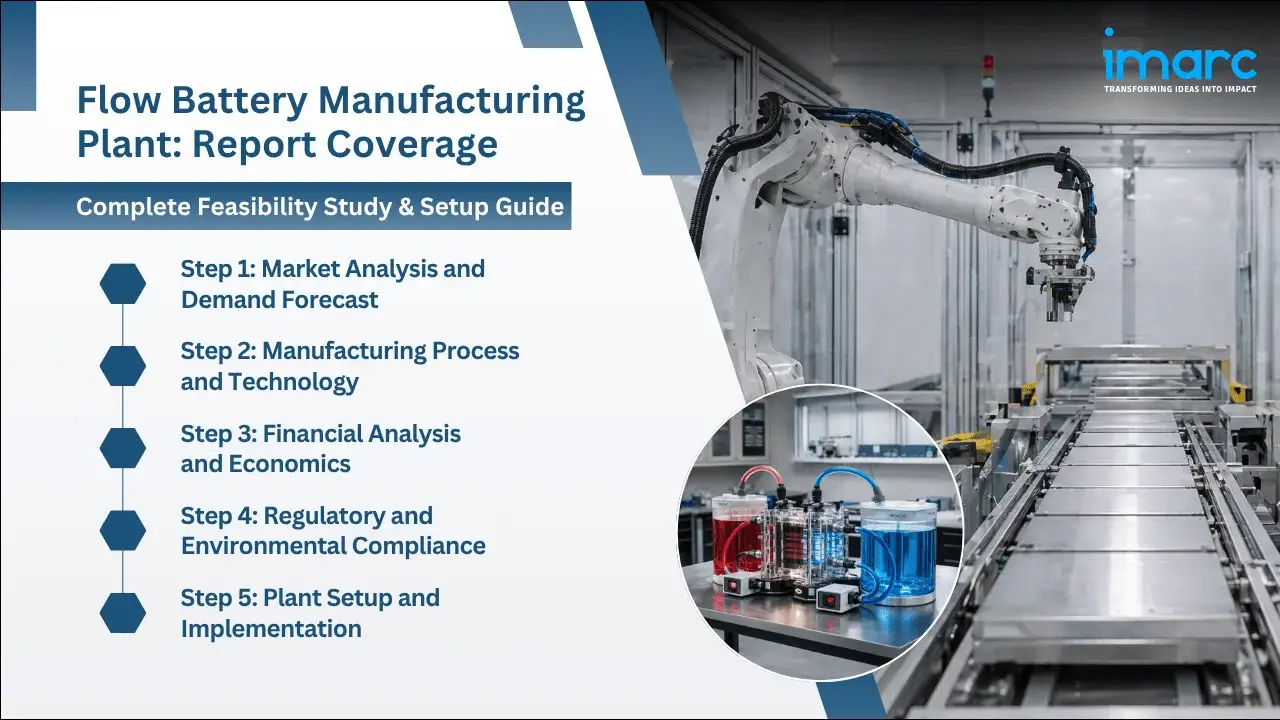
How to Setup a Flow Battery Manufacturing Plant?
Setting up a flow battery manufacturing plant requires evaluating several key factors, including technological requirements and quality assurance.
Some of the critical considerations include:
- Detailed Process Flow: The manufacturing process is a multi-step operation that involves several unit operations, material handling, and quality checks. Below are the main stages involved in the flow battery manufacturing process flow:
- Unit Operations Involved
- Mass Balance and Raw Material Requirements
- Quality Assurance Criteria
- Technical Tests
- Site Selection: The location must offer easy access to key raw materials such as vanadium electrolyte, membrane, stack components, and tanks. Proximity to target markets will help minimize distribution costs. The site must have robust infrastructure, including reliable transportation, utilities, and waste management systems. Compliance with local zoning laws and environmental regulations must also be ensured.
- Plant Layout Optimization: The layout should be optimized to enhance workflow efficiency, safety, and minimize material handling. Separate areas for raw material storage, production, quality control, and finished goods storage must be designated. Space for future expansion should be incorporated to accommodate business growth.
- Equipment Selection: High-quality, corrosion-resistant machinery tailored for flow battery manufacturing must be selected. Essential equipment includes electrolyte mixing equipment, flow cell assemblers, pumps & piping systems, and battery management systems. All machinery must comply with industry standards for safety, efficiency, and reliability.
- Raw Material Sourcing: Reliable suppliers must be secured for raw materials like vanadium electrolyte, membrane, stack components, and tanks to ensure consistent production quality. Minimizing transportation costs by selecting nearby suppliers is essential. Sustainability and supply chain risks must be assessed, and long-term contracts should be negotiated to stabilize pricing and ensure a steady supply.
- Safety and Environmental Compliance: Safety protocols must be implemented throughout the manufacturing procedure of the flow battery. Advanced monitoring systems should be installed to detect leaks or deviations in the process. Effluent treatment systems are necessary to minimize environmental impact and ensure compliance with emission standards.
- Quality Assurance Systems: A comprehensive quality control system should be established throughout production. Analytical instruments must be used to monitor product concentration, purity, and stability. Documentation for traceability and regulatory compliance must be maintained.
Project Economics:
Establishing and operating a flow battery manufacturing plant involves various cost components, including:
- Capital Investment: The total capital investment depends on plant capacity, technology, and location. This investment covers land acquisition, site preparation, and necessary infrastructure.
- Equipment Costs: Equipment costs, such as those for mixing equipment, flow cell assemblers, pumps & piping systems, and battery management systems, represent a significant portion of capital expenditure. The scale of production and automation level will determine the total cost of machinery.
- Raw Material Expenses: Raw materials, including core ingredients like vanadium electrolyte, membrane, stack components, and tanks, are a major part of operating costs. Long-term contracts with reliable suppliers will help mitigate price volatility and ensure a consistent supply of materials.
- Infrastructure and Utilities: Costs associated with land acquisition, construction, and utilities (electricity, water, steam) must be considered in the financial plan.
- Operational Costs: Ongoing expenses for labor, maintenance, quality control, and environmental compliance must be accounted for. Optimizing processes and providing staff training can help control these operational costs.
- Financial Planning: A detailed financial analysis, including income projections, expenditures, and break-even points, must be conducted. This analysis aids in securing funding and formulating a clear financial strategy.
Capital Expenditure (CapEx) and Operational Expenditure (OpEx) Analysis:
Capital Investment (CapEx): Machinery costs account for the largest portion of the total capital expenditure. The cost of land and site development, including charges for land registration, boundary development, and other related expenses, forms a substantial part of the overall investment. This allocation ensures a solid foundation for safe and efficient plant operations.
Operating Expenditure (OpEx): In the first year of operations, the operating cost for the flow battery manufacturing plant is projected to be significant, covering raw materials, utilities, depreciation, taxes, packing, transportation, and repairs and maintenance. By the fifth year, the total operational cost is expected to increase substantially due to factors such as inflation, market fluctuations, and potential rises in the cost of key materials. Additional factors, including supply chain disruptions, rising consumer demand, and shifts in the global economy, are expected to contribute to this increase.
.webp)
Capital Expenditure Breakdown:
| Particulars | Cost (in US$) |
|---|---|
| Land and Site Development Costs | XX |
| Civil Works Costs | XX |
| Machinery Costs | XX |
| Other Capital Costs | XX |
To access CapEx Details, Request Sample
Operational Expenditure Breakdown:
| Particulars | In % |
|---|---|
| Raw Material Cost | 60-70% |
| Utility Cost | 10-15% |
| Transportation Cost | XX |
| Packaging Cost | XX |
| Salaries and Wages | XX |
| Depreciation | XX |
| Taxes | XX |
| Other Expenses | XX |
To access OpEx Details, Request Sample
Profitability Analysis:
| Particulars | Unit | Year 1 | Year 2 | Year 3 | Year 4 | Year 5 | Average |
|---|---|---|---|---|---|---|---|
| Total Income | US$ | XX | XX | XX | XX | XX | XX |
| Total Expenditure | US$ | XX | XX | XX | XX | XX | XX |
| Gross Profit | US$ | XX | XX | XX | XX | XX | XX |
| Gross Margin | % | XX | XX | XX | XX | XX | 35-45% |
| Net Profit | US$ | XX | XX | XX | XX | XX | XX |
| Net Margin | % | XX | XX | XX | XX | XX | 15-25% |
To access Financial Analysis, Request Sample
Latest Industry Developments:
- February 2026: Uniper signed a conditional supply contract of 5GWh with CMBlu Energy for its organic flow batteries. This agreement targets the deployment of large-scale energy storage solutions, a crucial aspect for combining renewable energy sources. This is aimed towards the deployment of sustainable storage solutions instead of using conventional lithium-ion batteries as sources of power.
- September 2025: BESSt developed a redox flow battery employing zinc-polyiodide materials, which offers an energy density of 320 Wh/L, thus being an improved version of the energy storage system. With its development, the company is offering a cost-effective and eco-friendly solution for an energy storage device.
Report Coverage:
| Report Features | Details |
|---|---|
| Product Name | Flow Battery |
| Report Coverage | Detailed Process Flow: Unit Operations Involved, Quality Assurance Criteria, Technical Tests, Mass Balance, and Raw Material Requirements Land, Location and Site Development: Selection Criteria and Significance, Location Analysis, Project Planning and Phasing of Development, Environmental Impact, Land Requirement and Costs Plant Layout: Importance and Essentials, Layout, Factors Influencing Layout Plant Machinery: Machinery Requirements, Machinery Costs, Machinery Suppliers (Provided on Request) Raw Materials: Raw Material Requirements, Raw Material Details and Procurement, Raw Material Costs, Raw Material Suppliers (Provided on Request) Packaging: Packaging Requirements, Packaging Material Details and Procurement, Packaging Costs, Packaging Material Suppliers (Provided on Request) Other Requirements and Costs: Transportation Requirements and Costs, Utility Requirements and Costs, Energy Requirements and Costs, Water Requirements and Costs, Human Resource Requirements and Costs Project Economics: Capital Costs, Techno-Economic Parameters, Income Projections, Expenditure Projections, Product Pricing and Margins, Taxation, Depreciation Financial Analysis: Liquidity Analysis, Profitability Analysis, Payback Period, Net Present Value, Internal Rate of Return, Profit and Loss Account, Uncertainty Analysis, Sensitivity Analysis, Economic Analysis Other Analysis Covered in The Report: Market Trends and Analysis, Market Segmentation, Market Breakup by Region, Price Trends, Competitive Landscape, Regulatory Landscape, Strategic Recommendations, Case Study of a Successful Venture |
| Currency | US$ (Data can also be provided in the local currency) |
| Customization Scope | The report can also be customized based on the requirement of the customer |
| Post-Sale Analyst Support | 10-12 Weeks |
| Delivery Format | PDF and Excel through email (We can also provide the editable version of the report in PPT/Word format on special request) |
Report Customization
While we have aimed to create an all-encompassing flow battery plant project report, we acknowledge that individual stakeholders may have unique demands. Thus, we offer customized report options that cater to your specific requirements. Our consultants are available to discuss your business requirements, and we can tailor the report's scope accordingly. Some of the common customizations that we are frequently requested to make by our clients include:
- The report can be customized based on the location (country/region) of your plant.
- The plant’s capacity can be customized based on your requirements.
- Plant machinery and costs can be customized based on your requirements.
- Any additions to the current scope can also be provided based on your requirements.
Why Buy IMARC Reports?
- The insights provided in our reports enable stakeholders to make informed business decisions by assessing the feasibility of a business venture.
- Our extensive network of consultants, raw material suppliers, machinery suppliers and subject matter experts spans over 100+ countries across North America, Europe, Asia Pacific, South America, Africa, and the Middle East.
- Our cost modeling team can assist you in understanding the most complex materials. With domain experts across numerous categories, we can assist you in determining how sensitive each component of the cost model is and how it can affect the final cost and prices.
- We keep a constant track of land costs, construction costs, utility costs, and labor costs across 100+ countries and update them regularly.
- Our client base consists of over 3000 organizations, including prominent corporations, governments, and institutions, who rely on us as their trusted business partners. Our clientele varies from small and start-up businesses to Fortune 500 companies.
- Our strong in-house team of engineers, statisticians, modeling experts, chartered accountants, architects, etc. has played a crucial role in constructing, expanding, and optimizing sustainable manufacturing plants worldwide.
Need more help?
- Speak to our experienced analysts for insights on the current market scenarios.
- Include additional segments and countries to customize the report as per your requirement.
- Gain an unparalleled competitive advantage in your domain by understanding how to utilize the report and positively impacting your operations and revenue.
- For further assistance, please connect with our analysts.


Factory Setup Services
IMARC Group's factory setup services streamline the entire establishment process, ensuring efficient planning, seamless execution, and optimal operational readiness for your manufacturing facility.


Site Selection Services
IMARC Group's site selection services optimize location choices for businesses, ensuring strategic, cost-effective, and efficient manufacturing operations.


Factory Audit Services
IMARC Group's plant audit services offer comprehensive evaluations of your industrial facility's health, efficiency, and regulatory compliance.


Regulatory Approvals, and Licensing Services
IMARC Group's regulatory approval and licensing services ensure businesses meet all compliance requirements, facilitating smooth and timely market entry.
 Inquire Before Buying
 Speak to an Analyst
 Request Brochure
 Request Customization
Frequently Asked Questions
Capital requirements generally include land acquisition, construction, equipment procurement, installation, pre-operative expenses, and initial working capital. The total amount varies with capacity, technology, and location.
To start a flow battery manufacturing business, one needs to conduct a market feasibility study, secure required licenses, arrange funding, select suitable land, procure equipment, recruit skilled labor, and establish a supply chain and distribution network.
Flow battery manufacturing requires raw materials such as vanadium, bauxite, graphite, and specialized polymers for components like electrolytes, bipolar plates, and membranes. Other chemistries use different materials, such as iron-chromium for electrolytes or zinc-bromine systems, with their own unique sets of raw materials like bauxite for aluminum or various types of hydrocarbon membranes.
A flow battery factory typically requires slurry mixers, electrode coaters, laminators, cell assembly and stacking machines, sealing equipment, and comprehensive testing and formation systems. You will also need a battery management system (BMS) integration setup and equipment for tank and plumbing assembly.
The main steps generally include:
-
Electrolyte chemicals formulated to required specifications
-
Ion-exchange membranes prepared, and quality checked
-
Electrode materials coated and assembled carefully
-
Cell stacks built with precision sealing
-
Electrolyte tanks fabricated and leak-tested
-
Pumps, sensors, and piping integrated safely
-
System filled and tested for performance
-
Battery packaged for distribution and deployment
Usually, the timeline can range from 18 to 48 months to start a flow battery manufacturing plant, depending on factors like site development, machinery installation, environmental clearances, safety measures, and trial runs.
Challenges may include high capital requirements, securing regulatory approvals, ensuring raw material supply, competition, skilled manpower availability, and managing operational risks.
Typical requirements include business registration, environmental clearances, factory licenses, fire safety certifications, and industry-specific permits. Local/state/national regulations may apply depending on the location.
The top flow battery manufacturers are:
-
Invinity Energy Systems
-
Sumitomo Electric Industries, Ltd.
-
VRB Energy
-
ESS Tech, Inc.
-
Largo Inc.
Profitability depends on several factors including market demand, manufacturing efficiency, pricing strategy, raw material cost management, and operational scale. Profit margins usually improve with capacity expansion and increased capacity utilization rates.
Cost components typically include:
-
Land and Infrastructure
-
Machinery and Equipment
-
Building and Civil Construction
-
Utilities and Installation
-
Working Capital
Break even in a flow battery manufacturing business typically range from 5 to 8 years, depending on scale, regulatory compliance costs, raw material pricing, and market demand. Efficient manufacturing and export opportunities can help accelerate returns.
Governments may offer incentives such as capital subsidies, tax exemptions, reduced utility tariffs, export benefits, or interest subsidies to promote manufacturing under various national or regional industrial policies.
Financing can be arranged through term loans, government-backed schemes, private equity, venture capital, equipment leasing, or strategic partnerships. Financial viability assessments help identify optimal funding routes.