
Fluorite Prices, Trend, Chart, Demand, Market Analysis, News, Historical and Forecast Data Report 2026 Edition
Fluorite Price Trend, Index and Forecast
Track real-time and historical fluorite prices across global regions. Updated monthly with market insights, drivers, and forecasts.
Fluorite Prices June 2026
| Region | Price (USD/KG) | Latest Movement |
|---|---|---|
| Northeast Asia | 0.51 | -7.3% ↓ Down |
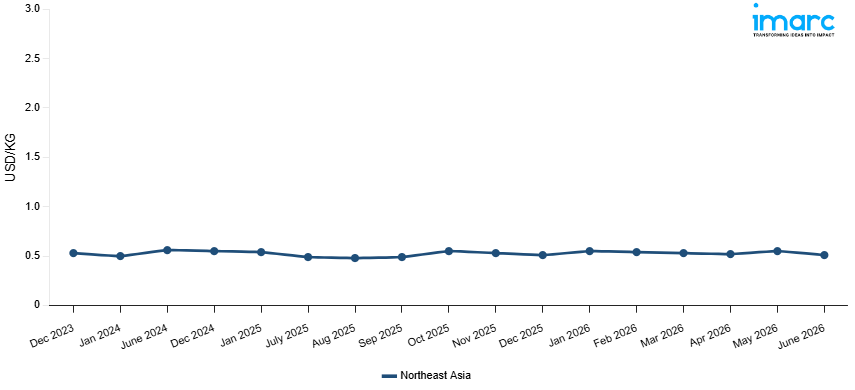
Fluorite Price Index (USD/KG):
The chart below highlights monthly fluorite prices across different regions.
Get Access to Monthly/Quarterly/Yearly Prices, Request Sample
Market Overview Q1 Ending March 2026
Northeast Asia: The fluorite prices in Northeast Asia reached 0.53 USD/KG in March 2026. The upward pricing movement registered between December and March 2026 was 3.9%. Marginally firming demand from the hydrofluoric acid, aluminum smelting, and specialty chemical manufacturing sectors provided modest procurement support and contributed to mildly bullish conditions across Northeast Asian markets during the review period. Slightly elevated upstream fluorspar mining and processing costs at regional production facilities placed incremental upward pressure on fluorite manufacturing expenses and supported the prevailing marginal price increase throughout the quarter. Steady domestic production from Chinese and regional mining operations maintained an adequate supply and limited upward price movement during the period. Measured restocking activity by downstream hydrofluoric acid and aluminum manufacturers, reflecting cautious but positive market sentiment, contributed to the prevailing mildly bullish pricing conditions throughout the review period.
Market Overview Q4 Ending December 2025
Northeast Asia: The fluorite prices in Northeast Asia reached 0.51 USD/KG in December 2025. The upward pricing movement registered between September and December 2025 was 5.0%. Strong demand from the steel production, hydrofluoric acid, and aluminum smelting flux industries, which increased procurement activity amid steady downstream consumption trends throughout the quarter, was the main driver of the moderate price appreciation. Regional producers' production costs increased due to rising upstream mining and beneficiation costs, reinforcing upward pricing dynamics. Regional availability was further constrained by tighter supply conditions resulting from production curtailments at key mining sites due to environmental compliance requirements. Strong offtake fundamentals were also maintained by consistent demand from the fluoropolymer and refrigerant gas manufacturing segments, and procurement competitiveness was increased by downstream users' strategic inventory building in anticipation of ongoing supply constraints.
Market Overview Q3 Ending September 2025
Northeast Asia: Fluorite prices in Northeast Asia experienced a slight increase as steady demand from hydrofluoric acid producers and aluminum smelting industries supported procurement activity. The fluorite price index reflected consistent consumption levels, particularly from chemical manufacturing and steelmaking applications. While mining output remained stable, moderate logistical challenges and improved downstream offtake contributed to a firmer pricing environment. Limited export opportunities prevented sharper gains, but resilient regional demand ensured that prices trended upward, albeit modestly, throughout this quarter.
Fluorite Price Trend, Market Analysis, and News
IMARC's latest publication, “Fluorite Prices, Trend, Chart, Demand, Market Analysis, News, Historical and Forecast Data Report 2026 Edition,” presents a detailed examination of the fluorite market, providing insights into both global and regional trends that are shaping prices. This report delves into the spot price of fluorite at major ports and analyzes the composition of prices, including FOB and CIF terms. It also presents detailed fluorite prices trend analysis by region, covering North America, Europe, Asia Pacific, Latin America, and Middle East and Africa. The factors affecting fluorite pricing, such as the dynamics of supply and demand, geopolitical influences, and sector-specific developments, are thoroughly explored. This comprehensive report helps stakeholders stay informed with the latest market news, regulatory updates, and technological progress, facilitating informed strategic decision-making and forecasting.
Fluorite Industry Analysis
The global fluorite industry size reached 9.73 Million Tons in 2025. By 2034, IMARC Group expects the market to reach 14.82 Million Tons, at a projected CAGR of 4.78% during 2026-2034. Market expansion is supported by rising consumption of fluorite in hydrofluoric acid production, increased applications in the steel and aluminum industries, and growing use in the manufacture of fluorochemicals. Additionally, advancements in mining and beneficiation processes are enhancing supply efficiency, further reinforcing global market growth.
Latest developments in the Fluorite Industry:
- July 2025: Tivan Limited, Sumitomo Corporation, and JOGMEC formed an incorporated joint venture for the development, financing, and operation of the Speewah Fluorite Project in Western Australia. Sumitomo and the Japan Fluorite Corporation (a JOGMEC-subsidiary) committed an initial USD 5.3 million equity investment to secure a 7.5% stake.
- February 2023: Sojitz Corporation, Mexichem Fluor, S.A. de C.V., and Mexichem Fluor Japan Ltd. signed an agreement with Kitakyishi City to establish a stable domestic supply of fluorinated materials.
Product Description
Fluorite, also known as fluorspar (CaF₂), is a naturally occurring mineral composed primarily of calcium fluoride. It appears in a variety of colors, ranging from purple and green to clear, due to trace impurities. With a low hardness but excellent cleavage, fluorite is valued for both its industrial utility and ornamental applications. The mineral is a critical feedstock for the production of hydrofluoric acid, which in turn is used in the manufacture of refrigerants, fluoropolymers, and other fluorochemicals. In the steel industry, fluorite functions as a flux, reducing the melting point of raw materials to facilitate efficient processing. It is also employed in aluminum smelting, glassmaking, and ceramics. Due to its wide-ranging industrial applications, fluorite plays an essential role in chemical and metallurgical processes worldwide.
Report Coverage
| Key Attributes | Details |
|---|---|
| Product Name | Fluorite |
| Report Features | Exploration of Historical Trends and Market Outlook, Industry Demand, Industry Supply, Gap Analysis, Challenges, Fluorite Price Analysis, and Segment-Wise Assessment. |
| Currency/Units | US$ (Data can also be provided in local currency) or Metric Tons |
| Region/Countries Covered | The current coverage includes analysis at the global and regional levels only. Based on your requirements, we can also customize the report and provide specific information for the following countries: Asia Pacific: China, India, Indonesia, Pakistan, Bangladesh, Japan, Philippines, Vietnam, Thailand, South Korea, Malaysia, Nepal, Taiwan, Sri Lanka, Hongkong, Singapore, Australia, and New Zealand Europe: Germany, France, United Kingdom, Italy, Spain, Russia, Turkey, Netherlands, Poland, Sweden, Belgium, Austria, Ireland, Switzerland, Norway, Denmark, Romania, Finland, Czech Republic, Portugal and Greece North America: United States and Canada Latin America: Brazil, Mexico, Argentina, Columbia, Chile, Ecuador, and Peru Middle East & Africa: Saudi Arabia, UAE, Israel, Iran, South Africa, Nigeria, Oman, Kuwait, Qatar, Iraq, Egypt, Algeria, and Morocco The list of countries presented is not exhaustive. Information on additional countries can be provided if required by the client. |
| Information Covered for Key Suppliers |
|
| Customization Scope | The report can be customized as per the requirements of the customer |
| Report Price and Purchase Option |
Plan A: Monthly Updates - Annual Subscription
Plan B: Quarterly Updates - Annual Subscription
Plan C: Biannually Updates - Annual Subscription
|
| Post-Sale Analyst Support | 360-degree analyst support after report delivery |
| Delivery Format | PDF and Excel through email (We can also provide the editable version of the report in PPT/Word format on special request) |
Key Benefits for Stakeholders:
- IMARC’s report presents a detailed analysis of fluorite pricing, covering global and regional trends, spot prices at key ports, and a breakdown of Ex Works, FOB, and CIF prices.
- The study examines factors affecting fluorite price trend, including raw material costs, supply-demand shifts, geopolitical impacts, and industry developments, offering insights for informed decision-making.
- The competitive landscape review equips stakeholders with crucial insights into the latest market news, regulatory changes, and technological advancements, ensuring a well-rounded, strategic overview for forecasting and planning.
- IMARC offers various subscription options, including monthly, quarterly, and biannual updates, allowing clients to stay informed with the latest market trends, ongoing developments, and comprehensive market insights. The fluorite price charts ensure our clients remain at the forefront of the industry.
Frequently Asked Questions About the Fluorite Price Trend Report
The fluorite price in June 2026 was 0.51 USD/Kg in Northeast Asia.
The fluorite pricing data is updated on a monthly basis.
We provide the pricing data primarily in the form of an Excel sheet and a PDF.
Yes, our report includes a forecast for fluorite prices.
The regions covered include North America, Europe, Asia Pacific, Middle East, and Latin America. Countries can be customized based on the request (additional charges may be applicable).
Yes, we provide both FOB and CIF prices in our report.
Need more help?
- Speak to our experienced analysts for insights on the current market scenarios.
- Include additional segments and countries to customize the report as per your requirement.
- Gain an unparalleled competitive advantage in your domain by understanding how to utilize the report and positively impacting your operations and revenue.
- For further assistance, please connect with our analysts.
 Request Customization
 Inquire Before Buying
 Speak to an Analyst
 Request Brochure
Benefits of Customization
- Personalize this research
- Triangulate with your data
- Get data as per your format and definition
- Gain a deeper dive into a specific application, geography, customer, or competitor
- Any level of personalization
Get in Touch With Us
UNITED STATES
Phone: +1-201-971-6302
INDIA
Phone: +91-120-433-0800
UNITED KINGDOM
Phone: +44-753-714-6104
Email: [email protected]
Client Testimonials


.webp)


Why Choose Us
IMARC offers trustworthy, data-centric insights into commodity pricing and evolving market trends, enabling businesses to make well-informed decisions in areas such as procurement, strategic planning, and investments. With in-depth knowledge spanning more than 1000 commodities and a vast global presence in over 150 countries, we provide tailored, actionable intelligence designed to meet the specific needs of diverse industries and markets.
1000
+Commodities
150
+Countries Covered
3000
+Clients
20
+Industry
Robust Methodologies & Extensive Resources
IMARC delivers precise commodity pricing insights using proven methodologies and a wealth of data to support strategic decision-making.
Subscription-Based Databases
Our extensive databases provide detailed commodity pricing, import-export trade statistics, and shipment-level tracking for comprehensive market analysis.
Primary Research-Driven Insights
Through direct supplier surveys and expert interviews, we gather real-time market data to enhance pricing accuracy and trend forecasting.
Extensive Secondary Research
We analyze industry reports, trade publications, and market studies to offer tailored intelligence and actionable commodity market insights.
Trusted by 3000+ industry leaders worldwide to drive data-backed decisions. From global manufacturers to government agencies, our clients rely on us for accurate pricing, deep market intelligence, and forward-looking insights.