
Fly Ash Market Size, Share, Trends and Forecast by Type, Application, and Region, 2026-2034
Fly Ash Market Size and Share:
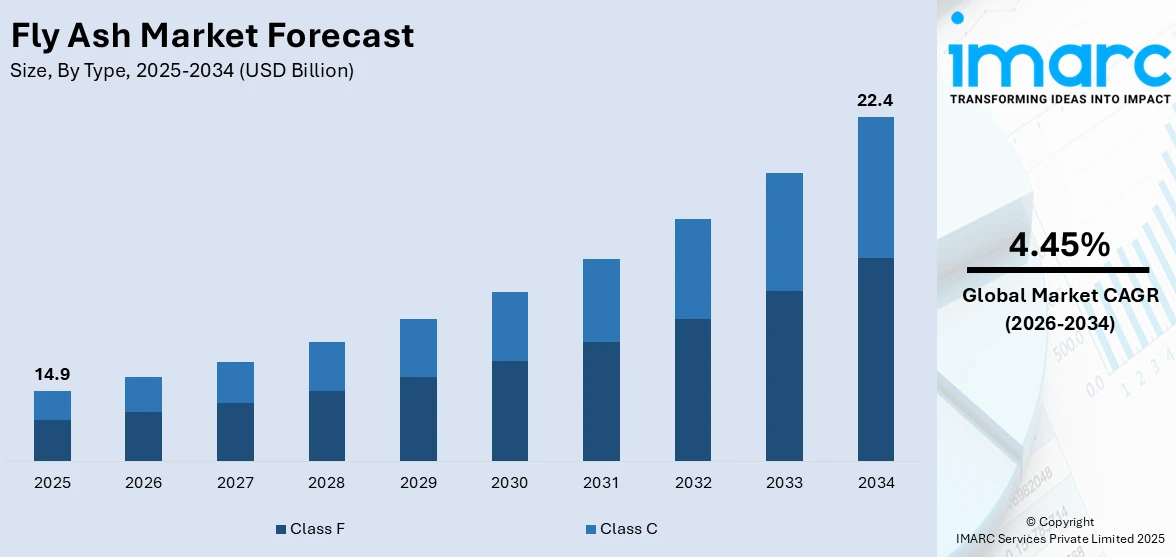
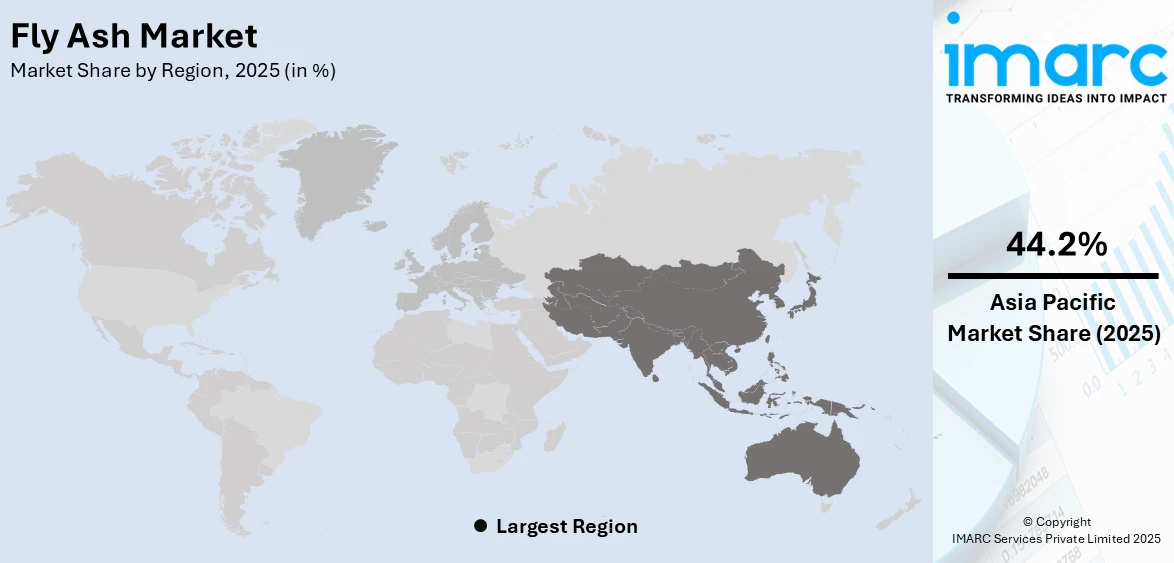
The global fly ash market size was valued at USD 14.9 Billion in 2025. Looking forward, IMARC Group estimates the market to reach USD 22.4 Billion by 2034, exhibiting a CAGR of 4.45% during 2026-2034. Asia-Pacific currently dominates the market, holding a significant market share of over 44.2% in 2025. The rising focus on maintaining environmental sustainability to lower carbon footprint, increasing number of residential and commercial spaces worldwide, and the growing need for coal ash remediation to reduce the use of raw materials are impelling the fly ash market demand.
|
Report Attribute
|
Key Statistics
|
|---|---|
|
Base Year
|
2025
|
|
Forecast Years
|
2026-2034
|
|
Historical Years
|
2020-2025
|
| Market Size in 2025 | USD 14.9 Billion |
| Market Forecast in 2034 | USD 22.4 Billion |
| Market Growth Rate 2026-2034 | 4.45% |
The key driving factor in the market for fly ash is the rising demand in sustainable building materials led, facilitated by infrastructure growth and urbanization. The application of fly ash reduces carbon emissions with lower greenhouse gases produced while cement's partial replacement is seen to make the concrete product tougher and harder. This, along with governmental legislation endorsing green-friendly methods of building along with managing wastes supports the market growth further. The widespread product adoption in road construction, bricks, and agriculture, along with the development of processing technologies, is driving the growth of the fly ash market. Strategic collaborations for sustainability and circular economy practices are also being observed in the fly ash market. For example, in May 2024, Bharat Aluminium Company Limited (BALCO) announced its partnership with Shree Cement Limited to supply 90,000 metric tonnes of fly ash for low-carbon cement production. This collaboration on sustainable practices among cement industries worldwide is expected to help with carbon emission minimization and popularize circular economies using fly ash, which, in turn, is projected to contribute to the market growth.
To get more information on this market Request Sample
Factors driving the fly ash market demand in the US include improved investments in developing infrastructure and heightened adoption of sustainable constructions. The material has the potential to enhance concrete durability, reduce costs, and lower carbon emissions, making it an attractive alternative to traditional cement. Government initiatives promoting the use of industrial by-products in construction further support demand. The growing focus on highway and road construction projects also boosts fly ash consumption in asphalt and concrete applications. The market is also witnessing significant advancements through strategic collaborations aimed at sustainability and innovation. For example, in January 2024, Eco Material Technologies announced that it had formed a partnership with Alabama Power to utilize more than 700,000 tons of stored coal ash per year into sustainable construction materials. This supports "Made in America" products, which decreases dependence on imported products and enhances the strength and durability of concrete while addressing carbon emissions from the cement industry.
Fly Ash Market Trends:
Rising Focus on Maintaining Sustainability
The increasing focus on maintaining sustainability is catalyzing the fly ash market demand. People are becoming aware about the harmful impacts of pollution on health. According to the World Health Organization (WHO), air pollution kills an estimated seven million people worldwide every year. According to industry reports, 9 out of 10 people breathe air containing high levels of pollutants. Apart from this, several industry players in the market are focusing on innovative solutions that benefit in lowering carbon emissions. On 10 February 2022, Eco Material Technologies completed the acquisitions of Boral Resources, North American fly ash business, and Green Cement Inc, a manufacturer of near-zero carbon cement alternatives. The company’s prime focus through this acquisition was on decarbonizing the materials industry through scalable and proven technological solutions.
Increasing Construction Activities
The global buildings construction market is anticipated to reach 5.13% CAGR during 2024-2032, as per the research report of IMARC Group. The rising construction of residential and commercial buildings is offering a positive fly ash market outlook. In line with this, the increasing focus on home renovation due to changing living standards of individuals is catalyzing the demand for fly ash in construction materials. Fly ash is used to create ready-mix concrete and concrete blocks and pipes. Furthermore, fly-ash-based concrete mixes benefit in preventing cracking or expansion and reducing permeability. Concrete containing fly ash exhibits improved resistance to sulfate attack, alkali-silica reaction, and other forms of deterioration, leading to long-term durability of structures. As the demand for sustainable construction materials rises, the fly ash market share is expected to grow significantly in the coming years.
Growing Need for Coal Ash Remediation
The rising focus on coal ash remediation to reduce the use of raw materials is contributing to the growth of the market. It also plays a crucial role in lowering greenhouse gas (GHG) emissions and decreasing the cost of coal ash disposal. Apart from this, companies in the fly ash market are adopting this method to broaden their market presence. For instance, on 13 January 2023, NorthStar Group, a portfolio company of investment affiliates of J.F. Lehman and Company (JFLCO), announced the completion of the acquisition of Trans Ash Inc., enhancing NorthStar’s existing capabilities serving the coal ash remediation market. The growing focus on coal ash remediation is expected to drive significant growth in the fly ash market, with analysts projecting a positive fly ash market forecast in the coming years. As a result, the fly ash market forecast indicates strong growth driven by these strategic initiatives and ongoing environmental concerns.
Fly Ash Industry Segmentation:
IMARC Group provides an analysis of the key trends in each segment of the global fly ash market, along with forecasts at the global, regional, and country levels from 2026-2034. The market has been categorized based on type and application.

Analysis by Type:
- Class F
- Class C
Class F stand as the largest type in 2025, holding around 60.0% of the market. In 2025, Class F represented the dominant type, making up approximately 60.0% of the market. This fly ash, usually sourced from bituminous and anthracite coals, is mainly composed of an alumino-silicate glass, along with quartz, mullite, and magnetite. It contains less than 10% calcium oxide (CaO) and generates lower heat during hydration. It offers enhanced late compressive strengths, increased resistance to alkali silica reaction (ASR), improved pore refinement, and decreased permeability as compared to unmodified Portland cement. Besides this, it is beneficial in lowering the demand for water and increasing workability. Furthermore, top industry players are extending their agreements to expand the reach of their products.
Analysis by Application:
Access the comprehensive market breakdown Request Sample
- Construction
- Bricks and Blocks
- Road Construction
- Portland Cement and Concrete
- Agriculture
- Mining
- Water Treatment
- Others
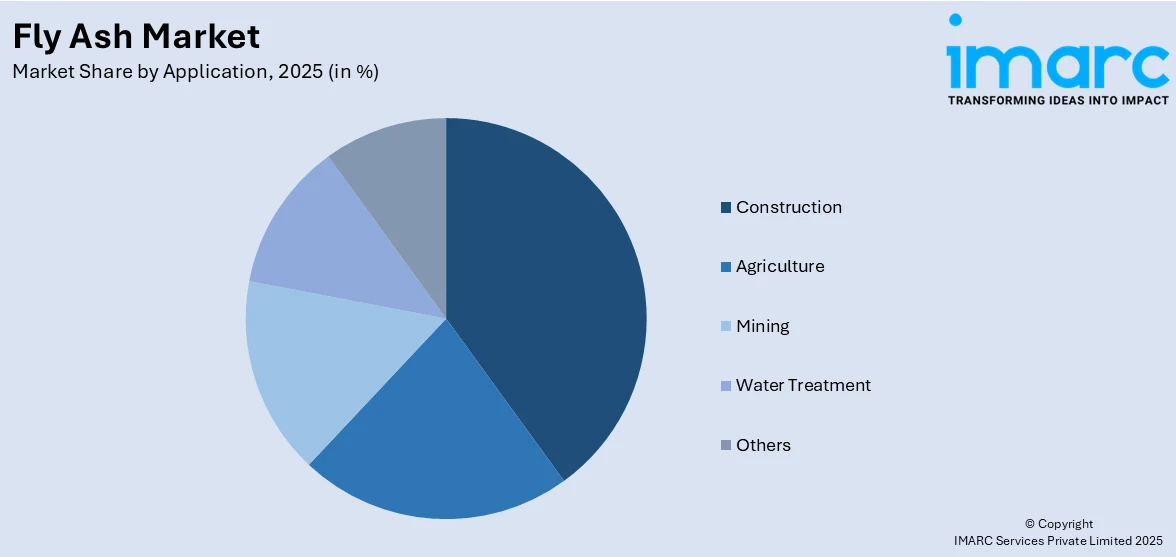
Construction leads the market with around 40.0% of market share in 2025. The rising usage of fly ash in the construction sector as structural fill for road construction is supporting the market growth. It is also used to produce bricks, ceramic tiles, plaster, Portland cement, hot mix asphalt, grout fill, and ready-mix cement. Incorporating fly ash into concrete minimizes cracking, bleeding, and permeability resulting in a dense and highly durable concrete that withstands sulphates and alkali-aggregate reactions. This concrete mix also requires less water and tends to resist shrinking. In addition, fly ash recycles coal burning waste and reduces carbon dioxide (CO₂) emissions. It is a cost-effective alternative to Portland cement for the construction of residential, commercial, or industrial spaces. Furthermore, the increasing focus on infrastructure development due to rapid urbanization across the globe is impelling the market growth. According to the United Nations Conference on Trade and Development (UNCTAD), approximately 57% of the world’s population lived in urban areas in 2022.
Regional Analysis:
To get more information on the regional analysis of this market Request Sample
- North America
- United States
- Canada
- Asia-Pacific
- China
- Japan
- India
- South Korea
- Australia
- Indonesia
- Others
- Europe
- Germany
- France
- United Kingdom
- Italy
- Spain
- Russia
- Others
- Latin America
- Brazil
- Mexico
- Others
- Middle East and Africa
In 2025, Asia-Pacific accounted for the largest fly ash market share, accounting 44.2%. There is a rise in the demand for fly ash in the Asia Pacific region driven by the thriving construction sector, particularly in India and China. As per Invest India, the construction industry in India is anticipated to reach USD 1.4 Trillion by 2025. In addition to this, the country witnessed high investments in the construction of roads. The total length of National Highways (NH) in the country was 1,44,634 km as of November 2022, as stated by the India Brand Equity Foundation (IBEF). These investments demonstrate the burgeoning construction sector, thereby catalyzing the demand for fly ash in concretes for enhanced performance and workability and increasing fly ash market price.
Key Regional Takeaways:
North America Fly Ash Market Analysis
The North America fly ash market is driven by increasing emphasis on sustainability and the adoption of ecofriendly construction practices. The material’s ability to enhance concrete properties such as durability, strength, and workability while reducing production costs makes it a preferred choice for the construction industry. Growing infrastructure projects including transportation networks and commercial buildings further fuel demand. Advancements in processing and classification technologies are improving the quality and versatility of fly ash broadening its applications. Regulatory focus on reducing carbon emissions and promoting sustainable building materials supports market growth. Collaborations among utility companies, policymakers, and construction firms are enhancing the collection, storage, and distribution of fly ash contributing to its growing adoption in construction projects.
United States Fly Ash Market Analysis
In 2025, the United States captured 85.00% of revenue in the North American market. The rising focus on sustainability and tightening environmental regulations is a major factor driving this trend. Fly ash, which is produced during coal combustion in power plants, is extensively used as a supplementary cementitious material (SCM) in the production of concrete. By incorporating fly ash, manufacturers can reduce the carbon footprint of cement production, aligning with stringent environmental mandates and global decarbonization goals. Additionally, the economic benefits of fly ash are significant. Its use in concrete improves workability, durability, and strength while lowering overall production costs. This makes it a cost-effective alternative for the construction industry, which is constantly seeking ways to optimize resources and reduce expenses. The growing infrastructure development across the U.S., including highways, bridges, and commercial buildings, further impels the demand for fly ash. In 2023, the construction industry accounted for 4.3% of the U.S. gross domestic product (GDP). Besides this, technological advancements in the processing and classification of fly ash are enhancing its quality and broadened its applications. The shift toward sustainable construction practices and green building certifications is catalyzing the demand for eco-friendly construction material. Furthermore, collaboration between utility companies, construction firms, and policymakers are leading to improved collection, storage, and distribution of fly ash.
Europe Fly Ash Market Analysis
The region's focus on sustainability, stringent environmental regulations, and advancements in construction technologies is impelling the market growth. Fly ash is a residual product from burning coal which is commonly utilized as a supplementary cementitious material (SCM) in the manufacturing of concrete. Its adoption aligns with the European Union’s stringent policies on waste reduction, circular economy practices, and the decarbonization of the construction sector. A key driver is the increasing focus on reducing the carbon footprint of construction materials. Fly ash can partially replace Portland cement in concrete, significantly lowering CO₂ emissions during production. This is particularly important as the construction industry strives to meet the European Green Deal targets and other climate change mitigation goals. The adoption of fly ash is further supported by green building certifications, which encourage the use of eco-friendly materials. Economic benefits also play a critical role in driving demand for fly ash in Europe. Its use in concrete enhances durability, workability, and strength while reducing overall production costs. These attributes make it a cost-effective solution for infrastructure projects, particularly in regions where high-quality construction materials are in demand. Large-scale infrastructure projects, such as transportation networks and renewable energy installations, are key contributors to market growth. According to the Wind Europe, the region installed 18.3 GW of new wind power capacity in 2023. Additionally, government initiatives and collaborations between power plants, construction companies, and regulatory bodies ensure a steady supply of high-quality fly ash.
Latin America Fly Ash Market Analysis
The Latin America fly ash market is driven by growing infrastructure development, urbanization, and an increasing focus on sustainable construction practices. The CIA reports that the urban population in Mexico was 81.6% of total population in 2023. Rapid economic growth and urban expansion in countries like Brazil, Mexico, and Argentina is catalyzing the demand for cost-effective and durable construction materials. Fly ash is widely used as a supplementary cementitious material (SCM) in concrete production, offering enhanced strength, durability, and workability while reducing material costs. Environmental considerations also play a significant role, with governments and industries promoting the use of fly ash to reduce landfill waste and carbon emissions in construction. As sustainability gains traction, fly ash’s ability to lower cement production’s carbon footprint aligns with global and regional green building initiatives. Additionally, ongoing infrastructure projects, such as transportation networks and energy facilities, drive demand for high-performance materials.
Middle East and Africa Fly Ash Market Analysis
The fly ash market in the Middle East and Africa is propelled by swift urban development and an increasing emphasis on sustainable building methods. The extensive developments in the region, such as smart cities, transport systems, and energy frameworks, especially in Gulf Cooperation Council (GCC) nations, are driving the need for high-performance construction materials. According to the IMARC Group, the GCC smart cities market is expected to show a CAGR of 15.9% from 2024 to 2032. Furthermore, regulatory bodies and sectors in the area are prioritizing waste repurposing and carbon minimization in construction, in line with both global and local sustainability objectives. Fly ash aids in lessening environmental effects by decreasing landfill waste and the carbon emissions from cement manufacturing.
Competitive Landscape:
The fly ash market is highly competitive with players focusing on innovation, sustainability, and strategic partnerships to strengthen their positions. Companies are investing in advanced processing technologies to enhance the quality and classification of fly ash enabling broader applications in construction and industrial sectors. Sustainability drives competition with firms aligning with global decarbonization goals and promoting ecofriendly practices. For instance, in March 2024, Holcim North America launched ECOAsh a beneficiated fly ash product to promote low-carbon and circular building practices. The innovative processing facility in Alberta seeks to meet the rising demand for high-quality materials while advancing sustainability in construction. Collaborations with power plants for efficient ash collection and distribution are critical to maintaining supply chains. Market players are targeting infrastructure projects by offering cost effective and durable solutions that meet stringent environmental regulations. Rising competition from alternative materials and regional disparities in fly ash availability challenge the market prompting participants to explore new applications and expand their geographic presence.
The report provides a comprehensive analysis of the competitive landscape in the fly ash market with detailed profiles of all major companies, including:
- Aceton Industries LLP
- Ashtech India Pvt. Ltd.
- Boral Limited
- Cemex S.A.B. de C.V.
- Charah Solutions Inc.
- Holcim Group
- National Minerals Corporation
- Salt River Materials Group
- Suyog Suppliers
- The SEFA Group
- Titan America LLC (Titan Cement International SA)
- Waste Management Inc.
Latest News and Developments:
- November 2024: Titan America announced its acquisition of D.M. Conner Sand & Gravel Company, expanding its presence in the Mid-Atlantic region. The acquisition strengthens Titan’s supply of aggregates, clay, and beneficiated fly ash for cement production. This strategic move supports Titan’s growth and innovation in sustainable construction materials.
- November 2024: NTPC showcased its eco-friendly "Sukh" Eco-house at the India International Trade Fair, built using 80% fly ash-based materials. These affordable houses, costing just Rs 1.5 lakh for a 30 sqm structure, offer sustainability by eliminating the need for cement, steel, and sand. The initiative aligns with the Pradhan Mantri Awas Yojana-Gramin and promotes carbon reduction and waste management.
- August 2024: A Green National Highway Corridor Project has been agreed between the Government of India and the World Bank covering 781 km of highways running through Himachal Pradesh, Rajasthan, Uttar Pradesh, and Andhra Pradesh. Eco-friendly methods including using fly ash along with different green technologies and bio-engineering methods have been undertaken, which aims at reducing carbon emission.
- May 2024: Heidelberg Materials acquired ACE Group, the largest supplier of pulverised fly ash in Malaysia, to strengthen its circular economy and carbon reduction goals in Southeast Asia. The acquisition supports the use of fly ash in composite cement, reducing CO2 intensity. This move is part of Heidelberg Materials' strategy to achieve net-zero cement and concrete globally.
- April 2024: Ambuja Cements acquired a 1.5 MTPA cement grinding unit in Tuticorin, Tamil Nadu, for Rs 413.75 crore. The plant, spread over 61 acres, benefits from a long-term fly ash supply agreement and strengthens Ambuja's coastal presence in southern markets.
- April 2023: Heidelberg Materials announced the acquisition of The SEFA Group, the largest fly ash recycler in the US, enhancing its commitment to CO₂ reduction and sustainability in concrete production. This strategic move will bolster their footprint in the Southeastern U.S. and promote circularity by reusing by-products from energy generation.
- January 2023: NorthStar Group, which is part of investment affiliates of J.F. Lehman & Company ("JFLCO"), has completed its acquisition of Trans Ash Inc. This move strengthens NorthStar's current capabilities in the coal ash remediation sector.
- February 2022: Eco Material Technologies combined Boral Resources and Green Cement, acquiring significant investments totaling $525 million in Green Bonds. Eco Material's patented technology produces near-zero carbon building materials that are 20% stronger than traditional cement after 28 days, while reducing CO₂ emissions by approximately 99%.
- November 2021: LafargeHolcim, through its subsidiary Geocycle, and CenterPoint Energy achieved a significant milestone in recycling coal ash, with the first barge shipment of nearly 2,000 tons from CenterPoint's A.B. Brown plant. This initiative aims to recycle over six million tons of coal ash for cement production, reducing reliance on natural materials.
Fly Ash Market Report Scope:
| Report Features | Details |
|---|---|
| Base Year of the Analysis | 2025 |
| Historical Period | 2020-2025 |
| Forecast Period | 2026-2034 |
| Units | Billion USD |
| Scope of the Report | Exploration of Historical Trends and Market Outlook, Industry Catalysts and Challenges, Segment-Wise Historical and Future Market Assessment:
|
| Types Covered | Class F, Class C |
| Applications Covered |
|
| Regions Covered | Asia Pacific, Europe, North America, Latin America, Middle East and Africa |
| Countries Covered | United States, Canada, Germany, France, United Kingdom, Italy, Spain, Russia, China, Japan, India, South Korea, Australia, Indonesia, Brazil, Mexico |
| Companies Covered | Aceton Industries LLP, Ashtech India Pvt. Ltd., Boral Limited, Cemex S.A.B. de C.V., Charah Solutions Inc., Holcim Group, National Minerals Corporation, Salt River Materials Group, Suyog Suppliers, The SEFA Group, Titan America LLC (Titan Cement International SA), Waste Management Inc., etc. |
| Customization Scope | 10% Free Customization |
| Post-Sale Analyst Support | 10-12 Weeks |
| Delivery Format | PDF and Excel through Email (We can also provide the editable version of the report in PPT/Word format on special request) |
Key Benefits for Stakeholders:
- IMARC’s report offers a comprehensive quantitative analysis of various market segments, historical and current market trends, market forecasts, and dynamics of the fly ash market from 2020-2034.
- The fly ash market research report provides the latest information on the market drivers, challenges, and opportunities in the global market.
- The study maps the leading, as well as the fastest-growing, regional markets. It further enables stakeholders to identify the key country-level markets within each region.
- Porter's five forces analysis assist stakeholders in assessing the impact of new entrants, competitive rivalry, supplier power, buyer power, and the threat of substitution. It helps stakeholders to analyze the level of competition within the fly ash industry and its attractiveness.
- Competitive landscape allows stakeholders to understand their competitive environment and provides an insight into the current positions of key players in the market.
Frequently Asked Questions About the Fly Ash Market Report
Fly ash is a fine powder byproduct from the combustion of pulverized coal in thermal power plants. It is widely used as a supplementary cementitious material (SCM) in concrete production due to its ability to enhance strength, durability, and workability.
The global fly ash market was valued at USD 14.9 Billion in 2025.
IMARC estimates the global fly ash market to exhibit a CAGR of 4.45% during 2026-2034.
Key factors include the rising demand for sustainable construction materials, growing infrastructure development, increased focus on reducing carbon emissions, and advancements in fly ash processing technologies. Its cost-effective substitution for cement and its application across construction, agriculture, and waste management also drive demand.
In 2025, Class F represented the largest segment by type, driven by its superior properties like high durability, low permeability, and resistance to alkali-silica reactions.
The construction segment leads the market by application, owing to its extensive use in concrete, bricks, road construction, and Portland cement production, driven by the need for sustainable and cost-effective building materials.
On a regional level, the market has been classified into North America, Asia Pacific, Europe, Latin America, and Middle East and Africa, wherein Asia Pacific currently dominates the global market.
Some of the major players in the global fly ash market include Aceton Industries LLP, Ashtech India Pvt. Ltd., Boral Limited, Cemex S.A.B. de C.V., Charah Solutions Inc., Holcim Group, National Minerals Corporation, Salt River Materials Group, Suyog Suppliers, The SEFA Group, Titan America LLC (Titan Cement International SA), Waste Management Inc., etc.
Need more help?
- Speak to our experienced analysts for insights on the current market scenarios.
- Include additional segments and countries to customize the report as per your requirement.
- Gain an unparalleled competitive advantage in your domain by understanding how to utilize the report and positively impacting your operations and revenue.
- For further assistance, please connect with our analysts.
 Request Customization
 Speak to an Analyst
 Request Brochure
 Inquire Before Buying
Benefits of Customization
- Personalize this research
- Triangulate with your data
- Get data as per your format and definition
- Gain a deeper dive into a specific application, geography, customer, or competitor
- Any level of personalization
Get in Touch With Us
UNITED STATES
Phone: +1-201-971-6302
INDIA
Phone: +91-120-433-0800
UNITED KINGDOM
Phone: +44-753-714-6104
Email: [email protected]
Client Testimonials


.webp)


