
Formic Acid Prices, Trend, Chart, Demand, Market Analysis, News, Historical and Forecast Data Report 2026 Edition
Formic Acid Prices, Index, Trend, Historcial and Forecast
Track real-time and historical formic acid prices across global regions. Updated monthly with market insights, drivers, and forecasts.
Formic Acid Prices – Latest Update (May 2026)
As of May 2026, global formic acid prices are averaging around USD 0.70 –0.88 per Kg. Formic acid prices showed a mixed market trend across major regions, influenced by feedstock costs, downstream demand, production rates, and supply availability. Demand from leather processing, textile dyeing, rubber manufacturing, animal feed preservatives, and chemical intermediate applications remained the primary consumption driver. Buyers largely maintained need based procurement strategies, which limited aggressive stockbuilding despite periodic supply fluctuations. Feedstock methanol and energy costs continued to influence production economics, while freight charges, domestic logistics, and port handling expenses affected delivered prices in import dependent markets.
Besides, producers maintained controlled operating rates to manage inventories, while export activity supported regional trade flow. Europe experienced relatively cautious buying activity, with downstream industries monitoring raw material costs and inventory levels closely. Logistics costs, plant operating rates, and feedstock fluctuations continued to shape market sentiment.
Latest Key Prices Snapshot ( Table )
| Metric | Latest Value |
|---|---|
| Global Benchmark Price | USD 0.79/Kg |
| Global Average Price Range in May 26 | USD 0.70 - 0.88 per Kg |
| Northeast Asia | USD 0.36/Kg |
| Europe | USD 0.94/Kg |
| India | USD 1.04/Kg |
| North America | USD 0.89/Kg |
| Monthly Change % | -2.5% to +1.5% |
| YoY Change % | 4.5% (Slightly higher) |
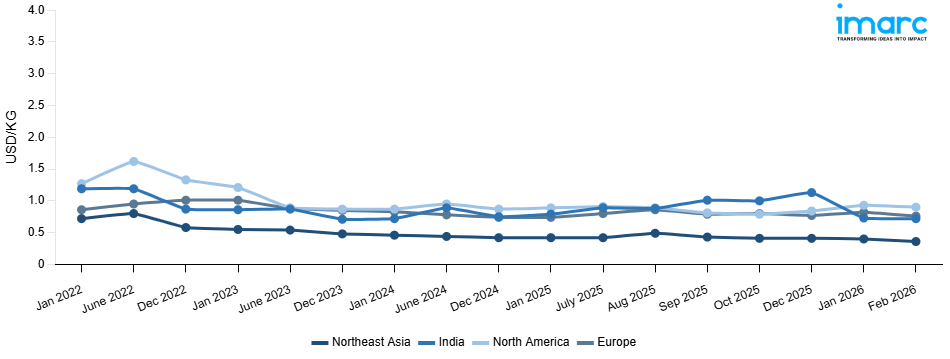
Formic Acid Price Index (USD/KG):
The chart below highlights monthly formic acid prices across different regions.
Get Access to Monthly/Quarterly/Yearly Prices, Request Sample
Q4 25 VS Q1 26
Between Q4 2025 and Q1 2026, the formic acid market showed a mostly downward trend across key regions. Northeast Asia declined by 14.6%, with prices falling from USD 0.41/Kg to USD 0.35/Kg, reflecting softer downstream demand and sufficient supply availability. Europe also recorded a 5.2% decrease, moving from USD 0.77/Kg to USD 0.73/Kg, as cautious procurement and stable inventories limited price support. India saw the sharpest correction, with prices dropping by 25.7% from USD 1.13/Kg to USD 0.84/Kg, mainly due to weaker buying activity, improved availability, and reduced urgency among downstream users.
North America was the only region showing an upward trend, with prices rising by 2.4% from USD 0.84/Kg to USD 0.86/Kg. The increase was supported by steady demand from leather, textile, rubber, animal feed preservative, and chemical intermediate applications. Feedstock methanol costs, logistics expenses, and controlled supply conditions also helped maintain price support. Overall, Q1 2026 reflected a softer global formic acid market, with most regions facing downward pressure, while North America remained comparatively stable and slightly firm.
Key Factors Influencing Formic Acid Prices:
Several factors influence formic acid price movements globally, including:
- Feedstock Costs: Formic acid prices are heavily influenced by methanol costs, its primary raw material. Variations in crude oil and natural gas prices affect methanol production economics, which directly impacts manufacturing expenses and ultimately determines pricing trends across global and regional markets.
- Energy and Operating Expenses: Electricity, fuel, and utility costs significantly affect production economics, particularly in energy-intensive regions. Rising power tariffs or fuel prices increase overall operating costs for producers, often leading to higher formic acid prices, while lower energy costs can ease pricing pressure.
- Supply–Demand Balance: Market prices respond to production levels, plant maintenance schedules, capacity expansions, and inventory availability. Oversupply conditions typically push prices downward, whereas tight supply due to shutdowns or strong buying interest can create upward momentum in regional and international markets.
- Downstream Industry Demand: Demand from leather tanning, textiles, rubber processing, and animal feed industries plays a crucial role in shaping pricing patterns. Seasonal agricultural requirements, particularly silage preservation demand, can further create temporary fluctuations in consumption and price stability.
Formic Acid Prices Overview by Region – May 2026
Northeast Asia: Northeast Asia recorded a 12.2% decline in May 2026, with formic acid prices settling at USD 0.36/Kg. The downward movement was mainly linked to weak downstream demand and cautious procurement from the chemical, textile, leather, and rubber sectors. Buyers maintained limited purchasing volumes as inventories remained sufficient across the market. Stable production levels also improved supply availability, reducing pressure on spot prices. Lower feedstock cost support further contributed to softer sentiment, while sellers adjusted offers to encourage fresh orders.
Europe: Europe recorded a 6.8% increase in May 2026, with formic acid prices reaching USD 0.94/Kg. The upward movement was supported by firmer demand from leather, textile, animal feed preservative, and chemical intermediate applications. Buyers maintained regular procurement to meet production requirements, which strengthened market sentiment. Higher feedstock methanol costs, energy expenses, freight charges, and domestic logistics also added pressure to final prices. Supply availability remained manageable, but sellers held firm offers due to cost-side support. Import-related expenses and currency movement also influenced delivered values.
India: India recorded an 8.3% increase in May 2026, with formic acid prices reaching USD 1.04/Kg. The rise was mainly supported by stronger buying activity from textile, leather, rubber, and preservative applications. Downstream users increased procurement to meet production needs, which improved market sentiment. Controlled supply availability and firmer seller offers added further support to prices. Logistics expenses, feedstock-related costs, and domestic transportation charges also influenced market values. Buyers continued need-based purchasing, but higher replacement costs encouraged regular order placement.
North America: North America recorded a 16.8% decline in May 2026, with formic acid prices settling at USD 0.89/Kg. The fall was driven by weaker downstream demand and cautious buying from industrial users. Procurement from the leather, textile, animal feed preservative, rubber, and chemical intermediate sectors remained limited as buyers relied on existing inventories. Stable supply availability and sufficient stock levels reduced urgency for fresh purchases. Feedstock and logistics costs remained relevant, but they were not strong enough to offset weak demand sentiment.
Formic Acid Price Forecast
Short-Term Trend (Next 3 Months)
Formic acid prices are expected to remain mixed, with region wise variation. Northeast Asia may stay under mild downward pressure if demand from the chemical, textile, leather, and rubber sectors remains weak and supply availability stays comfortable. Europe may remain firm due to steady downstream consumption, higher operating costs, and logistics-related pressure. India is likely to maintain a stable to firm trend, supported by regular demand from textile, leather, rubber, and preservative applications. North America may remain soft if buyers continue cautious procurement and rely on existing inventories. Feedstock methanol costs, energy prices, plant operating rates, freight charges, and domestic logistics will remain key pricing factors. Overall, the market is expected to show a mixed trend, with limited sharp movement unless demand improves strongly or supply tightens.
Mid-Term Trend (2026–2027)
The market is expected to witness gradual stabilization with potential moderate recovery, supported by steady growth in downstream industries. Demand from leather processing, textiles, rubber chemicals, and animal feed preservation is projected to expand in line with industrial and agricultural activity. Structural consumption growth, particularly in feed additives and silage treatment, may provide a stable demand base over the medium term. On the supply side, capacity additions and operational efficiency improvements could maintain adequate availability, preventing sharp price spikes. However, fluctuations in methanol feedstock prices, energy costs, and environmental compliance expenses may introduce periodic volatility. Trade dynamics, freight rates, and currency movements will also influence regional competitiveness. Overall, the market is likely to move toward a more balanced environment, with modest price improvements possible if demand growth outpaces supply expansion.
Formic Acid Price History (2022–2026) – Table / Para format
| Year | Market Movement | Key Event |
|---|---|---|
| 2021-2022 | Strong Uptrend | Post-pandemic industrial rebound and sharp rise in methanol and energy costs |
| 2023-2024 | Downward Correction | Easing feedstock prices, and improved plant operating rates |
| 2025 | Gradual Recovery | Stabilizing methanol costs and improved downstream demand from animal feed and agriculture |
| 2026 | Stabilization Phase | Adequate global supply, steady downstream consumption, and relatively stable feedstock |
This historical trend shows recurring cycles tied to macroeconomic and agricultural supply factors.
Formic Acid Market Outlook
The market is expected to remain stable with moderate growth. Feedstock costs, particularly methanol, are projected to remain relatively steady, preventing sharp price volatility. Downstream demand from leather, textiles, rubber processing, and agricultural silage uses is likely to stay consistent, supporting balanced pricing. Supply from major producers is anticipated to match demand, resulting in fewer supply shocks and smoother market movements.
Formic Acid Industry Analysis
The global formic acid industry size reached 971.6 Kilo Tons in 2025. By 2034, IMARC Group expects the market to reach 1,234.8 Kilo Tons, at a projected CAGR of 2.70% during 2026-2034. The market is driven by the rising demand for engineered wood and construction materials, expanding use in automotive and furniture applications, and increasing adoption of formaldehyde based resins and derivatives across agriculture, textiles, and consumer goods due to cost-effectiveness and versatility.
Latest Developments in the Formic Acid Industry
- June 2025: BASF introduced formic acid sales through its eAuction digital platform, giving customers in China a more transparent and efficient way to manage purchases. The platform was designed to simplify procurement, improve price visibility, and enhance convenience for industries that rely on formic acid, such as leather processing, agriculture, food preservation, and pharmaceuticals.
- July 2024: Scientists from Argonne National Laboratory and the University of Chicago unveiled new tin-based catalysts capable of converting CO2 into valuable chemicals like ethanol, acetic acid, and formic acid. The electrocatalytic process uses electricity to drive this conversion, with a focus on renewable energy sources like wind and solar.
- July 2024: Researchers at AIST and the University of Tsukuba developed an efficient method for directly synthesizing formic acid from CO2 and hydrogen using an iridium catalyst in hexafluoroisopropanol (HFIP). This breakthrough eliminates the need for formate intermediates, making the process simpler and more cost-effective.
Product Description
Formic acid, commonly known as methanoic acid, is a colorless liquid, with the chemical formulation HCOOH. The acid possesses a pungent smell similar to that of vinegar. It is a common carboxylic acid which occurs naturally in numerous organisms including ants. Formic acid is mainly procured by the catalytic oxidation of methanol. This procedure includes the reaction of methanol with carbon monoxide in the presence of a catalyst, such as palladium or rhodium. Besides this, this acid is also produced through the hydrolysis of methyl formate, which is collected from methanol and carbon monoxide. Some of the most common industries where formic acid is put to use include leather tanning, rubber and textile industries, oil and gas industry, and preservation of animal feed. In the leather tanning industry, formic acid acts as a coagulant in chrome tanning procedures in order to precipitate collagen fibers and convert raw hides into leather.
Key Supplier List
The key suppliers of formic acid are:
- BASF SE
- Chongqing Chuandong Chemical Group Co. Ltd.
- Eastman Chemical Company
- Gujarat Narmada Valley Fertilizers & Chemicals
- Luxi Group Co. Ltd.
- Perstorp Holding AB (PETRONAS Chemicals International B.V.)
Report Coverage
| Key Attributes | Details |
|---|---|
| Product Name | Formic Acid |
| Report Features | Exploration of Historical Trends and Market Outlook, Industry Demand, Industry Supply, Gap Analysis, Challenges, Formic Acid Price Analysis, and Segment-Wise Assessment. |
| Currency/Units | US$ (Data can also be provided in local currency) or Metric Tons |
| Region/Countries Covered | The current coverage includes analysis at the global and regional levels only. Based on your requirements, we can also customize the report and provide specific information for the following countries: Asia Pacific: China, India, Indonesia, Pakistan, Bangladesh, Japan, Philippines, Vietnam, Thailand, South Korea, Malaysia, Nepal, Taiwan, Sri Lanka, Hongkong, Singapore, Australia, and New Zealand Europe: Germany, France, United Kingdom, Italy, Spain, Russia, Turkey, Netherlands, Poland, Sweden, Belgium, Austria, Ireland, Switzerland, Norway, Denmark, Romania, Finland, Czech Republic, Portugal and Greece North America: United States and Canada Latin America: Brazil, Mexico, Argentina, Columbia, Chile, Ecuador, and Peru Middle East & Africa: Saudi Arabia, UAE, Israel, Iran, South Africa, Nigeria, Oman, Kuwait, Qatar, Iraq, Egypt, Algeria, and Morocco The list of countries presented is not exhaustive. Information on additional countries can be provided if required by the client. |
| Information Covered for Key Suppliers |
|
| Customization Scope | The report can be customized as per the requirements of the customer |
| Report Price and Purchase Option |
Plan A: Monthly Updates - Annual Subscription
Plan B: Quarterly Updates - Annual Subscription
Plan C: Biannually Updates - Annual Subscription
|
| Post-Sale Analyst Support | 360-degree analyst support after report delivery |
| Delivery Format | PDF and Excel through email (We can also provide the editable version of the report in PPT/Word format on special request) |
Key Benefits for Stakeholders:
- IMARC’s report presents a detailed analysis of formic acid pricing, covering global and regional trends, spot prices at key ports, and a breakdown of FOB and CIF prices.
- The study examines factors affecting formic acid price trend, including input costs, supply-demand shifts, and geopolitical impacts, offering insights for informed decision-making.
- The competitive landscape review equips stakeholders with crucial insights into the latest market news, regulatory changes, and technological advancements, ensuring a well-rounded, strategic overview for forecasting and planning.
- IMARC offers various subscription options, including monthly, quarterly, and biannual updates, allowing clients to stay informed with the latest market trends, ongoing developments, and comprehensive market insights. The formic acid price charts ensure our clients remain at the forefront of the industry.
Frequently Asked Questions About the Formic Acid Price Trend Report
Formic prices in May 2026 are averaging between USD 0.70 –0.88 per Kg, depending on region and grade. Prices generally vary due to fluctuations in raw material costs, energy price shifts, and seasonal demand from industries such as leather and agriculture. IMARC Group updates formic acid price data monthly across all major markets.
Formic acid prices are primarily influenced by: (1) feedstock costs, mostly methanol and carbon monoxide; (2) supply and demand dynamics, such as when major manufacturing plants in China undergo maintenance; (3) seasonal and regional factors, as leather production and agricultural cycles cause demand shifts and change in regional frieght rates, especially from Europe and China; (4) economical factors, including geopolitical fluctuations.
The formic acid price trend in 2026 is generally stable with mild regional variations, influenced by balanced supply demand fundamentals, steady feedstock costs, and moderate end-use activity.
The formic acid price index aggregates pricing data from major producing and consuming regions, reflecting changes in supply, demand, trade flows, and benchmark futures pricing.
The formic acid price forecast suggests annual growth of approx. 4-6% through 2030 supported by rising demand from preservative and feed-additive applications in livestock nutrition, increasing use in the chemical and textile industries, and constrained global supply.
Formic acid price history data can be accessed through detailed quarterly and annual pricing reports, including regional benchmarks and historical trend analysis.
Need more help?
- Speak to our experienced analysts for insights on the current market scenarios.
- Include additional segments and countries to customize the report as per your requirement.
- Gain an unparalleled competitive advantage in your domain by understanding how to utilize the report and positively impacting your operations and revenue.
- For further assistance, please connect with our analysts.
 Request Customization
 Inquire Before Buying
 Speak to an Analyst
 Request Brochure
Benefits of Customization
- Personalize this research
- Triangulate with your data
- Get data as per your format and definition
- Gain a deeper dive into a specific application, geography, customer, or competitor
- Any level of personalization
Get in Touch With Us
UNITED STATES
Phone: +1-201-971-6302
INDIA
Phone: +91-120-433-0800
UNITED KINGDOM
Phone: +44-753-714-6104
Email: [email protected]
Client Testimonials


.webp)


Related Reports
Why Choose Us
IMARC offers trustworthy, data-centric insights into commodity pricing and evolving market trends, enabling businesses to make well-informed decisions in areas such as procurement, strategic planning, and investments. With in-depth knowledge spanning more than 1000 commodities and a vast global presence in over 150 countries, we provide tailored, actionable intelligence designed to meet the specific needs of diverse industries and markets.
1000
+Commodities
150
+Countries Covered
3000
+Clients
20
+Industry
Robust Methodologies & Extensive Resources
IMARC delivers precise commodity pricing insights using proven methodologies and a wealth of data to support strategic decision-making.
Subscription-Based Databases
Our extensive databases provide detailed commodity pricing, import-export trade statistics, and shipment-level tracking for comprehensive market analysis.
Primary Research-Driven Insights
Through direct supplier surveys and expert interviews, we gather real-time market data to enhance pricing accuracy and trend forecasting.
Extensive Secondary Research
We analyze industry reports, trade publications, and market studies to offer tailored intelligence and actionable commodity market insights.
Trusted by 3000+ industry leaders worldwide to drive data-backed decisions. From global manufacturers to government agencies, our clients rely on us for accurate pricing, deep market intelligence, and forward-looking insights.