
Gadolinium Prices, Trend, Chart, Demand, Market Analysis, News, Historical and Forecast Data Report 2026 Edition
Gadolinium Price Trend, Index and Forecast
Track real-time and historical gadolinium prices across global regions. Updated monthly with market insights, drivers, and forecasts.
Gadolinium Prices June 2026
| Region | Price (USD/Kg) | Latest Movement |
|---|---|---|
| Northeast Asia | 25,447.52 | -21.0% ↓ Down |
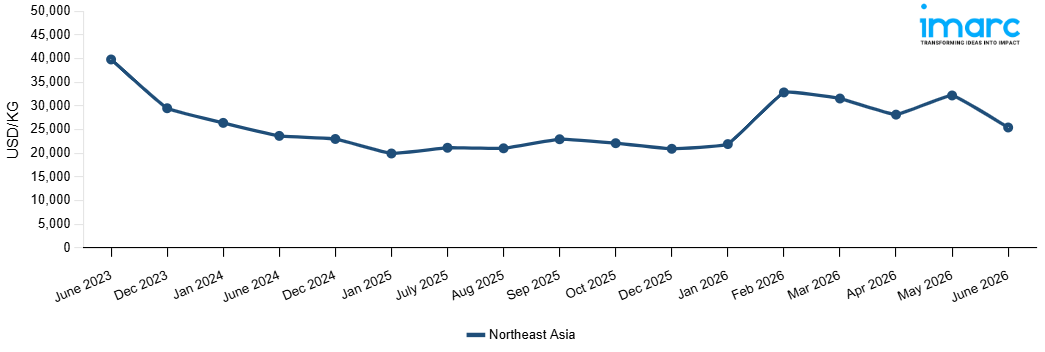
Gadolinium Price Index (USD/KG):
The chart below highlights monthly gadolinium prices across different regions.
Get Access to Monthly/Quarterly/Yearly Prices, Request Sample
Market Overview Q1 Ending March 2026
Northeast Asia: The gadolinium prices in Northeast Asia reached 31563.79 USD/KG in March 2026. The upward pricing movement registered between December and March 2026 was 50.7%. The significant price increase was primarily driven by unusually high supply tightness resulting from strict adherence to production quotas and increased environmental regulatory pressure on some of the top mining and separation facilities for rare earths, which had a critical impact on the supply of refined gadolinium. Increasing demand for medical imaging contrast agents, nuclear reactor control rods, and magneto strictive alloys drove up procurement pressure, especially during severely constrained spot supply levels. Increasing processing costs for rare earth ores and heavy rare earths also added upward pressure on regional refiners' costs. In addition, increased demand from the electronics phosphor and optical glasses segments maintained robust offtake fundamentals, whereas strategic stockpiling by some of the top medical device and nuclear technology manufacturers, expecting supply disruptions, added to procurement urgency.
Market Overview Q4 Ending December 2025
Northeast Asia: The gadolinium prices in Northeast Asia reached 20949.92 USD/KG in December 2025. The downward pricing movement registered between September and December 2025 was 8.8%. The primary reason for the price drop was weak downstream demand from the medical imaging and nuclear reactor control rod manufacturing sectors, leading to lower purchasing volumes amid cautious spending in healthcare and energy. Loosening supply constraints from leading Chinese rare earth manufacturers, who enhanced export options after reducing production limits and boosting separation capacity, intensified the negative pricing forecast. Additionally, reduced usage in the electronics and phosphor production sectors hindered overall market demand. Strategic destocking by significant buyers expecting continued price declines hindered purchasing competition, while high inventory levels among main distributors led to competitive pricing adjustments, maintaining ongoing downward pressure on current market valuations over the quarter.
Market Overview Q3 Ending September 2025
Northeast Asia: China, the dominant regional producer, maintained strict export controls and production quotas as part of its strategic resource management policies, creating persistent supply tightness across global markets. Demand-side factors remained exceptionally strong, with magnetic resonance imaging equipment manufacturers in Japan and South Korea increasing procurement activities to support expanding healthcare infrastructure projects. The semiconductor industry provided additional consumption support, particularly from advanced chip manufacturing facilities requiring high-purity gadolinium compounds for specialized applications. Currency dynamics favored regional pricing strength, with the Chinese yuan maintaining stability against the US dollar while supporting export pricing power for domestic producers. International shipping costs remained elevated due to specialized handling requirements for rare earth materials. Domestic logistics costs increased due to regulatory compliance requirements for rare earth transportation and storage, while environmental monitoring expenses added operational premiums for mining and processing facilities.
Gadolinium Price Trend, Market Analysis, and News
IMARC's latest publication, “Gadolinium Prices, Trend, Chart, Demand, Market Analysis, News, Historical and Forecast Data Report 2026 Edition,” presents a detailed examination of the gadolinium market, providing insights into both global and regional trends that are shaping prices. This report delves into the spot price of gadolinium at major ports and analyzes the composition of prices, including FOB and CIF terms. It also presents detailed gadolinium prices trend analysis by region, covering North America, Europe, Asia Pacific, Latin America, and Middle East and Africa. The factors affecting gadolinium pricing, such as the dynamics of supply and demand, geopolitical influences, and sector-specific developments, are thoroughly explored. This comprehensive report helps stakeholders stay informed with the latest market news, regulatory updates, and technological progress, facilitating informed strategic decision-making and forecasting.
.webp)
Gadolinium Industry Analysis
The global gadolinium industry size reached USD 278.9 Million in 2025. By 2034, IMARC Group expects the market to reach USD 399.9 Million, at a projected CAGR of 3.96% during 2026-2034. The market is driven by the rising demand for advanced MRI contrast agents, expanding use in nuclear reactor shielding, growth of rare earth based electronics, increasing adoption in cancer treatment therapies, and global investments in healthcare and clean energy technologies.
Latest developments in the Gadolinium Industry:
- June 2025: Nusano reported a major advancement in its isotope program by successfully producing gadolinium-160 (Gd-160) at 99.2% enrichment. This achievement highlighted the effectiveness of the company’s in-house stable isotope production capabilities and represents an important step toward strengthening domestic supply chains for critical isotopes.
- June 2025: ASP Isotopes Inc. announced the signing of a new supply agreement with Isotopia Molecular Imaging Ltd. covering the provision of enriched gadolinium-160 (Gd-160). This isotope serves as a critical feedstock for the production of terbium-161 (Tb-161), an emerging medical radioisotope with promising applications in targeted cancer therapies.
- November 2023: Bracco and Ulrich GmbH Co KG, a renowned German medical device manufacturer specializing in contrast media injectors and spinal implants, announced a new long-term partnership that will bring a Bracco state-of-the-art MR injector to the United States under an exclusive private label arrangement.
- September 2023: Bracco Imaging and Subtle Medical, Inc., entered into a global agreement in the field of magnetic resonance imaging. This global agreement will begin primarily in the United States wave Bracco Imaging distributes its portfolio of products and services through its subsidiary, Bracco Diagnostics Inc.
Product Description
Gadolinium refers to a silvery-white, malleable, and ductile rare-earth metal with the symbol Gd and atomic number 64. It is part of the lanthanide series and is known for its magnetic properties, which are particularly strong at low temperatures. It has a high neutron absorption cross-section, making it valuable in nuclear reactors as a neutron poison to control reactor activity. It is used as a contrast agent in magnetic resonance imaging (MRI) in medical applications due to its paramagnetic properties, enhancing the quality of MRI scans by improving the contrast of images. It is often used in the form of gadolinium-based contrast agents (GBCAs). It is also used in different electronic and industrial applications, such as phosphorus in color TV tubes, compact discs, and computer memory.
Report Coverage
| Key Attributes | Details |
|---|---|
| Product Name | Gadolinium |
| Report Features | Exploration of Historical Trends and Market Outlook, Industry Demand, Industry Supply, Gap Analysis, Challenges, Gadolinium Price Analysis, and Segment-Wise Assessment. |
| Currency/Units | US$ (Data can also be provided in local currency) or Metric Tons |
| Region/Countries Covered | The current coverage includes analysis at the global and regional levels only. Based on your requirements, we can also customize the report and provide specific information for the following countries: Asia Pacific: China, India, Indonesia, Pakistan, Bangladesh, Japan, Philippines, Vietnam, Thailand, South Korea, Malaysia, Nepal, Taiwan, Sri Lanka, Hongkong, Singapore, Australia, and New Zealand Europe: Germany, France, United Kingdom, Italy, Spain, Russia, Turkey, Netherlands, Poland, Sweden, Belgium, Austria, Ireland, Switzerland, Norway, Denmark, Romania, Finland, Czech Republic, Portugal and Greece North America: United States and Canada Latin America: Brazil, Mexico, Argentina, Columbia, Chile, Ecuador, and Peru Middle East & Africa: Saudi Arabia, UAE, Israel, Iran, South Africa, Nigeria, Oman, Kuwait, Qatar, Iraq, Egypt, Algeria, and Morocco The list of countries presented is not exhaustive. Information on additional countries can be provided if required by the client. |
| Information Covered for Key Suppliers |
|
| Customization Scope | The report can be customized as per the requirements of the customer |
| Report Price and Purchase Option |
Plan A: Monthly Updates - Annual Subscription
Plan B: Quarterly Updates - Annual Subscription
Plan C: Biannually Updates - Annual Subscription
|
| Post-Sale Analyst Support | 360-degree analyst support after report delivery |
| Delivery Format | PDF and Excel through email (We can also provide the editable version of the report in PPT/Word format on special request) |
Key Benefits for Stakeholders:
- IMARC’s report presents a detailed analysis of gadolinium pricing, covering global and regional trends, spot prices at key ports, and a breakdown of FOB and CIF prices.
- The study examines factors affecting gadolinium price trend, including input costs, supply-demand shifts, and geopolitical impacts, offering insights for informed decision-making.
- The competitive landscape review equips stakeholders with crucial insights into the latest market news, regulatory changes, and technological advancements, ensuring a well-rounded, strategic overview for forecasting and planning.
- IMARC offers various subscription options, including monthly, quarterly, and biannual updates, allowing clients to stay informed with the latest market trends, ongoing developments, and comprehensive market insights. The gadolinium price charts ensure our clients remain at the forefront of the industry.
Frequently Asked Questions About the Gadolinium Price Trend Report
The gadolinium prices in June 2026 were 25,447.52 USD/Kg in Northeast Asia.
The gadolinium pricing data is updated on a monthly basis.
We provide the pricing data primarily in the form of an Excel sheet and a PDF.
Yes, our report includes a forecast for gadolinium prices.
The regions covered include North America, Europe, Asia Pacific, Middle East, and Latin America. Countries can be customized based on the request (additional charges may be applicable).
Yes, we provide both FOB and CIF prices in our report.
Need more help?
- Speak to our experienced analysts for insights on the current market scenarios.
- Include additional segments and countries to customize the report as per your requirement.
- Gain an unparalleled competitive advantage in your domain by understanding how to utilize the report and positively impacting your operations and revenue.
- For further assistance, please connect with our analysts.
 Request Customization
 Inquire Before Buying
 Speak to an Analyst
 Request Brochure
Benefits of Customization
- Personalize this research
- Triangulate with your data
- Get data as per your format and definition
- Gain a deeper dive into a specific application, geography, customer, or competitor
- Any level of personalization
Get in Touch With Us
UNITED STATES
Phone: +1-201-971-6302
INDIA
Phone: +91-120-433-0800
UNITED KINGDOM
Phone: +44-753-714-6104
Email: [email protected]
Client Testimonials


.webp)


Why Choose Us
IMARC offers trustworthy, data-centric insights into commodity pricing and evolving market trends, enabling businesses to make well-informed decisions in areas such as procurement, strategic planning, and investments. With in-depth knowledge spanning more than 1000 commodities and a vast global presence in over 150 countries, we provide tailored, actionable intelligence designed to meet the specific needs of diverse industries and markets.
1000
+Commodities
150
+Countries Covered
3000
+Clients
20
+Industry
Robust Methodologies & Extensive Resources
IMARC delivers precise commodity pricing insights using proven methodologies and a wealth of data to support strategic decision-making.
Subscription-Based Databases
Our extensive databases provide detailed commodity pricing, import-export trade statistics, and shipment-level tracking for comprehensive market analysis.
Primary Research-Driven Insights
Through direct supplier surveys and expert interviews, we gather real-time market data to enhance pricing accuracy and trend forecasting.
Extensive Secondary Research
We analyze industry reports, trade publications, and market studies to offer tailored intelligence and actionable commodity market insights.
Trusted by 3000+ industry leaders worldwide to drive data-backed decisions. From global manufacturers to government agencies, our clients rely on us for accurate pricing, deep market intelligence, and forward-looking insights.