
GCC Digital Asset Management Market Report by Type (Brand Asset Management Systems, Library Asset Management Systems, Production Asset Management Systems), Component (Solution, Services), Application (Sales and Marketing, Broadcast and Publishing, and Others), Deployment (On-premises, Cloud), Organization Size (Small and Medium-sized Enterprises, Large Enterprises), End Use Sector (Media and Entertainment, Banking, Financial Services and Insurance (BFSI), Retail, Manufacturing, Healthcare and Life Sciences, Education, Travel and Tourism, and Others), and Country 2026-2034
Market Overview:
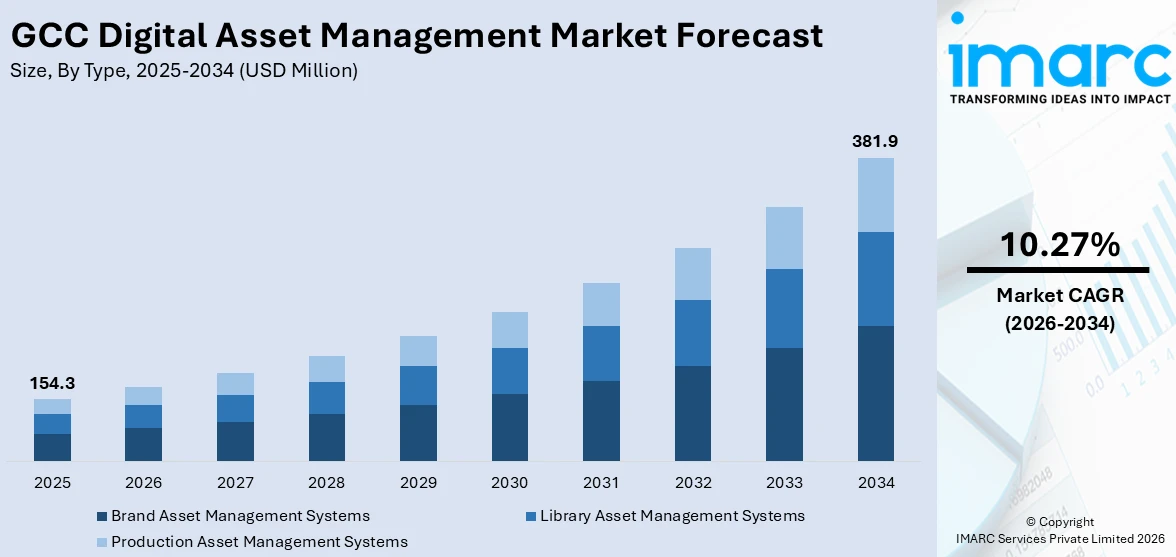
The GCC digital asset management market size reached USD 154.3 Million in 2025. Looking forward, IMARC Group expects the market to reach USD 381.9 Million by 2034, exhibiting a growth rate (CAGR) of 10.27% during 2026-2034.
|
Report Attribute
|
Key Statistics
|
|---|---|
|
Base Year
|
2025 |
|
Forecast Years
|
2026-2034
|
|
Historical Years
|
2020-2025
|
| Market Size in 2025 | USD 154.3 Million |
| Market Forecast in 2034 | USD 381.9 Million |
| Market Growth Rate (2026-2034) | 10.27% |
Digital asset management (DAM) refers to the automated solution that offers storage, sharing, and organizing of digital assets on a single interface. It assists in the quick storage, retrieval, and utilization of assets such as process data files, engineering blueprints, web pages, text documents, graphics, videos and audios. In the GCC countries, DAM solutions are widely used across various industries, such as retails, healthcare, education, information technology (IT), and banking, financial services, and insurance (BFSI), to automate workflows, manage permissions through copyright functionalities and streamline the cloud experience for users.
To get more information on this market Request Sample
The GCC digital asset management market is primarily driven by rising healthcare tourism, growing social media platforms and the expanding travel industry. The increasing adoption of cloud-based services across the transportation, construction, energy, defense, and power sectors has substantially increased the demand for DAM solutions. These solutions help organize data for maintaining the transparency of operations, improving digital content and reducing the overall operational costs. Moreover, the rapid integration of advanced technologies like artificial intelligence (AI) and machine learning with DAM solutions and the rising demand for cloud-based DAM solutions for the reduced risk of data leaks is also catalyzing the market growth.
Key Market Segmentation:
IMARC Group provides an analysis of the key trends in each sub-segment of the GCC digital asset management market report, along with forecasts at the regional and country level from 2026-2034. Our report has categorized the market based on type, component, application, deployment, organization size, and end use sector.
Breakup by Type:
- Brand Asset Management Systems
- Library Asset Management Systems
- Production Asset Management Systems
Breakup by Component:
- Solution
- Services
- Consulting
- System Integration
- Support and Maintenance
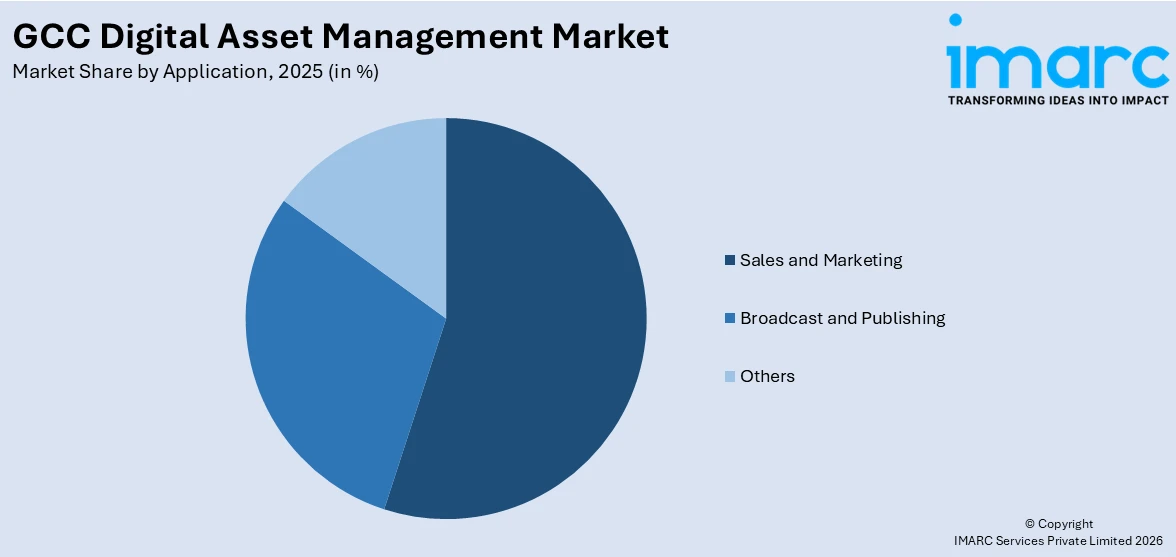
Breakup by Application:
Access the comprehensive market breakdown Request Sample
- Sales and Marketing
- Broadcast and Publishing
- Others
Breakup by Deployment:
- On-premises
- Cloud
Breakup by Organization Size:
- Small and Medium-sized Enterprises
- Large Enterprises
Breakup by End Use Sector:
- Media and Entertainment
- Banking, Financial Services and Insurance (BFSI)
- Retail
- Manufacturing
- Healthcare and Life Sciences
- Education
- Travel and Tourism
- Others
Breakup by Country:
- Saudi Arabia
- UAE
- Qatar
- Oman
- Kuwait
- Bahrain
Competitive Landscape:
The competitive landscape of the industry has also been examined along with the profiles of the key players.
Report Coverage:
| Report Features | Details |
|---|---|
| Base Year of the Analysis | 2025 |
| Historical Period | 2020-2025 |
| Forecast Period | 2026-2034 |
| Units | Million USD |
| Segment Coverage | Type, Component, Application, Deployment, Organization Size, End Use Sector, Country |
| Countries Covered | Saudi Arabia, UAE, Qatar, Oman, Kuwait, Bahrain |
| Customization Scope | 10% Free Customization |
| Post-Sale Analyst Support | 10-12 Weeks |
| Delivery Format | PDF and Excel through Email (We can also provide the editable version of the report in PPT/Word format on special request) |
Key Questions Answered in This Report:
- How has the GCC digital asset management market performed so far and how will it perform in the coming years?
- What has been the impact of COVID-19 on the GCC digital asset management market?
- What are the key regional markets?
- What is the breakup of the market based on the type?
- What is the breakup of the market based on the component?
- What is the breakup of the market based on the application?
- What is the breakup of the market based on the deployment?
- What is the breakup of the market based on the organization size?
- What is the breakup of the market based on the end use sector?
- What are the various stages in the value chain of the industry?
- What are the key driving factors and challenges in the industry?
- What is the structure of the GCC digital asset management market and who are the key players?
- What is the degree of competition in the industry?
Need more help?
- Speak to our experienced analysts for insights on the current market scenarios.
- Include additional segments and countries to customize the report as per your requirement.
- Gain an unparalleled competitive advantage in your domain by understanding how to utilize the report and positively impacting your operations and revenue.
- For further assistance, please connect with our analysts.
 Request Customization
 Speak to an Analyst
 Request Brochure
 Inquire Before Buying
Benefits of Customization
- Personalize this research
- Triangulate with your data
- Get data as per your format and definition
- Gain a deeper dive into a specific application, geography, customer, or competitor
- Any level of personalization
Get in Touch With Us
UNITED STATES
Phone: +1-201-971-6302
INDIA
Phone: +91-120-433-0800
UNITED KINGDOM
Phone: +44-753-714-6104
Email: [email protected]
Client Testimonials


.webp)


