
GCC Oil and Gas Separation Market Report by Technology Type (Gravitational Separation, Centrifugal Separation, and Others), Vessel Type (Two-Phase Separators, Three-Phase Separators, Scrubbers, and Others), Application (Onshore, Offshore, Refinery, and Others), and Country 2026-2034
Market Overview:
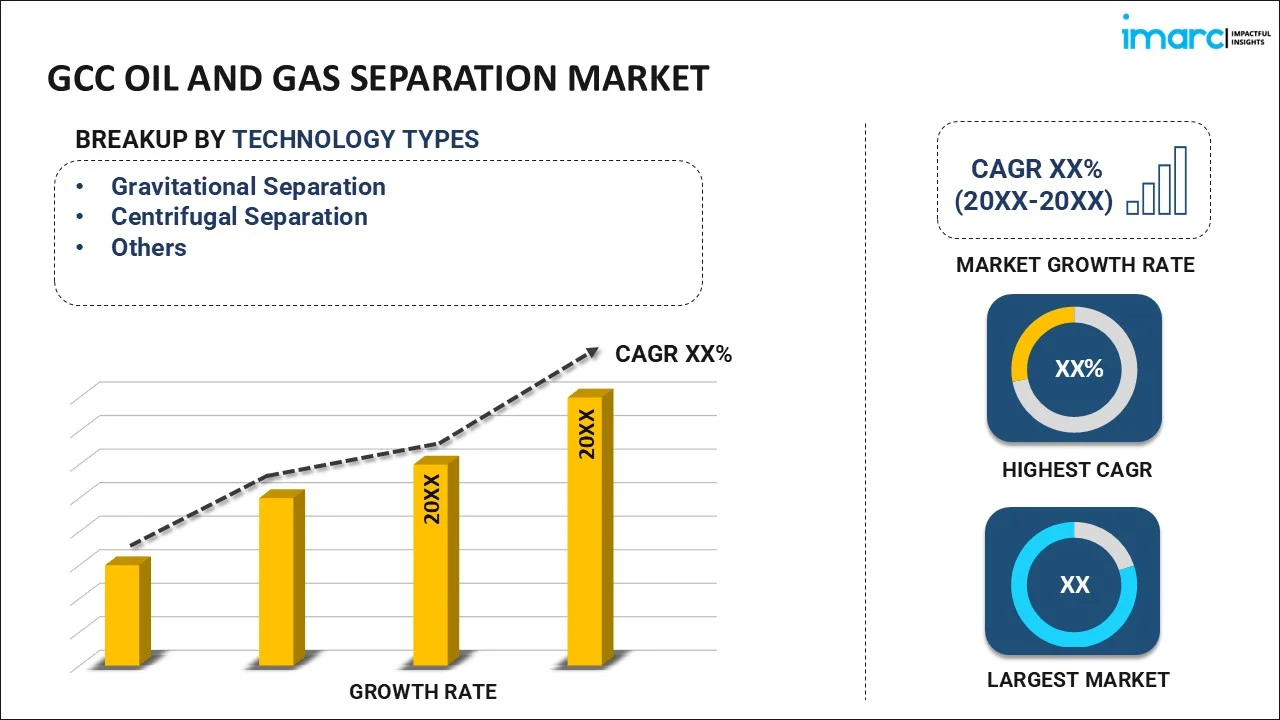
The GCC oil and gas separation market size reached USD 475.9 Million in 2025. Looking forward, IMARC Group expects the market to reach USD 723.9 Million by 2034, exhibiting a growth rate (CAGR) of 4.63% during 2026-2034.
|
Report Attribute
|
Key Statistics
|
|---|---|
|
Base Year
|
2025
|
|
Forecast Years
|
2026-2034
|
|
Historical Years
|
2020-2025
|
| Market Size in 2025 | USD 475.9 Million |
| Market Forecast in 2034 | USD 723.9 Million |
| Market Growth Rate (2026-2034) | 4.63% |
Access the full market insights report Request Sample
Oil and gas separation refers to the process of segregating oil, gas, and water from the total fluid stream produced by a well. This mixture is first passed through a separator that extracts the gas and directs it into a separation line. The separator is extensively used in the oil and gas industry for well-streams with high gas-oil ratios, constant flow and small liquid surge characteristics. They can also handle large slugs of liquid and are most often utilized for a low to intermediate gas-oil ratio of well streams.
The GCC oil and gas separation market is primarily driven by the growing need for optimum pipeline fluid quality specifications to increase pipeline transportation efficiency. Besides this, the expanding onshore and offshore applications of separators in the region is also contributing to the market growth. Additionally, with the growing environmental consciousness, governments of GCC countries are implementing stringent regulations to explore sustainable oil extraction options, which is creating a positive outlook for the market. Furthermore, a significant rise in the extraction activities from unconventional oil and gas resources during on-site processing is catalyzing the market growth.
Key Market Segmentation:
IMARC Group provides an analysis of the key trends in each segment of the GCC oil and gas separation market report, along with forecasts at the regional and country levels from 2026-2034. Our report has categorized the market based on technology type, vessel type, product type and application.
Breakup by Technology Type:
To get detailed segment analysis of this market Request Sample
- Gravitational Separation
- Centrifugal Separation
- Others
Breakup by Vessel Type:
- Horizontal
- Vertical
- Spherical
Breakup by Product Type:
- Two-Phase Separators
- Three-Phase Separators
- Scrubbers
- Others
Breakup by Application:
- Onshore
- Offshore
- Refinery
- Others
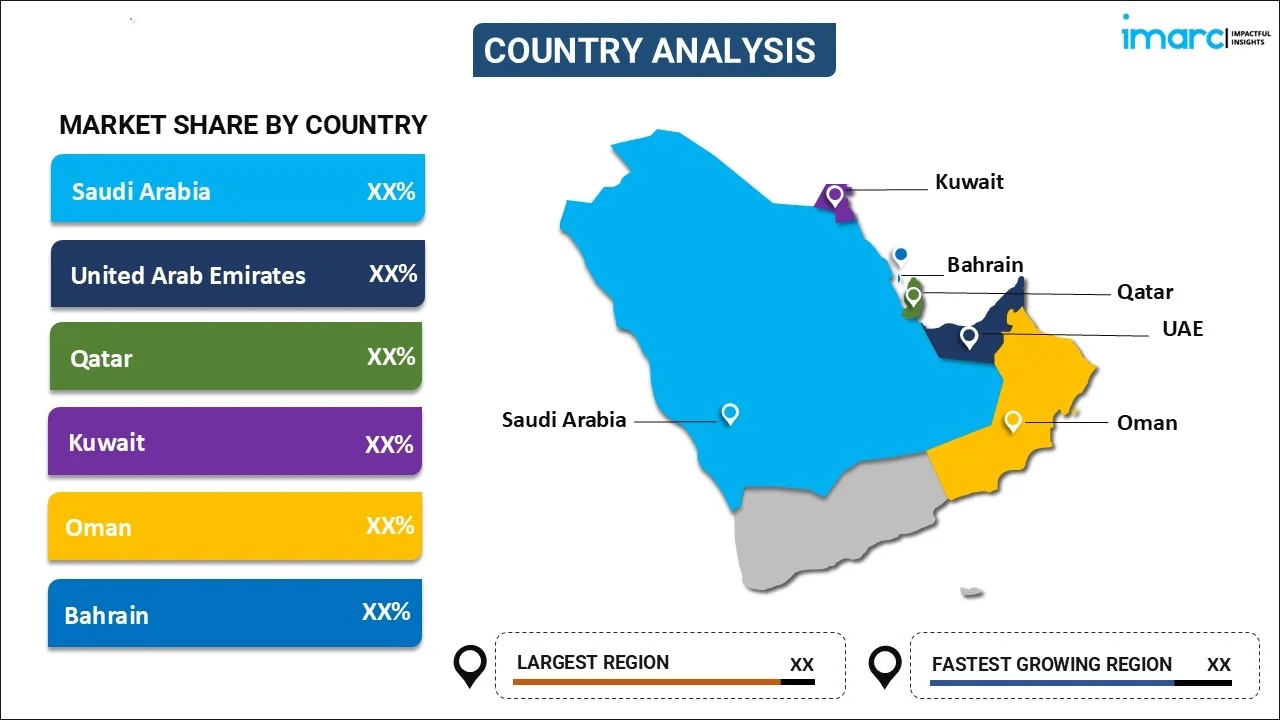
Breakup by Country:
To get detailed regional analysis of this market Request Sample
- Saudi Arabia
- UAE
- Qatar
- Oman
- Kuwait
- Bahrain
Competitive Landscape:
The competitive landscape of the industry has also been examined along with the profiles of the key players.
Report Coverage:
| Report Features | Details |
|---|---|
| Base Year of the Analysis | 2025 |
| Historical Period | 2020-2025 |
| Forecast Period | 2026-2034 |
| Units | Million USD |
| Scope of the Report | Exploration of Historical and Forecast Trends, Industry Catalysts and Challenges, Segment-Wise Historical and Predictive Market Assessment:
|
| Technology Types Covered | Gravitational Separation, Centrifugal Separation, Others |
| Vessel Types Covered | Horizontal, Vertical, Spherical |
| Product Types Covered | Two-Phase Separators, Three-Phase Separators, Scrubbers, Others |
| Applications Covered | Onshore, Offshore, Refinery, Others |
| Countries Covered | Saudi Arabia, UAE, Qatar, Oman, Kuwait, Bahrain |
| Customization Scope | 10% Free Customization |
| Post-Sale Analyst Support | 10-12 Weeks |
| Delivery Format | PDF and Excel through Email (We can also provide the editable version of the report in PPT/Word format on special request) |
Key Questions Answered in This Report:
- How has the GCC oil and gas separation market performed so far and how will it perform in the coming years?
- What has been the impact of COVID-19 on the GCC oil and gas separation market?
- What are the key regional markets?
- What is the breakup of the market based on the technology type?
- What is the breakup of the market based on the vessel type?
- What is the breakup of the market based on the product type?
- What is the breakup of the market based on the application?
- What are the various stages in the value chain of the industry?
- What are the key driving factors and challenges in the industry?
- What is the structure of the GCC oil and gas separation market and who are the key players?
- What is the degree of competition in the industry?
Need more help?
- Speak to our experienced analysts for insights on the current market scenarios.
- Include additional segments and countries to customize the report as per your requirement.
- Gain an unparalleled competitive advantage in your domain by understanding how to utilize the report and positively impacting your operations and revenue.
- For further assistance, please connect with our analysts.
 Request Customization
 Speak to an Analyst
 Request Brochure
 Inquire Before Buying
Benefits of Customization
- Personalize this research
- Triangulate with your data
- Get data as per your format and definition
- Gain a deeper dive into a specific application, geography, customer, or competitor
- Any level of personalization
Get in Touch With Us
UNITED STATES
Phone: +1-201-971-6302
INDIA
Phone: +91-120-433-0800
UNITED KINGDOM
Phone: +44-753-714-6104
Email: [email protected]
Client Testimonials


.webp)


