
Glass Fiber Prices, Trend, Chart, Demand, Market Analysis, News, Historical and Forecast Data Report 2026 Edition
Glass Fiber Price Trend, Index and Forecast
Track the latest insights on glass fiber price trend and forecast with detailed analysis of regional fluctuations and market dynamics across North America, Latin America, Central Europe, Western Europe, Eastern Europe, Middle East, North Africa, West Africa, Central and Southern Africa, Central Asia, Southeast Asia, South Asia, East Asia, and Oceania.
Glass Fiber Prices Outlook Q1 2026
- USA: USD 1,482/MT
- China: USD 1,413/MT
- Argentina: USD 1,874/MT
- Turkey: USD 1,120/MT
- Australia: USD 1,527/MT
Glass Fiber Price Chart

Get real-time access to monthly/quarterly/yearly prices Request Sample
During the first quarter of 2026, the glass fiber prices in the USA reached 1,482 USD/MT in March. The market experienced a moderate upward trend supported by steady demand from the construction and automotive sectors. Production levels remained stable, while supply conditions were slightly tightened due to controlled manufacturing output. Demand from infrastructure projects and composite material applications remained consistent, supporting price increases.
During the first quarter of 2026, the glass fiber prices in China reached 1,413 USD/MT in March. The market observed gradual price growth driven by steady demand from the construction and electronics industries. Domestic production remained controlled, ensuring balanced supply conditions. Consumption from downstream industries remained consistent, supporting price stability and incremental increases. Export activity contributed to tightening availability in the domestic market.
During the first quarter of 2026, the glass fiber prices in Argentina reached 1,874 USD/MT in March. The market experienced noticeable price increases supported by steady demand from construction and industrial sectors. Supply conditions remained controlled due to limited domestic production and reliance on imports. Consistent consumption from infrastructure projects supported market activity.
During the first quarter of 2026, the glass fiber prices in Turkey reached 1,120 USD/MT in March. The market recorded a strong upward trend driven by rising demand from the construction and manufacturing sectors. Supply conditions remained tight due to controlled production and steady export activity. Domestic consumption remained firm, supporting continuous price increases.
During the first quarter of 2026, the glass fiber prices in Australia reached 1,527 USD/MT in March. The market experienced a steady increase supported by consistent demand from construction and industrial applications. Supply conditions remained balanced due to stable import flows and controlled domestic production. Consumption remained firm, ensuring continuous market activity.
Glass Fiber Prices Outlook Q4 2025
- USA: USD 1,458/MT
- China: USD 1,382/MT
- Argentina: USD 1,815/MT
- Turkey: USD 1,071/MT
- Australia: USD 1,475/MT
During the fourth quarter of 2025, the glass fiber prices in the USA reached 1,458 USD/MT in December. Prices trended lower as domestic demand from construction and automotive composites softened amid cautious procurement strategies. Manufacturers operated with adequate inventories, reducing spot market dependence. Lower freight congestion and stable energy availability further eased cost pressures for producers. Additionally, steady import availability from Asia limited pricing leverage for domestic suppliers.
During the fourth quarter of 2025, the glass fiber prices in China reached 1,382 USD/MT in December. Due to muted downstream demand from electronics manufacturing and wind energy, the market saw falling prices. High operating rates were maintained by producers, which led to a plentiful domestic supply. Due to a minor decline in export competitiveness, local availability increased, and foreign offtake decreased.
During the fourth quarter of 2025, the glass fiber prices in Argentina reached 1,815 USD/MT in December. Prices moved upward as localized supply constraints coincided with firm demand from infrastructure and transportation sectors. Import reliance exposed the market to logistical delays, tightening material availability. Currency volatility encouraged suppliers to adjust prices defensively, while buyers accelerated procurement to hedge against future cost escalation.
During the fourth quarter of 2025, the glass fiber prices in Turkey reached 1,071 USD/MT in December. The market saw a gradual price improvement supported by recovering construction activity and steady exports to neighboring regions. Producers benefited from controlled production rates, preventing oversupply. Improved domestic demand and favorable trade flows supported supplier pricing power.
During the fourth quarter of 2025, the glass fiber prices in Australia reached 1,475 USD/MT in December. Prices declined due to moderate demand from marine and construction composites. Import availability remained sufficient, and distributors held comfortable inventories. Reduced procurement urgency and competitive supplier offerings weighed on prices. Stable transportation conditions and predictable lead times further reduced cost volatility.
Glass Fiber Prices Outlook Q3 2025
- USA: USD 1,481/MT
- China: USD 1,435/MT
- Argentina: USD 1,757/MT
- Turkey: USD 1,048/MT
- Australia: USD 1,513/MT
During the third quarter of 2025, the glass fiber prices in the USA reached 1,481 USD/MT in September. Due to a limited supply of raw materials and consistent demand from the automotive and construction industries, prices increased moderately. Manufacturers noted operating limitations brought on by energy prices and maintenance schedules, which limited production capacity and encouraged price increases. Glass fiber prices were further driven upward by changes in transportation costs and supply chain interruptions, while downstream sectors continued to carefully modify inventory levels in reaction to uncertainty in the global economy.
During the third quarter of 2025, the glass fiber prices in China reached 1,435 USD/MT in September. Due to decreased domestic demand from the automobile and wind energy industries, prices slightly decreased. Downward pressure was imposed by increased production capacities and a favorable raw material supply situation. In order to preserve their market share abroad, local producers were also prompted by competitive export markets to modify their prices.
During the third quarter of 2025, the glass fiber prices in Argentina reached 1,757 USD/MT in September. Prices dropped as a result of weaker industrial demand and less activity in infrastructure and building projects. Due to pressure from import competition, domestic suppliers reduced their prices. Along with conservative purchasing practices by manufacturers looking to maximize inventory levels in the face of uncertain economic conditions, logistical and transportation bottlenecks also had an impact on the pricing modifications.
During the third quarter of 2025, the glass fiber prices in Turkey reached 1,048 USD/MT in September. A moderate decline in prices was observed as production capacity exceeded immediate domestic demand. Reduced construction activity and a slowdown in exports contributed to softer market conditions. Suppliers adjusted pricing strategies to maintain competitiveness, while fluctuations in energy and raw material costs had a limited but noticeable impact.
During the third quarter of 2025, the glass fiber prices in Australia reached 1,513 USD/MT in September. Prices increased moderately due to sustained demand from the renewable energy sector and expanding infrastructure projects. Supply-side limitations, including energy cost volatility and raw material availability, reinforced upward price trends. Additionally, logistical challenges in international shipping and regional import dependencies contributed to tighter market conditions.
Glass Fiber Prices Outlook Q2 2025
- USA: USD 1,463/MT
- China: USD 1,472/MT
- Argentina: USD 1,789/MT
- Turkey: USD 1,065/MT
- Australia: USD 1,482/MT
During the second quarter of 2025, glass fiber prices in the USA reached 1,463 USD/MT in June. In May 2025, the market was significantly impacted by the changes in export and import activities. The positive trade balance of glass fibers, driven by a slight hike in exports and a decrease in imports between April and May, reflected a shift in the dynamics of the market. On the import side, the decrease in imports contributed to a more favorable trade balance, which influenced local production incentives in the glass fiber industry. This shift also suggested that domestic manufacturers were increasingly meeting the demand within the USA, reducing reliance on foreign suppliers.
During the second quarter of 2025, glass fiber prices in China reached 1,472 USD/MT in June. China experienced a positive trade balance in the glass fiber market, with exports surpassing imports. This shift had a significant impact on the market. Although the overall export value dropped slightly compared to April 2025, a noticeable decrease in imports occurred during the same period. This was attributed to a lower demand for glass fibers from China, especially from key markets like the United States, Mexico, and Brazil, where exports dropped significantly.
During the second quarter of 2025, glass fiber prices in Argentina reached 1,789 USD/MT in June. Argentina's glass fiber market experienced stable pricing, with minimal fluctuations resulting from currency exchange impacts and raw material costs. Construction and manufacturing demand remained consistent, while suppliers effectively balanced their inventory levels. Market conditions remained steady, with no sharp price swings.
During the second quarter of 2025, glass fiber prices in Turkey reached 1,065 USD/MT in June. Glass fiber prices in Turkey exhibited marginal fluctuations, driven by shifts in energy and raw material costs. Demand from sectors such as construction and infrastructure projects provided consistent support, while import adjustments created temporary fluctuations in the market. Overall, the pricing environment remained steady, reflecting a balance between supply and demand.
During the second quarter of 2025, glass fiber prices in Australia reached 1,482 USD/MT in June. The growing emphasis on sustainability played a central role, as industries across the country increasingly sought materials that aligned with environmental goals. Companies began to prioritize eco-friendly alternatives, and the use of recycled glass fibers became more widespread, reflecting a broader trend toward circular economy practices. In particular, the demand for high-performance glass fiber in sectors such as construction, automotive, and renewable energy surged, driven by the need for lightweight, durable, and cost-effective materials. The Australian government also introduced policies that encouraged the adoption of sustainable materials in infrastructure projects, further accelerating the shift towards glass fiber in various applications.
Glass Fiber Prices Outlook Q1 2025
- USA: USD 1480/MT
- China: USD 1440/MT
- Argentina: USD 1750/MT
- Turkey: USD 1060/MT
- Australia: USD 1450/MT
During the first quarter of 2025, the glass fiber prices in the USA reached 1480 USD/MT in March. As per the glass fiber price chart, strong demand in January was fueled by restocking initiatives in anticipation of trade restrictions, especially in the construction and automobile sectors. Prices fell in February and March as a result of growing uncertainty surrounding anti-dumping investigations against Chinese fiberglass products.
During the first quarter of 2025, glass fiber prices in China reached 1440 USD/MT in March. The market was under strain from varying demand and ongoing trade conflicts. Ahead of expected tariff adjustments, producers increased supply, thus January got off to a solid start. However, as uncertainty over export limitations and regulatory changes grew, prices stabilized by February and March.
During the first quarter of 2025, the glass fiber prices in Argentina reached 1750 USD/MT in March. The automotive industry's shift toward lighter, more fuel-efficient vehicles and the growing renewable energy sector, particularly wind power, were major factors influencing demand and pricing for glass fiber.
During the first quarter of 2025, the glass fiber prices in Turkey reached 1060 USD/MT in March. Glass fiber prices in Turkey during Q1 2025 were influenced by a combination of factors, including fluctuating raw material costs, supply chain disruptions, and demand from various sectors like construction and automotive.
During the first quarter of 2025, the glass fiber prices in Australia reached 1450 USD/MT in March. Australia's glass fiber sector saw a period of relative stability at the beginning of 2025 despite ongoing worries about global supply chains and commerce. Restocking and strong demand from the automotive and construction industries initially helped the market. However, by February and March, problems with global supply and growing expenses had an impact on price patterns.
Regional Coverage
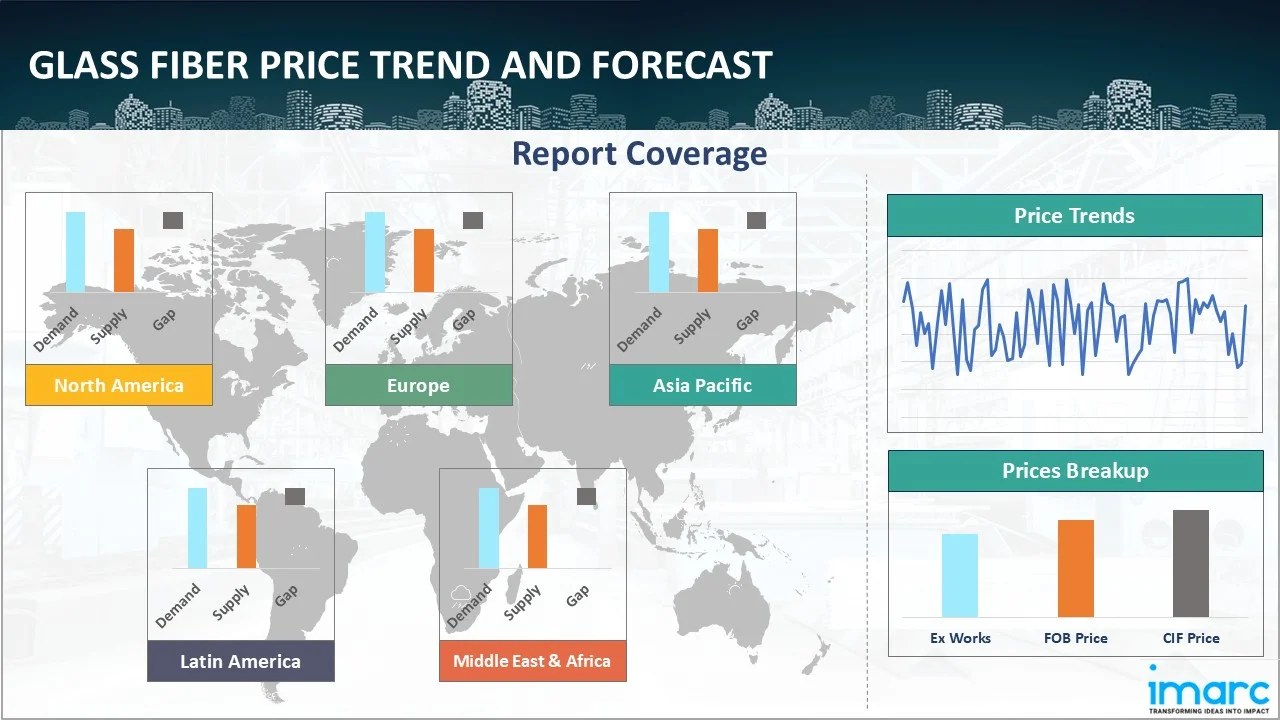
The report provides a detailed analysis of the market across different regions, each with unique pricing dynamics influenced by localized market conditions, supply chain intricacies, and geopolitical factors. This includes price trends, price forecast and supply and demand trends for each region, along with spot prices by major ports. The report also provides coverage of FOB and CIF prices, as well as the key factors influencing glass fiber prices.
Europe Glass Fiber Price Trend
Q1 2026:
The glass fiber price index in Europe showed moderate growth, supported by steady demand from the construction and automotive industries. Production levels remained controlled, ensuring balanced supply conditions across the region. Consumption from the infrastructure and manufacturing sectors remained consistent, supporting price increases. Buyers maintained cautious procurement strategies, ensuring stable inventory levels. Additionally, firm energy and transportation costs contributed to upward pricing pressure. Trade flows within the region remained stable, supporting overall market balance and gradual price growth.
Q4 2025:
The glass fiber price index in Europe showed varied movement, reflecting a balance between improving supply conditions and uneven downstream demand. Automotive production schedules remained inconsistent, while construction activity varied significantly across countries, limiting uniform demand growth. Inventory levels gradually improved as production planning became more disciplined and supply chain disruptions eased. Manufacturers carefully adjusted operating rates to avoid surplus accumulation, which helped prevent sharp price volatility.
Q3 2025:
During the third quarter of 2025, the glass fiber price index in Europe demonstrated moderate fluctuations. Prices were influenced by regional demand from the automotive, wind energy, and construction industries. Energy cost volatility and raw material supply constraints contributed to tightening supply conditions. Export competitiveness played a key role, as European manufacturers balanced domestic and international market demand. Logistical disruptions, including port congestion and transportation delays, exerted additional pressure on prices.
Q2 2025:
In Europe, glass fiber prices in Q2 2025 followed a stable trend, with minor variations influenced by fluctuations in input costs and shifts in energy prices. Demand from construction, transportation, and renewable energy sectors supported market stability, while supply chains recovered from prior logistical bottlenecks. Producers adjusted output to align with regional consumption patterns, keeping inventories balanced. The quarter concluded with moderate pricing stability, reflecting consistent industrial demand and an improved trade flow environment across European countries.
Q1 2025:
As per the glass fiber price index, the market, particularly in Germany, showed signs of stabilization due to shifting trade patterns, robust demand, and regulatory restrictions. Rising manufacturing costs and brief supply disruptions brought on by severe weather and port delays further supported this trend. Prices held steady in February as purchasers adopted conservative procurement tactics in the face of ongoing trade uncertainty. Vehicle registrations decreased while company confidence increased, leading to larger order placements.
This analysis can be extended to include detailed glass fiber price information for a comprehensive list of countries.
| Region | Countries Covered |
|---|---|
| Europe | Germany, France, United Kingdom, Italy, Spain, Russia, Turkey, Netherlands, Poland, Sweden, Belgium, Austria, Ireland, Switzerland, Norway, Denmark, Romania, Finland, Czech Republic, Portugal, and Greece, among other European countries. |
North America Glass Fiber Price Trend
Q1 2026:
The glass fiber price index in North America reflected steady growth driven by consistent demand from the construction and composite material sectors. Supply conditions remained balanced due to stable domestic production and controlled imports. Consumption from infrastructure projects supported continuous market activity. Buyers maintained disciplined procurement strategies, avoiding excess inventory buildup. Additionally, firm operational and logistics costs contributed to price increases, resulting in a stable upward trend across the region.
Q4 2025:
The glass fiber price index in North America softened due to a combination of demand moderation and operational stability. Consumption from key end-use sectors such as construction and transportation slowed as buyers adopted conservative purchasing strategies. Production remained steady, ensuring sufficient market availability without creating excess supply pressure. Logistics performance improved across domestic and cross-border routes, reducing delivery risks and associated cost premiums.
Q3 2025:
During the third quarter of 2025, the glass fiber price index in North America reflected gradual price growth. Strong demand from renewable energy projects, automotive manufacturing, and infrastructure development supported upward trends. Production limitations due to scheduled maintenance and energy cost fluctuations tightened supply, while global shipping and logistics constraints influenced regional pricing. Downstream industries managed inventory strategically to balance costs and ensure uninterrupted supply, contributing to market stability.
Q2 2025:
In North America, glass fiber prices remained relatively stable in the second quarter of 2025, supported by consistent demand from the automotive, construction, and aerospace sectors. While raw material costs and energy prices underwent periodic adjustments, most manufacturers maintained steady output levels, ensuring a balanced supply in key markets such as the US and Canada. Logistics remained stable compared to previous quarters, reducing the risk of sharp price swings.
Q1 2025:
Early in 2025, the North American glass fiber industry experienced some volatility due to shifting supply chains, trade laws, and changing consumer behavior. Restocking initiatives and elevated demand from key industries like construction and the automotive sector, fueled by worries about possible trade barriers and seasonal increases in economic activity, caused the market to see a significant spike in January. But by February and March, the market had turned around, and prices dropped.
Specific glass fiber prices and historical data within the United States and Canada can also be provided.
| Region | Countries Covered |
|---|---|
| North America | United States and Canada |
Middle East and Africa Glass Fiber Price Trend
Q1 2026:
In the Middle East and Africa, glass fiber prices experienced gradual increases supported by steady demand from construction and industrial sectors. Supply conditions remained controlled due to reliance on imports and stable trade flows. Consumption remained consistent, supporting price stability and growth. Logistics and transportation costs influenced pricing trends, contributing to a gradual upward movement across the region.
Q4 2025:
Glass fiber prices in the Middle East and Africa remained bullish supported by consistent demand from infrastructure and industrial development projects. Limited domestic manufacturing capacity increased reliance on imports, making supply chains more sensitive to shipping schedules and transit reliability. Buyers prioritized supply security, which helped sustain price levels despite stable consumption growth.
Q3 2025:
During the third quarter of 2025, glass fiber prices in the Middle East and Africa experienced moderate decline. Regional demand from construction, infrastructure, and automotive sectors influenced pricing trends. Supply chain constraints, particularly raw material shortages and logistical bottlenecks, applied upward pressure. Additionally, fluctuations in energy prices affected production costs, prompting suppliers to adjust pricing strategies. Market participants remained cautious, balancing procurement and inventory strategies to mitigate volatility.
Q2 2025:
In the Middle East and Africa, glass fiber prices in Q2 2025 remained broadly stable, with minor fluctuations influenced by raw material and energy costs. Demand from infrastructure development and construction projects, especially in the Gulf countries, supported consistent market activity. Import-dependent markets in Africa experienced some adjustments to their supply chains, but no major disruptions occurred.
Q1 2025:
As per the glass fiber price chart, shipping delays, increased freight rates, and port congestion, which persisted from late 2024, continued to affect the supply and pricing of glass fiber in Q1 2025. Besides, significant investments in construction and infrastructure projects, particularly in the UAE and Saudi Arabia, drove up demand for glass fiber.
In addition to region-wise data, information on glass fiber prices for countries can also be provided.
| Region | Countries Covered |
|---|---|
| Middle East & Africa | Saudi Arabia, UAE, Israel, Iran, South Africa, Nigeria, Oman, Kuwait, Qatar, Iraq, Egypt, Algeria, and Morocco, among other Middle Eastern and African countries. |
Asia Pacific Glass Fiber Price Trend
Q1 2026:
In the Asia Pacific region, glass fiber prices showed moderate growth driven by steady demand from construction, electronics, and automotive sectors. Industrial activity across major economies remained stable, supporting consistent consumption of glass fiber in composite manufacturing and infrastructure applications. Production levels were carefully managed by manufacturers, ensuring that supply remained aligned with demand conditions without creating excess availability. Export activity from key producing countries contributed to balanced regional supply, while also tightening domestic availability to some extent.
Q4 2025:
The Asia Pacific glass fiber market experienced downward pricing pressure as supply levels remained ample across major producing countries. Manufacturers continued operating at high utilization rates, leading to comfortable inventories. Export demand softened as global buyers reduced procurement volumes, intensifying competition among regional suppliers. To maintain sales volumes, producers adopted aggressive pricing strategies, further weighing on market sentiment. Additionally, predictable logistics and stable raw material availability reduced cost volatility, reinforcing the downward price trend throughout the quarter.
Q3 2025:
During the third quarter of 2025, glass fiber prices in the Asia Pacific region exhibited mixed trends. Industrial and infrastructure demand supported moderate price growth, while fluctuations in raw material supply exerted downward pressure. Export-oriented production strategies affected domestic pricing, as manufacturers sought to remain competitive in global markets. Transportation and logistics challenges contributed to transient price volatility. Strategic pricing by major suppliers, combined with measured inventory adjustments by downstream industries, maintained overall market stability.
Q2 2025:
In the Asia Pacific, glass fiber prices exhibited mild fluctuations but remained largely steady, driven by strong demand from the construction, wind energy, and automotive industries. Major producers in China and India maintained consistent production rates, while regional supply chains remained resilient despite rising input costs. Export volumes influenced local pricing in certain areas, but broader market fundamentals remained stable.
Q1 2025:
Early in 2025, the glass fiber market in the Asia-Pacific area showed a steady but nuanced development. Proactive restocking and foreign demand in preparation for possible trade disruptions drove a price increase in January, marking a considerable period of activity. Despite logistical difficulties and growing feedstock costs, prices stabilized by February as production levels returned to normal. Although export orders suffered because of tariff fears in important international markets, domestic vehicle sales appeared to be rebounding. Prices slightly decreased in March as supply continued to outpace demand, but the market held firm due to robust logistics and incentives for domestic manufacturing.
This glass fiber price analysis can be expanded to include a comprehensive list of countries within the region.
| Region | Countries Covered |
|---|---|
| Asia Pacific | China, India, Indonesia, Pakistan, Bangladesh, Japan, Philippines, Vietnam, Thailand, South Korea, Malaysia, Nepal, Taiwan, Sri Lanka, Hongkong, Singapore, Australia, and New Zealand, among other Asian countries. |
Latin America Glass Fiber Price Trend
Q1 2026:
In Latin America, glass fiber prices experienced noticeable growth supported by steady demand from construction and infrastructure sectors. Regional consumption remained consistent, driven by ongoing development projects and industrial applications requiring durable composite materials. Supply conditions remained relatively tight due to limited domestic manufacturing capacity, increasing reliance on imports to meet demand requirements. Import flows were steady but did not fully ease supply constraints, which supported upward pricing pressure.
Q4 2025:
Glass fiber prices in Latin America trended upward primarily due to import constraints and localized demand strength. Infrastructure and industrial projects supported consistent consumption, while logistical challenges limited timely material availability. The region’s dependence on imported glass fiber amplified the impact of supply delays, tightening market conditions. Buyers increasingly accepted higher prices to ensure continuity of supply, particularly in project-driven segments.
Q3 2025:
During the third quarter of 2025, glass fiber prices in Latin America showed a slight decline in certain markets. Reduced construction and industrial activity constrained demand, while import competition influenced domestic pricing strategies. Logistical inefficiencies and higher energy costs for production contributed to uneven price adjustments. Suppliers adopted cautious pricing approaches to retain market share, while downstream industries optimized inventory levels to manage costs.
Q2 2025:
In Latin America, glass fiber prices exhibited steady to mildly firm market behavior. The construction and automotive sectors sustained consistent demand, particularly for reinforced plastics and insulation materials. Import dependency from global suppliers, particularly in Brazil and Mexico, has led to increased sensitivity toward international freight rates and raw material availability. While input costs showed minor fluctuations, local supply chains remained stable, limiting large price swings.
Q1 2025:
As per the glass fiber price index, prices were influenced by elevated demand for glass fiber in various industries, such as automotive, construction, aerospace, and renewable energy. Besides, increased activity in the appliance manufacturing segment further played a significant role. Moreover, economic fluctuations, including recessions and political instability, further impacted pricing.
This comprehensive review can be extended to include specific countries within the region.
| Region | Countries Covered |
|---|---|
| Latin America | Brazil, Mexico, Argentina, Columbia, Chile, Ecuador, and Peru, among other Latin America countries. |
Glass Fiber Pricing Report, Market Analysis, and News
IMARC's latest publication, “Glass Fiber Prices, Trend, Chart, Demand, Market Analysis, News, Historical and Forecast Data Report 2026 Edition,” presents a detailed examination of the glass fiber market, providing insights into both global and regional trends that are shaping prices. This report delves into the spot price of glass fiber at major ports and analyzes the composition of prices, including FOB and CIF terms. It also presents detailed glass fiber prices trend analysis by region, covering North America, Europe, Asia Pacific, Latin America, and Middle East and Africa. The factors affecting glass fiber pricing, such as the dynamics of supply and demand, geopolitical influences, and sector specific developments, are thoroughly explored. This comprehensive report helps stakeholders stay informed with the latest market news, regulatory updates, and technological progress, facilitating informed strategic decision-making and forecasting.
Glass Fiber Industry Analysis
The global glass fiber market size reached 5.3 Million Tons in 2025. By 2034, IMARC Group expects the market to reach 7.4 Million Tons, at a projected CAGR of 3.76% during 2026-2034. The market is primarily driven by the rising demand in construction and automotive sectors, increasing adoption in renewable energy applications, and technological advancements in composite materials that enhance strength, durability, and versatility across industrial applications.
Latest News and Developments:
- November 2025: AGY, recognized for developing and producing advanced specialty glass fiber reinforcements used in high-performance composite materials, headquartered in Aiken, South Carolina, reported plans to expand its manufacturing footprint in Aiken County. The company committed an investment of USD 12.1 Million, which was expected to generate 80 additional jobs.
Product Description
Glass fiber, commonly known as fiberglass, is a high-performance material made from extremely fine strands of glass. Renowned for its exceptional strength-to-weight ratio, glass fiber is a versatile and cost-effective solution widely used across multiple industries, including construction, automotive, aerospace, and marine. It is non-combustible, corrosion-resistant, and demonstrates excellent thermal and electrical insulation properties, making it ideal for demanding applications.
Fiberglass is typically available in various forms such as mats, woven fabrics, and chopped strands, allowing it to be tailored to specific manufacturing processes like molding, lamination, or reinforcement. When combined with resins, glass fiber forms durable composite materials used in panels, pipes, tanks, and structural components. Its lightweight nature reduces overall product weight without compromising durability, contributing to fuel efficiency in vehicles and ease of handling in construction. Glass fiber also offers superior resistance to moisture, chemicals, and environmental wear, ensuring long-term performance even in harsh conditions.
Report Coverage
| Key Attributes | Details |
|---|---|
| Product Name | Glass Fiber |
| Report Features | Exploration of Historical Trends and Market Outlook, Industry Demand, Industry Supply, Gap Analysis, Challenges, Ammonium Perchlorate Price Analysis, and Segment-Wise Assessment. |
| Currency/Units | US$ (Data can also be provided in local currency) or Metric Tons |
| Region/Countries Covered | The current coverage includes analysis at the global and regional levels only. Based on your requirements, we can also customize the report and provide specific information for the following countries: Asia Pacific: China, India, Indonesia, Pakistan, Bangladesh, Japan, Philippines, Vietnam, Thailand, South Korea, Malaysia, Nepal, Taiwan, Sri Lanka, Hongkong, Singapore, Australia, and New Zealand Europe: Germany, France, United Kingdom, Italy, Spain, Russia, Turkey, Netherlands, Poland, Sweden, Belgium, Austria, Ireland, Switzerland, Norway, Denmark, Romania, Finland, Czech Republic, Portugal and Greece North America: United States and Canada Latin America: Brazil, Mexico, Argentina, Columbia, Chile, Ecuador, and Peru Middle East & Africa: Saudi Arabia, UAE, Israel, Iran, South Africa, Nigeria, Oman, Kuwait, Qatar, Iraq, Egypt, Algeria, and Morocco The list of countries presented is not exhaustive. Information on additional countries can be provided if required by the client. |
| Information Covered for Key Suppliers |
|
| Customization Scope | The report can be customized as per the requirements of the customer |
| Report Price and Purchase Option |
Plan A: Monthly Updates - Annual Subscription
Plan B: Quarterly Updates - Annual Subscription
Plan C: Biannually Updates - Annual Subscription
|
| Post-Sale Analyst Support | 360-degree analyst support after report delivery |
| Delivery Format | PDF and Excel through email (We can also provide the editable version of the report in PPT/Word format on special request) |
Key Benefits for Stakeholders:
- IMARC’s report presents a detailed analysis of glass fiber pricing, covering global and regional trends, spot prices at key ports, and a breakdown of FOB and CIF prices.
- The study examines factors affecting glass fiber price trend, including input costs, supply-demand shifts, and geopolitical impacts, offering insights for informed decision-making.
- The competitive landscape review equips stakeholders with crucial insights into the latest market news, regulatory changes, and technological advancements, ensuring a well-rounded, strategic overview for forecasting and planning.
- IMARC offers various subscription options, including monthly, quarterly, and biannual updates, allowing clients to stay informed with the latest market trends, ongoing developments, and comprehensive market insights. The glass fiber price charts ensure our clients remain at the forefront of the industry.
Need more help?
- Speak to our experienced analysts for insights on the current market scenarios.
- Include additional segments and countries to customize the report as per your requirement.
- Gain an unparalleled competitive advantage in your domain by understanding how to utilize the report and positively impacting your operations and revenue.
- For further assistance, please connect with our analysts.
 Request Customization
 Inquire Before Buying
 Speak to an Analyst
 Request Brochure
Benefits of Customization
- Personalize this research
- Triangulate with your data
- Get data as per your format and definition
- Gain a deeper dive into a specific application, geography, customer, or competitor
- Any level of personalization
Get in Touch With Us
UNITED STATES
Phone: +1-201-971-6302
INDIA
Phone: +91-120-433-0800
UNITED KINGDOM
Phone: +44-753-714-6104
Email: [email protected]
Client Testimonials


.webp)


Why Choose Us
IMARC offers trustworthy, data-centric insights into commodity pricing and evolving market trends, enabling businesses to make well-informed decisions in areas such as procurement, strategic planning, and investments. With in-depth knowledge spanning more than 1000 commodities and a vast global presence in over 150 countries, we provide tailored, actionable intelligence designed to meet the specific needs of diverse industries and markets.
1000
+Commodities
150
+Countries Covered
3000
+Clients
20
+Industry
Robust Methodologies & Extensive Resources
IMARC delivers precise commodity pricing insights using proven methodologies and a wealth of data to support strategic decision-making.
Subscription-Based Databases
Our extensive databases provide detailed commodity pricing, import-export trade statistics, and shipment-level tracking for comprehensive market analysis.
Primary Research-Driven Insights
Through direct supplier surveys and expert interviews, we gather real-time market data to enhance pricing accuracy and trend forecasting.
Extensive Secondary Research
We analyze industry reports, trade publications, and market studies to offer tailored intelligence and actionable commodity market insights.
Trusted by 3000+ industry leaders worldwide to drive data-backed decisions. From global manufacturers to government agencies, our clients rely on us for accurate pricing, deep market intelligence, and forward-looking insights.