
Graphite Prices, Trend, Chart, Demand, Market Analysis, News, Historical and Forecast Data Report 2026 Edition
Graphite Price Trend, Index and Forecast
Track the latest insights on graphite price trend and forecast with detailed analysis of regional fluctuations and market dynamics across North America, Latin America, Central Europe, Western Europe, Eastern Europe, Middle East, North Africa, West Africa, Central and Southern Africa, Central Asia, Southeast Asia, South Asia, East Asia, and Oceania.
Graphite Prices Outlook Q2 2026
- USA: USD 852/MT
- China: USD 542/MT
- Germany: USD 803/MT
- Brazil: USD 1946/MT
- United Kingdom: USD 1453/MT
Graphite Price Chart

Get real-time access to monthly/quarterly/yearly prices Request Sample
During the second quarter of 2026, the graphite prices in the USA reached USD 852/MT in June. Prices in the country remained under downward pressure through the quarter due to softer industrial offtake from steel and battery related sectors. Procurement activity stayed cautious as end users managed inventories at controlled levels, reducing spot demand. Import availability also improved from key supplying regions, which contributed to easing price momentum.
During the second quarter of 2026, the graphite prices in China reached USD 542/MT in June. The market remained influenced by stable domestic production levels and consistent supply from major processing hubs. Demand from the battery materials sector showed moderated activity, as producers adjusted procurement strategies in response to inventory normalization. Export demand stayed selective, with buyers prioritizing competitive sourcing alternatives.
During the second quarter of 2026, the graphite prices in Germany reached USD 803/MT in June. The market experienced pressure from subdued industrial demand, particularly from the steel and automotive manufacturing sectors. Procurement cycles remained conservative as buyers focused on inventory control and long term contract stability. Import flows from external suppliers remained consistent, contributing to adequate market availability.
During the second quarter of 2026, the graphite prices in Brazil reached USD 1946/MT in June. Domestic market conditions were influenced by strong dependence on import flows and fluctuating freight considerations. Industrial demand from metallurgy and battery related applications remained steady but not strong enough to drive price increases. Procurement activity was shaped by cautious buying behavior as end users responded to shifting global supply conditions.
During the second quarter of 2026, the graphite prices in the United Kingdom reached USD 1453/MT in June. Market activity reflected moderate demand from industrial manufacturing and energy storage related applications. Buyers adopted a measured procurement approach, focusing on contract coverage rather than spot market expansion. Import dependency remained a key factor influencing availability and pricing stability. Supply chains operated without major disruption, ensuring consistent material flow into the market.
Graphite Prices Outlook Q1 2026
- USA: USD 863/MT
- China: USD 546/MT
- Germany: USD 821/MT
- Brazil: USD 2013/MT
- United Kingdom: USD 1471/MT
During the first quarter of 2026, the graphite prices in the USA reached 863 USD/MT in March. The market experienced a slight upward trend supported by steady demand from the battery manufacturing and steel production sectors. Domestic production remained stable, while consistent import flows ensured balanced availability. Demand from electric vehicle and energy storage applications supported consumption levels.
During the first quarter of 2026, the graphite prices in China reached 546 USD/MT in March. The market recorded a slight increase driven by steady demand from battery and electronics manufacturing sectors. Production levels remained stable, supported by consistent mining and processing activity. Export demand contributed to maintaining balanced supply conditions in the domestic market. Consumption patterns remained firm, particularly from lithium ion battery production.
During the first quarter of 2026, the graphite prices in Germany reached 821 USD/MT in March. The market experienced moderate increase supported by steady demand from automotive and industrial sectors. Supply conditions remained balanced due to stable imports and consistent processing activity. Demand from battery manufacturing and advanced materials applications supported consumption levels. Buyers maintained disciplined procurement strategies, focusing on maintaining optimal inventory levels.
During the first quarter of 2026, the graphite prices in Brazil reached 2013 USD/MT in March. The market observed a noticeable upward trend driven by strong demand from export markets and domestic industrial applications. Production levels remained steady, ensuring consistent supply availability. Export activity supported pricing, limiting excess supply in the domestic market. Consumption from steel and battery related industries remained stable, contributing to overall market strength.
During the first quarter of 2026, the graphite prices in the United Kingdom reached 1471 USD/MT in March. The market recorded moderate increase supported by the steady demand from industrial and energy sectors. Import dependence influenced supply conditions, while consistent inflows ensured adequate availability. Consumption from battery manufacturing and metallurgical applications remained stable, supporting pricing trends. Buyers followed cautious procurement strategies, maintaining sufficient inventory levels without expanding stock significantly.
Graphite Prices Outlook Q4 2025
- USA: USD 856/MT
- China: USD 542/MT
- Germany: USD 814/MT
- Brazil: USD 1963/MT
- United Kingdom: USD 1452/MT
During the fourth quarter of 2025, the graphite prices in the USA reached 856 USD/MT in December. Prices moved downward as demand from refractory applications and traditional industrial uses softened. Additionally, moderated activity across steelmaking and foundry operations reduced consumption intensity. Moreover, sufficient availability allowed procurement to remain aligned with short-term operational requirements rather than forward sourcing.
During the fourth quarter of 2025, the graphite prices in China reached 542 USD/MT in December. Prices declined as consumption from electrodes, refractories, and industrial processing applications eased. Furthermore, ample domestic supply and inventory availability reduced sourcing urgency. In addition, procurement volumes were adjusted to reflect moderated downstream production schedules.
During the fourth quarter of 2025, the graphite prices in Germany reached 814 USD/MT in December. Prices moved upward supported by steady demand from specialty manufacturing, advanced materials, and industrial processing applications. Additionally, requirements from high-performance uses sustained offtake. Moreover, procurement strategies emphasized securing consistent quality material aligned with production planning.
During the fourth quarter of 2025, the graphite prices in Brazil reached 1963 USD/MT in December. Prices increased as demand from metallurgical processing and industrial applications strengthened. Furthermore, limited availability of suitable grades influenced sourcing behavior. In addition, procurement activity reflected the need to maintain continuity across downstream manufacturing operations.
During the fourth quarter of 2025, the graphite prices in the United Kingdom reached 1452 USD/MT in December. Prices edged upward driven by steady consumption from industrial processing, specialty manufacturing, and materials engineering applications. Moreover, import reliance shaped sourcing strategies. Additionally, procurement decisions focused on delivery reliability and alignment with confirmed production schedules.
Graphite Prices Outlook Q3 2025
- USA: USD 876/MT
- China: USD 573/MT
- Germany: USD 806/MT
- Brazil: USD 1942/MT
- United Kingdom: USD 1425/MT
During the third quarter of 2025, the graphite prices in the USA reached 876 USD/MT in September. The decline in prices was primarily driven by a slowdown in domestic manufacturing demand for battery-grade graphite and reduced industrial activity in key end-use sectors. Supply-side pressures eased due to steady imports from Asia and improved domestic production capacity, resulting in increased availability in the market. Logistics and transportation costs remained stable, minimizing additional cost pressures.
During the third quarter of 2025, the graphite prices in China reached 573 USD/MT in September. Prices fell sharply due to weakened demand from the automotive and battery manufacturing sectors, particularly as production schedules were curtailed. Export restrictions and policy-driven adjustments in industrial output contributed to reduced domestic consumption. Supply-side factors, including increased availability from local mines and lower raw material procurement costs, exerted downward pressure on the market. Logistics challenges were largely mitigated, and minor fluctuations in the Renminbi against USD had limited influence.
During the third quarter of 2025, the graphite prices in Germany reached 806 USD/MT in September. The moderate price increase was driven by sustained demand from the manufacturing and construction sectors, particularly for high-purity graphite used in industrial applications. Supply-side constraints, including limited availability from domestic processing plants, added incremental pressures. International shipping rates and customs-related expenses for imported graphite were stable but influenced overall cost structures. Additionally, adherence to European Union environmental and safety regulations added compliance-related costs. Currency stability in the Euro against USD supported price increases without major volatility.
During the third quarter of 2025, the graphite prices in Brazil reached 1942 USD/MT in September. Prices experienced a slight increase as demand from industrial and energy sectors remained steady, particularly for refractory and battery applications. Supply-side factors included consistent domestic production, though logistical and transportation costs, including port handling and rail fees, contributed marginally to overall pricing. Currency fluctuations between the Brazilian Real and USD had a minor impact on imported material costs. Compliance with local environmental and quality standards maintained moderate cost pressures.
During the third quarter of 2025, the graphite prices in the United Kingdom reached 1425 USD/MT in September. The increase was influenced by consistent demand from the industrial and energy storage sectors, especially for high-purity graphite applications. Supply-side pressures remained moderate, with domestic production meeting a portion of demand while imports filled the remaining gap. Transportation and logistics costs, particularly port handling and domestic distribution, contributed to incremental price increases.
Graphite Prices Outlook Q2 2025
- USA: USD 914/MT
- China: USD 631/MT
- Germany: USD 786/MT
- Brazil: USD 1917/MT
- United Kingdom: USD 1380/MT
During the second quarter of 2025, the graphite prices in the USA reached 914 USD/MT in June. The steep decline was largely driven by reduced demand in the energy storage and automotive sectors. Excess inventory levels pressured distributors to offer discounts, while international supply remained stable. Operational costs, including logistics and domestic transportation, had a limited impact on the overall price trend. Regulatory compliance and environmental requirements imposed moderate cost adjustments.
During the second quarter of 2025, the graphite prices in China reached 631 USD/MT in June. Price reductions were primarily influenced by declining demand from lithium-ion battery manufacturers and other industrial sectors. Domestic production maintained consistent volumes, keeping supply adequate and limiting the ability for prices to stabilize. Energy costs and port handling fees were stable, while environmental compliance measures imposed minor additional costs. Exchange rate fluctuations against the USD had a negligible impact on import-dependent procurement.
During the second quarter of 2025, the graphite prices in Germany reached 786 USD/MT in June. The downward trend was driven by weakened demand in industrial applications, including refractories, lubricants, and renewable energy equipment. While domestic supply remained relatively steady, high operational and energy costs exerted limited upward pressure on prices. Transportation logistics and compliance with EU environmental regulations contributed marginally to overall pricing. Currency fluctuations against the USD slightly influenced import costs.
During the second quarter of 2025, the graphite prices in Brazil reached 1917 USD/MT in June. Prices saw modest increases as steady demand in the steel and refractory industries offset production cost pressures. Supply was sufficient to meet market requirements, while domestic logistics and freight charges had minimal impact on pricing. Regulatory compliance imposed slight cost increments.
During the second quarter of 2025, the graphite prices in the United Kingdom reached 1380 USD/MT in June. The decline reflected weakening industrial and automotive demand. Supply availability remained consistent, limiting upward price pressures. Transportation and customs logistics added minor costs, while compliance with stringent UK and EU environmental regulations contributed slightly to operational expenses. Currency stability against USD minimally impacted imported inputs.
Graphite Prices Outlook Q1 2025
- USA: USD 1057/MT
- China: USD 691/MT
- Germany: USD 848/MT
- Brazil: USD 1870/MT
- United Kingdom: USD 1513/MT
During the first quarter of 2025, the graphite prices in the USA reached 1057 USD/MT in March. As per the graphite price chart, due to steady manufacturing activity and a resurgence in demand from the infrastructure and automotive industries, the market in the United States experienced modest price increases. However, supply shortages, especially as a result of China's export restrictions and growing input costs raised prices in the middle of the quarter.
During the first quarter of 2025, graphite prices in China reached 691 USD/MT in March. China's graphite market performed inconsistently, mostly due to the region's changing supply-demand dynamics and the overall state of the economy. Early hope was replaced by difficulties in the downstream demand and industrial sectors. However, supply was limited due to strict export controls and Lunar New Year disruptions in the middle of the quarter.
During the first quarter of 2025, the graphite prices in Germany reached 848 USD/MT in March. Despite initial indications of economic improvement, the market encountered difficulties. High inventory levels, ongoing oversupply, and geopolitical unrest in key supply countries impacted the market. At the beginning of the quarter, prices increased somewhat, but by the conclusion of the quarter, they had sharply declined.
During the first quarter of 2025, the graphite prices in Brazil reached 1870 USD/MT in March. Disruptions to the graphite supply chain due to logistical challenges or tightening export regulations in major producing nations led to price fluctuations in Brazil. Besides, economic conditions, including inflation, changes in currency exchange rates, and local industrial activity, also impacted pricing trends.
During the first quarter of 2025, the graphite prices in the United Kingdom reached 1513 USD/MT in March. The market was volatile due to shifting industrial sector demand and disruptions in the worldwide supply chain. External considerations, such as logistical difficulties and changes in trade policy, tempered early confidence. However, the market remained cautious due to overstock and weak development from other industries.
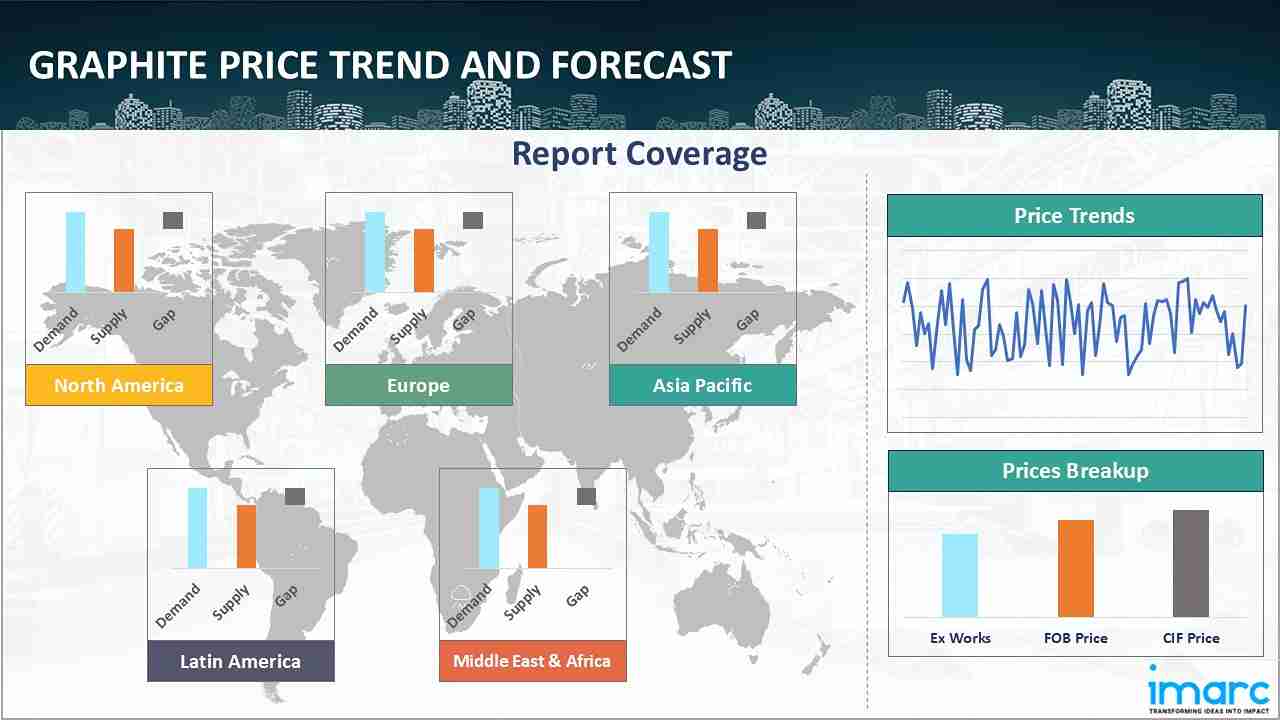
Regional Coverage
The report provides a detailed analysis of the market across different regions, each with unique pricing dynamics influenced by localized market conditions, supply chain intricacies, and geopolitical factors. This includes price trends, price forecast and supply and demand trends for each region, along with spot prices by major ports. The report also provides coverage of FOB and CIF prices, as well as the key factors influencing graphite prices.
Europe Graphite Price Trend
Q2 2026:
The graphite price index in Europe reflected a generally soft movement. Market conditions were shaped by moderate industrial demand across steel, automotive, and energy storage sectors. Buyers maintained controlled procurement strategies, focusing on inventory optimization rather than expansion. Import flows from global suppliers remained steady, ensuring adequate availability across major consuming hubs. Energy and operational cost considerations influenced processing economics but did not translate into stronger downstream pricing support. Overall sentiment remained cautious, with stable supply conditions and subdued consumption patterns guiding regional price behavior throughout the quarter.
Q1 2026:
The graphite price index in Europe showed a moderate upward trend supported by steady demand from automotive, industrial, and energy storage sectors. Supply conditions remained balanced due to consistent import flows and stable processing activity across the region. Consumption from battery manufacturing and advanced materials applications supported market stability. Buyers maintained cautious procurement strategies, ensuring adequate inventory levels without aggressive purchasing. Additionally, firm energy and logistics costs contributed to upward pricing pressure.
Q4 2025:
As per the graphite price index, pricing conditions across Europe strengthened, supported by steady offtake from specialty manufacturing, advanced materials processing, and industrial applications. Additionally, requirements from high-performance and engineered material uses sustained procurement activity. Moreover, sourcing strategies emphasized quality assurance, supply reliability, and alignment with regulated production standards. Inventory planning focused on ensuring uninterrupted availability rather than expanding spot-market exposure.
Q3 2025:
In Q3 2025, the graphite price index in Europe exhibited moderate growth due to steady industrial demand and production constraints in Germany and the United Kingdom. Price increases were driven by higher operational costs, energy-intensive processing, and compliance with EU environmental regulations. Logistics adjustments, including port handling and domestic freight optimization, contributed marginally. Stable currency exchange rates minimized import cost fluctuations.
Q2 2025:
In Europe, the graphite price index in Q2 2025 experienced a noticeable decline, influenced by weakened demand from industrial sectors, including refractories, lubricants, and renewable energy equipment manufacturing. Domestic production remained stable, preventing more severe price fluctuations, while import volumes from Asia and other regions maintained market balance. Logistics costs, including transportation from ports to industrial hubs, contributed marginally to overall pricing. Compliance with stringent EU environmental and occupational safety regulations added moderate incremental costs.
Q1 2025:
As per the graphite price index, the market struggled with an unbalanced supply-demand relationship due to bloated stockpiles and persistent geopolitical turmoil. Pricing was still mostly determined by external supply pressures, even though sustainability policies and the early stages of economic recovery provided some support. Due to poor demand and reliance on inventory, Germany, a crucial market, experienced significant price drops after early-quarter price increases.
This analysis can be extended to include detailed graphite price information for a comprehensive list of countries.
| Region | Countries Covered |
|---|---|
| Europe | Germany, France, United Kingdom, Italy, Spain, Russia, Turkey, Netherlands, Poland, Sweden, Belgium, Austria, Ireland, Switzerland, Norway, Denmark, Romania, Finland, Czech Republic, Portugal, and Greece, among other European countries. |
North America Graphite Price Trend
Q2 2026:
The graphite price index in North America showed a downward trend. Demand from industrial manufacturing and battery related applications remained limited, leading to reduced spot market activity. Procurement behavior stayed conservative as end users focused on inventory management and long term contract reliance. Import availability improved steadily, easing any potential supply tightness. Logistics performance remained stable, supporting efficient distribution across key consumption centers. The regional market reflected weak demand signals combined with sufficient supply, resulting in overall price softness across the quarter.
Q1 2026:
The graphite price index in North America reflected a slight increase driven by steady demand from battery manufacturing and steel industries. Domestic production remained stable, while imports ensured balanced supply conditions. Consumption patterns remained consistent, particularly from electric vehicle and energy storage applications. Buyers followed disciplined procurement strategies, maintaining sufficient inventory without overstocking. Additionally, stable logistics and processing costs supported pricing trends. The market environment remained balanced, with steady demand and controlled supply contributing to gradual price increases across the region.
Q4 2025:
As per the graphite price index, pricing conditions in North America weakened as consumption from traditional industrial uses and metallurgical applications moderated. Furthermore, adequate supply availability reduced procurement pressure across the region. In addition, sourcing strategies centered on inventory optimization, contract adherence, and aligning purchases with near-term operational needs rather than forward accumulation.
Q3 2025:
In Q3 2025, the graphite price index in North America showed a decline, primarily due to reduced demand in automotive and energy storage sectors. Inventory accumulation at distributors and steady domestic production created downward pricing pressure. Logistics improvements partially mitigated the decline, while currency fluctuations and regulatory compliance added minor cost effects. The net effect was a moderate reduction in graphite prices across the region during the third quarter of 2025.
Q2 2025:
In North America, the graphite price index in Q2 2025 showed a pronounced decrease due to softer demand in automotive, battery manufacturing, and industrial applications. Inventory accumulation at distribution centers created downward pressure on market prices, while domestic production remained sufficient to meet prevailing requirements. Operational costs, including domestic freight and port handling, had a moderate effect on pricing, whereas compliance with environmental and safety regulations imposed only minor additional costs.
Q1 2025:
Changes in global supply chains, uncertainty around trade policy, and shifting industrial demand all contributed to significant volatility in the market. Due to the region's reliance on imported graphite, mainly from China and new African sources, the market was highly vulnerable to global events and growing logistical expenses. Besides, at the beginning of the quarter, graphite prices in the US increased somewhat due to steady manufacturing activity and reviving demand from industries like infrastructure and the automotive sector.
Specific graphite historical data within the United States and Canada can also be provided.
| Region | Countries Covered |
|---|---|
| North America | United States and Canada |
Middle East and Africa Graphite Price Trend
Q2 2026:
The study covers graphite pricing trends and price charts across the Middle East and Africa, taking into consideration elements that have a direct impact on market prices, such as regional industrial expansion, natural resource availability, and geopolitical concerns.
Q1 2026:
The report explores the graphite trends and graphite chart in the Middle East and Africa, considering factors like regional industrial growth, the availability of natural resources, and geopolitical tensions that uniquely influence market prices.
Q4 2025:
As per graphite price chart, the prices in the Middle East and Africa fluctuated due to a complex interplay of factors, primarily driven by supply chain disruptions, seasonal demand shifts, and geopolitical influences.
In addition to region-wise data, information on graphite prices for countries can also be provided.
| Region | Countries Covered |
|---|---|
| Middle East and Africa | Saudi Arabia, UAE, Israel, Iran, South Africa, Nigeria, Oman, Kuwait, Qatar, Iraq, Egypt, Algeria, and Morocco, among other Middle Eastern and African countries. |
Asia Pacific Graphite Price Trend
Q2 2026:
The graphite market in the Asia Pacific reflected a softer tone. Strong production capacity in major supplying countries supported adequate market availability. Demand from battery manufacturing and industrial applications remained steady but lacked strong upward momentum. Export activity showed selective movement as international buyers adjusted sourcing strategies. Domestic consumption patterns were influenced by inventory normalization across several downstream sectors. Overall, the region experienced balanced supply conditions with mild demand pressure, resulting in a generally subdued pricing environment throughout the quarter.
Q1 2026:
In the Asia Pacific region, graphite prices showed a moderate growth driven by steady demand from electronics and battery manufacturing sectors. Production levels remained stable, ensuring consistent supply availability. Export and import flows were balanced, supporting market stability. Consumption patterns remained firm, particularly from lithium ion battery production. Buyers maintained cautious inventory management practices, avoiding overstocking. Additionally, stable logistics and operational costs contributed to upward pricing trends. These factors supported a gradual increase in prices across the region.
Q4 2025:
Across Asia Pacific, graphite pricing conditions softened as demand from electrodes, industrial processing, and manufacturing applications eased. Furthermore, balanced availability from domestic production and imports reduced buying urgency. In addition, sourcing strategies emphasized cost control, inventory visibility, and short-cycle purchasing aligned with moderated downstream activity.
Q3 2025:
In the Asia Pacific region, Q3 2025 graphite prices experienced a noticeable decline, primarily due to weaker demand from the battery manufacturing sector, particularly for lithium-ion batteries, and reduced consumption across key industrial applications, including refractories, lubricants, and steel-related processes. Despite this demand softening, supply-side conditions remained relatively stable, with domestic production levels and imports sufficient to meet existing market requirements, which helped prevent sharper price fluctuations.
Q2 2025:
In the Asia Pacific region, graphite prices experienced a moderate decline in Q2 2025, primarily due to reduced demand from lithium-ion battery production and industrial manufacturing sectors. Domestic production and import volumes remained sufficient to maintain supply-demand balance, preventing more pronounced price drops. Logistics efficiency, including improvements in port handling and domestic freight operations, mitigated potential upward cost pressures. Energy costs for graphite processing remained stable, and regulatory compliance added only minor incremental costs.
Q1 2025:
The Asia-Pacific graphite market saw a tumultuous first quarter, primarily due to China's changing supply chain and more general economic difficulties. Market pessimism rapidly replaced the initial optimism brought on by the EV segment's steady output and demand. Stricter export regulations and Lunar New Year slowdowns caused mid-quarter delays that restricted supply, but downstream demand stayed low.
This graphite price analysis can be expanded to include a comprehensive list of countries within the region.
| Region | Countries Covered |
|---|---|
| Asia Pacific | China, India, Indonesia, Pakistan, Bangladesh, Japan, Philippines, Vietnam, Thailand, South Korea, Malaysia, Nepal, Taiwan, Sri Lanka, Hongkong, Singapore, Australia, and New Zealand, among other Asian countries. |
Latin America Graphite Price Trend
Q2 2026:
The graphite market conditions in Latin America recorded a downward movement across the quarter, mainly shaped by weaker industrial purchasing and slower offtake from metallurgical and battery related applications. Import dependence across key consuming markets led to cautious procurement as buyers adjusted to changing global supply conditions. Freight and logistics expenses remained uneven, which influenced landed cost expectations and discouraged aggressive spot buying. Currency fluctuations added further pressure on pricing stability by increasing uncertainty in procurement planning.
Q1 2026:
Latin America's graphite market is predominantly influenced by its rich natural reserves, particularly in countries like Chile and Brazil. However, political instability and inconsistent regulatory frameworks can lead to significant volatility in graphite prices.
Q4 2025:
The graphite market in Latin America reflected strengthening conditions supported by steady consumption from metallurgical processing and industrial manufacturing sectors. Moreover, availability of specific material grades influenced procurement decisions. Additionally, buyers coordinated sourcing with production schedules and logistics planning to ensure continuity of downstream operations.
Q3 2025:
Graphite prices in Latin America, particularly in Brazil, experienced a modest increase during Q3 2025, primarily driven by sustained demand from the steel and industrial sectors, where graphite is a critical input for refractory materials and high-temperature applications. The regional market benefited from stable domestic production, which sufficiently met local consumption needs, limiting the potential for significant price spikes. However, logistics challenges, including transportation from mining sites to processing facilities and port handling for exports, contributed incrementally to overall cost pressures.
Q2 2025:
In Latin America, graphite prices during Q2 2025 showed modest upward movement, primarily driven by steady industrial and steel sector demand. Domestic supply was sufficient to meet market requirements, helping prevent sharp price volatility. Logistics, including transportation from production sites to distribution centers and port handling for export shipments, contributed slightly to overall costs. Compliance with local environmental and occupational safety regulations imposed minor incremental costs. Currency stability in regional markets helped maintain consistency in import-related expenses.
Q1 2025:
As per the graphite price index, prices in Latin America fluctuated due to a combination of factors, including shifts in supply chains, evolving industrial demand, and geopolitical instability in major graphite-producing regions. Additionally, persistent oversupply and high inventories across major supply regions, coupled with geopolitical instability, created a volatile market environment.
This comprehensive review can be extended to include specific countries within the region.
| Region | Countries Covered |
|---|---|
| Latin America | Brazil, Mexico, Argentina, Columbia, Chile, Ecuador, and Peru, among other Latin American countries.Brazil, Mexico, Argentina, Columbia, Chile, Ecuador, and Peru, among other Latin American countries. |
Graphite Pricing Report, Market Analysis, and News
IMARC's latest publication, “Graphite Prices, Trend, Chart, Demand, Market Analysis, News, Historical and Forecast Data Report 2026 Edition,” presents a detailed examination of the graphite market, providing insights into both global and regional trends that are shaping prices. This report delves into the spot price of graphite at major ports and analyzes the composition of prices, including FOB and CIF terms. It also presents detailed graphite prices trend analysis by region, covering North America, Europe, Asia Pacific, Latin America, and Middle East and Africa. The factors affecting graphite pricing, such as the dynamics of supply and demand, geopolitical influences, and sector specific developments, are thoroughly explored. This comprehensive report helps stakeholders stay informed with the latest market news, regulatory updates, and technological progress, facilitating informed strategic decision-making and forecasting.

Graphite Industry Analysis
The global graphite industry size reached USD 28.8 Billion in 2025. By 2034, IMARC Group expects the market to reach USD 50.2 Billion, at a projected CAGR of 6.32% during 2026-2034. The market is primarily driven by the strong demand in lithium ion batteries, industrial lubricants, refractories, and renewable energy applications, increasing adoption of electric vehicles, and growth in the construction and steel industries.
Latest News and Developments:
- March 2026: POSCO Future M, a battery materials subsidiary of POSCO, secured a long term contract valued at 1.0149 Trillion won to supply artificial graphite anode materials to a global automaker. The agreement spans multiple years, with deliveries expected to begin in 2027. This deal strengthened the company’s position in the global battery supply chain and reflected the rising demand for graphite anodes in electric vehicles.
- January 2025: The US Department of Defense's Defense Logistics Agency (DLA) spotlighted a project by Graphite One and Vorbeck Materials to create an environmentally friendly firefighting foam. The Congressionally funded initiative aims to replace traditional foam used by US military and civilian firefighting agencies, utilizing graphite sourced from Graphite One’s deposit in Alaska.
- October 2024: Graphite One Inc. disclosed that it had obtained a non-binding Letter of Interest from the Export-Import Bank of the United States (EXIM), considering potential debt financing of up to USD 325 million. The proposed funding aims to assist Graphite One’s initiative to develop a fully integrated US-based supply chain for high-performance graphite materials.
Product Description
Graphite is a crystalline form of carbon with a layered structure that provides high thermal conductivity, electrical conductivity, and lubricating properties. It occurs naturally in metamorphic rocks and is also produced synthetically for industrial applications. The material is widely used in lithium ion battery anodes, steelmaking as a refractory component, lubricants, and various conductive applications. Its ability to withstand high temperatures makes it essential in foundries and other high temperature industrial processes. In addition, graphite is used in electronics, nuclear applications, and advanced energy storage systems due to its stability and conductivity.
Report Coverage
| Key Attributes | Details |
|---|---|
| Product Name | Graphite |
| Report Features | Exploration of Historical Trends and Market Outlook, Industry Demand, Industry Supply, Gap Analysis, Challenges, Graphite Price Analysis, and Segment-Wise Assessment. |
| Currency/Units | US$ (Data can also be provided in local currency) or Metric Tons |
| Region/Countries Covered | The current coverage includes analysis at the global and regional levels only. Based on your requirements, we can also customize the report and provide specific information for the following countries: Asia Pacific: China, India, Indonesia, Pakistan, Bangladesh, Japan, Philippines, Vietnam, Thailand, South Korea, Malaysia, Nepal, Taiwan, Sri Lanka, Hongkong, Singapore, Australia, and New Zealand Europe: Germany, France, United Kingdom, Italy, Spain, Russia, Turkey, Netherlands, Poland, Sweden, Belgium, Austria, Ireland, Switzerland, Norway, Denmark, Romania, Finland, Czech Republic, Portugal and Greece North America: United States and Canada Latin America: Brazil, Mexico, Argentina, Columbia, Chile, Ecuador, and Peru Middle East & Africa: Saudi Arabia, UAE, Israel, Iran, South Africa, Nigeria, Oman, Kuwait, Qatar, Iraq, Egypt, Algeria, and Morocco The list of countries presented is not exhaustive. Information on additional countries can be provided if required by the client. |
| Information Covered for Key Suppliers |
|
| Customization Scope | The report can be customized as per the requirements of the customer |
| Report Price and Purchase Option |
Plan A: Monthly Updates - Annual Subscription
Plan B: Quarterly Updates - Annual Subscription
Plan C: Biannually Updates - Annual Subscription
|
| Post-Sale Analyst Support | 360-degree analyst support after report delivery |
| Delivery Format | PDF and Excel through email (We can also provide the editable version of the report in PPT/Word format on special request) |
Key Benefits for Stakeholders:
- IMARC’s report presents a detailed analysis of graphite pricing, covering global and regional trends, spot prices at key ports, and a breakdown of FOB and CIF prices.
- The study examines factors affecting graphite price trend, including input costs, supply-demand shifts, and geopolitical impacts, offering insights for informed decision-making.
- The competitive landscape review equips stakeholders with crucial insights into the latest market news, regulatory changes, and technological advancements, ensuring a well-rounded, strategic overview for forecasting and planning.
- IMARC offers various subscription options, including monthly, quarterly, and biannual updates, allowing clients to stay informed with the latest market trends, ongoing developments, and comprehensive market insights. The graphite price charts ensure our clients remain at the forefront of the industry.
Need more help?
- Speak to our experienced analysts for insights on the current market scenarios.
- Include additional segments and countries to customize the report as per your requirement.
- Gain an unparalleled competitive advantage in your domain by understanding how to utilize the report and positively impacting your operations and revenue.
- For further assistance, please connect with our analysts.
 Request Customization
 Inquire Before Buying
 Speak to an Analyst
 Request Brochure
Benefits of Customization
- Personalize this research
- Triangulate with your data
- Get data as per your format and definition
- Gain a deeper dive into a specific application, geography, customer, or competitor
- Any level of personalization
Get in Touch With Us
UNITED STATES
Phone: +1-201-971-6302
INDIA
Phone: +91-120-433-0800
UNITED KINGDOM
Phone: +44-753-714-6104
Email: [email protected]
Client Testimonials


.webp)


Why Choose Us
IMARC offers trustworthy, data-centric insights into commodity pricing and evolving market trends, enabling businesses to make well-informed decisions in areas such as procurement, strategic planning, and investments. With in-depth knowledge spanning more than 1000 commodities and a vast global presence in over 150 countries, we provide tailored, actionable intelligence designed to meet the specific needs of diverse industries and markets.
1000
+Commodities
150
+Countries Covered
3000
+Clients
20
+Industry
Robust Methodologies & Extensive Resources
IMARC delivers precise commodity pricing insights using proven methodologies and a wealth of data to support strategic decision-making.
Subscription-Based Databases
Our extensive databases provide detailed commodity pricing, import-export trade statistics, and shipment-level tracking for comprehensive market analysis.
Primary Research-Driven Insights
Through direct supplier surveys and expert interviews, we gather real-time market data to enhance pricing accuracy and trend forecasting.
Extensive Secondary Research
We analyze industry reports, trade publications, and market studies to offer tailored intelligence and actionable commodity market insights.
Trusted by 3000+ industry leaders worldwide to drive data-backed decisions. From global manufacturers to government agencies, our clients rely on us for accurate pricing, deep market intelligence, and forward-looking insights.