
H Acid Prices, Trend, Chart, Market Analysis, News, Demand, Historical and Forecast Data Report 2026 Edition
H Acid Price Trend, Index and Forecast
Track the latest insights on H acid price trend and forecast with detailed analysis of regional fluctuations and market dynamics across North America, Latin America, Central Europe, Western Europe, Eastern Europe, Middle East, North Africa, West Africa, Central and Southern Africa, Central Asia, Southeast Asia, South Asia, East Asia, and Oceania.
H Acid Prices Outlook Q2 2026
- USA: USD 7070/MT
- China: USD 6679/MT
- Germany: USD 7115/MT
- Belgium: USD 7623/MT
- India: USD 7238/MT
H Acid Price Chart
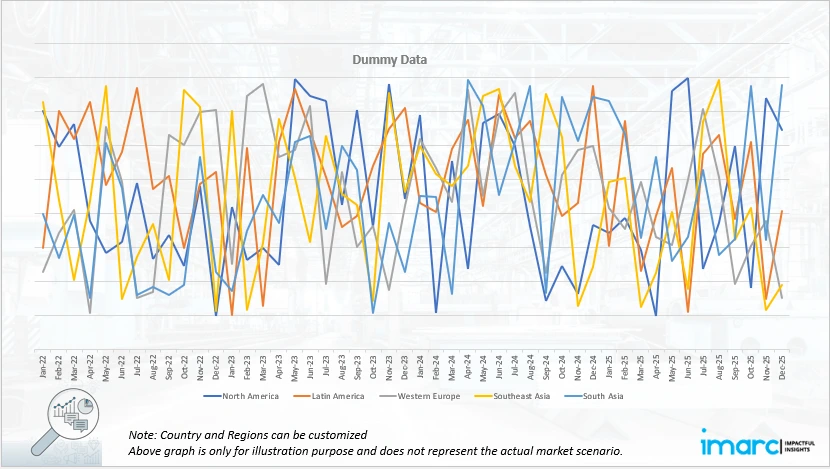
Get real-time access to monthly/quarterly/yearly prices Request Sample
During the second quarter of 2026, the H acid prices in the USA reached 7070 USD/MT in June. Prices increased sharply as stronger demand from dyes, pigments, textile chemicals, and specialty chemical manufacturers coincided with higher import and replacement costs. Regular procurement from downstream dye manufacturers supported consumption throughout the quarter. Limited domestic production increased dependence on overseas suppliers, exposing buyers to changing international availability and freight conditions.
During the second quarter of 2026, the H acid prices in China reached 6679 USD/MT in June. Prices increased sharply as firm demand from dye and pigment manufacturers combined with higher production costs and tighter supply availability. H acid consumption remained supported by manufacturers producing reactive and acid dyes for textile applications. Higher costs associated with naphthalene based intermediates, sulfuric acid, caustic materials, energy, and chemical processing increased manufacturing expenses and encouraged producers to raise quotations.
During the second quarter of 2026, the H acid prices in Germany reached 7115 USD/MT in June. Prices increased sharply as steady requirements from dyes, pigments, specialty chemicals, and textile related applications coincided with tighter import availability. Dependence on external suppliers made the German market sensitive to changing production conditions in major Asian manufacturing centers. Higher international feedstock and processing expenses translated into increased replacement costs for European buyers.
During the second quarter of 2026, the H acid prices in Belgium reached 7623 USD/MT in June. Prices increased substantially as restricted supply availability and strong replacement costs created considerable upward pressure across the market. Demand from dye, pigment, and specialty chemical applications remained supportive, encouraging distributors and industrial buyers to maintain procurement despite higher quotations. Reliance on imported H acid exposed the market to supply conditions in major producing countries and changes in international freight costs.
During the second quarter of 2026, the H acid prices in India reached 7238 USD/MT in June. Prices increased sharply as strong demand from textile dyes, reactive dyes, pigments, and specialty chemical manufacturers tightened market conditions. India’s extensive textile processing and dye manufacturing industries maintained active procurement of H acid and related intermediates. Higher costs for naphthalene based raw materials, acids, alkalis, energy, and processing increased production expenses for domestic manufacturers.
H Acid Prices Outlook Q1 2026
- USA: USD 5268/MT
- China: USD 4887/MT
- Germany: USD 5266/MT
- Belgium: USD 5326/MT
- India: USD 5246/MT
During the first quarter of 2026, the H acid prices in the USA reached 5268 USD/MT in March. The market experienced a moderate increase driven by steady demand from the dyes and pigments industry. Consumption from textile and chemical manufacturing sectors remained consistent, supporting market activity. Supply conditions were relatively controlled due to stable domestic production and limited import fluctuations. Buyers maintained balanced procurement strategies, ensuring sufficient inventory without excessive accumulation.
During the first quarter of 2026, the H acid prices in China reached 4887 USD/MT in March. The market recorded a notable upward trend supported by strong demand from the textile and dye manufacturing sectors. Domestic production remained stable but controlled due to environmental regulations, limiting excess supply. Export demand also contributed to tightening availability in the domestic market.
During the first quarter of 2026, the H acid prices in Germany reached 5266 USD/MT in March. The market observed a gradual price increase driven by steady demand from industrial dye and pigment applications. Supply conditions remained balanced due to consistent import availability and stable domestic production. Consumption from the textile and specialty chemical sectors remained firm, supporting pricing. Buyers maintained cautious but consistent procurement strategies.
During the first quarter of 2026, the H acid prices in Belgium reached 5326 USD/MT in March. The market experienced steady growth supported by firm demand from the downstream dye and pigment industries. Import flows remained consistent, ensuring stable supply levels. Consumption from industrial applications remained stable, contributing to market balance. Buyers followed disciplined procurement strategies, avoiding excess inventory buildup.
During the first quarter of 2026, the H acid prices in India reached 5246 USD/MT in March. The market witnessed a noticeable increase driven by strong demand from the textile and dye manufacturing industries. Domestic production remained stable but was influenced by controlled supply conditions and regulatory factors. Export demand supported market activity, contributing to tighter availability.
H Acid Prices Outlook Q3 2025
- USA: USD 5170/MT
- China: USD 4724/MT
- Germany: USD 5108/MT
- Belgium: USD 5216/MT
- India: USD 5033/MT
During the third quarter of 2025, the H acid prices in the USA reached 5170 USD/MT in September. Prices showed upward movement driven by stable downstream dye and pigment demand and improved domestic procurement activity. Production rates remained disciplined, preventing oversupply, while logistics efficiency supported consistent deliveries. Higher operating costs for specialty chemical producers and firm export interest added further upward pressure.
During the third quarter of 2025, the H acid prices in China reached 4724 USD/MT in September. Prices softened due to subdued domestic demand from dye intermediates and cautious purchasing behavior among downstream buyers. Adequate supply availability and competitive export offers increased market competition. Manufacturing activity slowed as producers adjusted output to manage inventories. Additionally, weaker international inquiries limited export-driven price support.
During the third quarter of 2025, the H acid prices in Germany reached 5108 USD/MT in September. Prices increased as demand from specialty chemical and textile industries improved. Supply constraints emerged due to maintenance shutdowns and stricter operational compliance, reducing spot availability. Elevated production expenses and firm import replacement costs supported higher price levels.
During the third quarter of 2025, the H acid prices in Belgium reached 5216 USD/MT in September. Market prices strengthened due to robust regional demand and limited supply inflows. Producers maintained firm pricing strategies amid higher processing costs and stable export demand. Inventory drawdowns supported bullish sentiment, while logistical efficiency ensured smooth distribution.
During the third quarter of 2025, the H acid prices in India reached 5033 USD/MT in September. Prices declined slightly as domestic demand softened and buyers delayed purchases amid ample availability. Producers operated at steady rates, ensuring sufficient supply. Export demand remained moderate, limiting upward momentum. Competitive pricing strategies among suppliers further pressured prices, while stable input costs prevented sharp volatility, resulting in a mild downward trend during the quarter.
H Acid Prices Outlook Q2 2025
- USA: USD 5015/MT
- China: USD 4850/MT
- Germany: USD 4935/MT
- Belgium: USD 5030/MT
- India: USD 5120/MT
During the second quarter of 2025, H acid prices in the USA reached 5015 USD/MT in June. The USA’s H acid prices remained under pressure due to subdued demand from the textile dye sector and increasing import competition from low-cost Asian suppliers. Stable feedstock prices and favorable shipping rates kept supply chains uninterrupted, resulting in sufficient market availability. Buyers preferred short-term purchases, anticipating further price corrections amid soft downstream activity. While imports from India and China maintained steady flows, overall consumption levels were insufficient to support price growth, leading to a slightly bearish but stable quarterly market performance.
During the second quarter of 2025, H acid prices in China reached 4850 USD/MT in June. H acid prices in China recorded slight downward movements due to oversupply and limited export demand, especially from Europe. Domestic consumption in the textile dye industry remained lackluster, while production rates stayed high, leading to stock accumulation. Competitive export offers to South Asia and Southeast Asia intensified price competition among suppliers. Weak global demand, coupled with steady raw material availability, restricted any upward momentum. Despite the bearish tone, the Chinese market remained a key global supplier, leveraging cost advantages to sustain export volumes.
During the second quarter of 2025, the H acid prices in Germany reached 4935 USD/MT in June. Germany’s H acid market experienced moderate price declines, driven by weak domestic consumption and sluggish orders from the textile and leather industries. Imports from India and China remained steady, but competitive pricing from Asian suppliers added pressure on local traders. Stable raw material costs and smooth logistics operations kept supply consistent. However, downstream demand recovery was slow, with buyers maintaining short-term purchasing strategies to avoid excess inventory. Overall, the market was characterized by cautious trading activity and mild downward price corrections.
During the second quarter of 2025, the H acid prices in Belgium reached 5030 USD/MT in June. H acid prices in Belgium trended downward, influenced by lower demand from the textile dye sector and reduced import costs from Asian suppliers. Market sentiment weakened as end-user consumption remained subdued due to slower downstream industrial activity. Ample availability in European warehouses and favorable shipping conditions further pressured prices. However, limited domestic production capacity created reliance on imports, preventing more severe price drops. The market remained competitive, with buyers negotiating aggressively for long-term contracts, reflecting a bearish yet stable price environment.
During the second quarter of 2025, the H acid prices in India reached 5120 USD/MT in June. H acid prices in India saw moderate declines due to weak demand from the dyes and pigments industry and stable raw material costs. Export volumes to Europe and the Middle East softened as overseas buyers maintained cautious procurement amid high inventory levels. Local market activity was limited by muted textile sector orders, especially from smaller manufacturers. However, stable production rates and balanced supply helped avoid sharp price drops. Overall, the quarter reflected a steady yet bearish sentiment in the Indian H acid market.
Regional Coverage
The report provides a detailed analysis of the market across different regions, each with unique pricing dynamics influenced by localized market conditions, supply chain intricacies, and geopolitical factors. This includes price trends, price forecast, and supply and demand trends for each region, along with spot prices by major ports. The report also provides coverage of FOB and CIF prices and the key factors influencing H acid prices.
Europe H Acid Price Trend
Q2 2026:
The H acid price index in Europe increased sharply as constrained import availability, elevated replacement costs, and steady demand from dye and specialty chemical industries strengthened market quotations. European buyers remained dependent on external suppliers, particularly Asian producers, making regional prices sensitive to production conditions and export availability in major manufacturing centers. Higher feedstock, processing, energy, and environmental compliance costs at origin translated into stronger import offers. Germany and Belgium experienced significant upward pressure as distributors sought sufficient material to meet downstream requirements. Freight expenses, logistics delays, and longer replenishment schedules further increased procurement costs.
Q1 2026:
The H acid price index in Europe showed a steady upward trend supported by controlled supply and firm demand from dye and pigment industries. Import availability remained consistent, ensuring balanced supply conditions across the region. At the same time, consumption from the textile and specialty chemical sectors remained stable, supporting market activity. Regulatory compliance and environmental standards influenced production levels, limiting excess supply. Buyers maintained cautious procurement strategies, ensuring adequate inventory without aggressive stocking.
Q3 2025:
During the third quarter of 2025, the H acid price index in Europe reflected a firm upward trend, supported by structurally strong demand from textile manufacturing, pigment production, and specialty chemical applications. Downstream industries maintained steady procurement levels, particularly in Western Europe, where demand resilience remained evident. Supply availability stayed restricted as producers continued disciplined operating strategies, while regulatory compliance requirements limited output flexibility.
Q2 2025:
Europe’s H acid market witnessed stable to slightly firm pricing, driven by steady demand from the textile finishing sector. The region remained highly import-dependent, sourcing primarily from Asian producers. Improved supply chain efficiency and reduced shipping delays supported smoother market operations. Currency fluctuations between the Euro and the US Dollar had a mild impact on import costs. Buyers maintained consistent order volumes, while competitive supplier activity helped cap sharp price increases. Environmental regulations continued to shape procurement strategies, favoring reliable, compliant suppliers.
This analysis can be extended to include detailed H acid price information for a comprehensive list of countries.
| Region | Countries Covered |
|---|---|
| Europe | Germany, France, United Kingdom, Italy, Spain, Russia, Turkey, Netherlands, Poland, Sweden, Belgium, Austria, Ireland, Switzerland, Norway, Denmark, Romania, Finland, Czech Republic, Portugal, and Greece, among other European countries. |
North America H Acid Price Trend
Q2 2026:
The H acid price index in North America increased sharply as import dependence, restricted overseas availability, and firm demand from dyes, pigments, and specialty chemical applications supported stronger market quotations. Domestic buyers remained exposed to international production conditions because substantial requirements were met through external sourcing. Higher raw material and processing expenses among major producing countries translated into increased replacement costs for importers. Freight, transportation, and distribution expenses added further pressure to delivered material prices. Downstream manufacturers maintained procurement to ensure continuous availability of dye intermediates for industrial production. Tighter export supply from Asian producers reduced spot flexibility and strengthened supplier negotiating positions.
Q1 2026:
The H acid price index in North America reflected moderate growth driven by steady demand from textile and dye manufacturing sectors. Domestic production remained stable, while import flows ensured sufficient supply availability. Consumption levels remained consistent, supporting ongoing market activity. Buyers adopted balanced procurement strategies, avoiding excess inventory buildup. Additionally, firm processing and logistics costs contributed to upward pricing pressure. Market sentiment remained positive, with stable demand and controlled supply supporting gradual price increases throughout the quarter.
Q3 2025:
During the third quarter of 2025, the H acid price index in North America showed positive movement, driven by consistent downstream demand and cautious supply management. Textile dyes and specialty chemical segments continued to support stable consumption patterns. Producers maintained balanced inventory positions, preventing excess supply while ensuring market stability. Elevated operating and compliance-related expenses encouraged suppliers to hold firm pricing positions. Procurement activity remained steady as buyers planned purchases strategically rather than engaging in aggressive spot buying.
Q2 2025:
The North American H acid markets saw steady pricing, largely supported by consistent imports from Asia. Domestic production remained limited, making the region reliant on overseas suppliers, particularly India. Demand from the textile and specialty dye industries stayed firm, maintaining a balanced market environment. Stable freight rates and adequate inventories helped prevent volatility. However, competition from alternative dyes restrained aggressive price gains. Buyers adopted a cautious procurement approach, aligning purchases closely with actual consumption needs to manage costs and inventory levels effectively.
Specific H acid historical data within the United States and Canada can also be provided.
| Region | Countries Covered |
|---|---|
| North America | United States and Canada |
Middle East and Africa H Acid Price Trend
Q2 2026:
The H acid price chart shows that supply chain disruptions, seasonal changes in demand, and geopolitical pressures were the primary reasons of price volatility throughout the Middle East and Africa.
Q1 2026:
According to the H acid price chart, supply chain interruptions, seasonal changes in demand, and geopolitical influences were the main causes of the price fluctuations in the Middle East and Africa.
Q3 2025:
As per the H acid price chart, the prices in the Middle East and Africa fluctuated due to a complex interplay of factors, primarily driven by supply chain disruptions, seasonal demand shifts, and geopolitical influences.
Q2 2025:
The report explores the H acid trends and H acid price chart in the Middle East and Africa, considering factors like regional industrial growth, the availability of natural resources, and geopolitical tensions that uniquely influence market prices.
In addition to region-wise data, information on H acid prices for countries can also be provided.
| Region | Countries Covered |
|---|---|
| Middle East & Africa | Saudi Arabia, UAE, Israel, Iran, South Africa, Nigeria, Oman, Kuwait, Qatar, Iraq, Egypt, Algeria, and Morocco, among other Middle Eastern and African countries. |
Asia Pacific H Acid Price Trend
Q2 2026:
The H acid prices across Asia Pacific increased sharply as strong dye industry demand, higher raw material expenses, and tightening supply availability supported substantial price gains. China and India remained major production and consumption centers, with textile dye and pigment manufacturers maintaining active procurement throughout the quarter. Rising costs for naphthalene based intermediates, acids, alkalis, energy, and processing increased manufacturing expenses and encouraged producers to maintain substantially stronger quotations. Environmental compliance and wastewater treatment requirements added further cost pressure for dye intermediate manufacturers. Export inquiries absorbed available production and reduced spot flexibility within key supplying markets. Producers managed operating schedules and inventories cautiously amid stronger downstream requirements.
Q1 2026:
In the Asia Pacific region, H acid prices showed moderate growth driven by strong demand from the textile and dye manufacturing sectors. Production levels remained controlled due to regulatory measures, ensuring balanced supply conditions. Export demand supported market activity, contributing to tighter availability in certain markets. Buyers maintained steady procurement strategies, ensuring consistent consumption. Additionally, firm feedstock and operational costs supported price increases.
Q3 2025:
H acid prices in the Asia Pacific region experienced a downward trend, primarily due to ample supply availability and subdued procurement activity across key markets. Producers in major manufacturing hubs continued operating at steady rates, resulting in sufficient material presence in the market. At the same time, downstream demand from textile and dye sectors weakened, prompting buyers to delay purchases and negotiate lower offers. Competitive export pricing further intensified market pressure, as suppliers sought to clear inventories amid limited overseas inquiries.
Q2 2025:
The Asia Pacific H acid market experienced moderate price stability, supported by steady demand from the textile dyeing and leather processing sectors. Major producers in countries like India and China maintained consistent output, with sufficient raw material availability preventing supply constraints. Export activity remained firm, particularly to Europe and North America, aiding price resilience. However, competition among regional suppliers kept sharp upward movements in check. The market was further influenced by stable energy costs and relatively balanced supply-demand dynamics across major consumption hubs.
This H acid price analysis can be expanded to include a comprehensive list of countries within the region.
| Region | Countries Covered |
|---|---|
| Asia Pacific | China, India, Indonesia, Pakistan, Bangladesh, Japan, Philippines, Vietnam, Thailand, South Korea, Malaysia, Nepal, Taiwan, Sri Lanka, Hongkong, Singapore, Australia, and New Zealand, among other Asian countries. |
Latin America H Acid Price Trend
Q2 2026:
The market for H acid in Latin America is primarily driven by the region's vast natural resources, particularly in Chile and Brazil. However, political instability and varying regulatory regimes may cause considerable fluctuations in the price of H acid.
Q1 2026:
The market for H acid in Latin America is primarily driven by the region's abundant natural resources, especially in nations like Chile and Brazil. However, the price of H acid might fluctuate significantly due to political unpredictability and varied regulatory regimes.
Q3 2025:
Latin America's H acid market is predominantly influenced by its rich natural reserves, particularly in countries like Chile and Brazil. However, political instability and inconsistent regulatory frameworks can lead to significant volatility in H acid prices.
Q2 2025:
Infrastructure challenges and logistical inefficiencies often impact the supply chain, affecting the region's ability to meet international demand consistently. Moreover, the H acid price index, economic fluctuations, and currency devaluation are critical factors that need to be considered when analyzing H acid pricing trends in this region.
This comprehensive review can be extended to include specific countries within the region.
| Region | Countries Covered |
|---|---|
| Latin America | Brazil, Mexico, Argentina, Columbia, Chile, Ecuador, and Peru, among other Latin American countries. |
H Acid Pricing Report, Market Analysis, and News
IMARC's latest publication, “H Acid Prices, Trend, Chart, Demand, Market Analysis, News, Historical and Forecast Data Report 2026 Edition,” provides an in-depth analysis of the H acid market dynamics. This report examines spot price variations at major ports and explores price compositions, including FOB and CIF terms. Detailed H acid price trend analysis by region highlights global shifts across North America, Europe, Asia Pacific, Latin America, and Middle East and Africa. The factors affecting H acid pricing, such as supply-demand dynamics, geopolitical influences, and sector-specific developments, are rigorously evaluated. This comprehensive report equips stakeholders with the latest market news, regulatory updates, and technological advancements, aiding in informed strategic decision-making and forecasting.
H Acid Industry Analysis
The global H acid market size reached 234.5 Thousand Tons in 2025. By 2034, IMARC Group expects the market to reach 321.6 Thousand Tons, at a projected CAGR of 3.57% during 2026-2034. The market is primarily driven by the steady demand from textile dyes, pigments, and specialty chemical applications, industrial expansion, export-oriented production, and increasing consumption in developing economies.
Latest News and Developments:
- October 2025: Bhageria Industries Limited revealed plans to increase its H acid production at the Tarapur plant from 400 MT per month to 500 MT per month. The expansion, financed through internal resources with an investment of INR 5 Crore, was anticipated to be completed within six months.
Product Description
H acid is an aromatic organic chemical intermediate widely used in the manufacture of dyes and pigments. Its chemical name is 4 amino 5 hydroxynaphthalene 2 7 disulfonic acid, and its molecular formula is C10H9NO7S2. The compound contains a naphthalene structure with amino, hydroxyl, and sulfonic acid functional groups that make it suitable for diazotization and coupling reactions used in colorant production. H acid generally appears as a solid material and is valued for its ability to produce dyes with strong color characteristics and affinity for textile fibers. It is primarily used to manufacture reactive dyes, acid dyes, direct dyes, and other specialty colorants. Major downstream applications include textile dyeing, printing, leather processing, paper coloration, pigments, and specialty chemical formulations. Its demand is closely associated with textile processing and industrial colorant production.
Report Coverage
| Key Attributes | Details |
|---|---|
| Product Name | H Acid |
| Report Features | Exploration of Historical Trends and Market Outlook, Industry Demand, Industry Supply, Gap Analysis, Challenges, H Acid Price Analysis, and Segment-Wise Assessment. |
| Currency/Units | US$ (Data can also be provided in local currency) or Metric Tons |
| Region/Countries Covered | The current coverage includes analysis at the global and regional levels only. Based on your requirements, we can also customize the report and provide specific information for the following countries: Asia Pacific: China, India, Indonesia, Pakistan, Bangladesh, Japan, Philippines, Vietnam, Thailand, South Korea, Malaysia, Nepal, Taiwan, Sri Lanka, Hongkong, Singapore, Australia, and New Zealand Europe: Germany, France, United Kingdom, Italy, Spain, Russia, Turkey, Netherlands, Poland, Sweden, Belgium, Austria, Ireland, Switzerland, Norway, Denmark, Romania, Finland, Czech Republic, Portugal and Greece North America: United States and Canada Latin America: Brazil, Mexico, Argentina, Columbia, Chile, Ecuador, and Peru Middle East & Africa: Saudi Arabia, UAE, Israel, Iran, South Africa, Nigeria, Oman, Kuwait, Qatar, Iraq, Egypt, Algeria, and Morocco The list of countries presented is not exhaustive. Information on additional countries can be provided if required by the client. |
| Information Covered for Key Suppliers |
|
| Customization Scope | The report can be customized as per the requirements of the customer |
| Report Price and Purchase Option |
Plan A: Monthly Updates - Annual Subscription
Plan B: Quarterly Updates - Annual Subscription
Plan C: Biannually Updates - Annual Subscription
|
| Post-Sale Analyst Support | 360-degree analyst support after report delivery |
| Delivery Format | PDF and Excel through email (We can also provide the editable version of the report in PPT/Word format on special request) |
Key Benefits for Stakeholders:
- IMARC’s report presents a detailed analysis of H acid pricing, covering global and regional trends, spot prices at key ports, and a breakdown of Ex Works, FOB, and CIF prices.
- The study examines factors affecting H acid price trend, including raw material costs, supply-demand shifts, geopolitical impacts, and industry developments, offering insights for informed decision-making.
- The competitive landscape review equips stakeholders with crucial insights into the latest market news, regulatory changes, and technological advancements, ensuring a well-rounded, strategic overview for forecasting and planning.
- IMARC offers various subscription options, including monthly, quarterly, and biannual updates, allowing clients to stay informed with the latest market trends, ongoing developments, and comprehensive market insights. The H acid price charts ensure our clients remain at the forefront of the industry.
Need more help?
- Speak to our experienced analysts for insights on the current market scenarios.
- Include additional segments and countries to customize the report as per your requirement.
- Gain an unparalleled competitive advantage in your domain by understanding how to utilize the report and positively impacting your operations and revenue.
- For further assistance, please connect with our analysts.
 Request Customization
 Inquire Before Buying
 Speak to an Analyst
 Request Brochure
Benefits of Customization
- Personalize this research
- Triangulate with your data
- Get data as per your format and definition
- Gain a deeper dive into a specific application, geography, customer, or competitor
- Any level of personalization
Get in Touch With Us
UNITED STATES
Phone: +1-201-971-6302
INDIA
Phone: +91-120-433-0800
UNITED KINGDOM
Phone: +44-753-714-6104
Email: [email protected]
Client Testimonials




.webp)




.webp)













Related Reports

Why Choose Us
IMARC offers trustworthy, data-centric insights into commodity pricing and evolving market trends, enabling businesses to make well-informed decisions in areas such as procurement, strategic planning, and investments. With in-depth knowledge spanning more than 1000 commodities and a vast global presence in over 150 countries, we provide tailored, actionable intelligence designed to meet the specific needs of diverse industries and markets.
1000
+Commodities
150
+Countries Covered
3000
+Clients
20
+Industry

Robust Methodologies & Extensive Resources
IMARC delivers precise commodity pricing insights using proven methodologies and a wealth of data to support strategic decision-making.

Subscription-Based Databases
Our extensive databases provide detailed commodity pricing, import-export trade statistics, and shipment-level tracking for comprehensive market analysis.

Primary Research-Driven Insights
Through direct supplier surveys and expert interviews, we gather real-time market data to enhance pricing accuracy and trend forecasting.

Extensive Secondary Research
We analyze industry reports, trade publications, and market studies to offer tailored intelligence and actionable commodity market insights.
Trusted by 3000+ industry leaders worldwide to drive data-backed decisions. From global manufacturers to government agencies, our clients rely on us for accurate pricing, deep market intelligence, and forward-looking insights.