
Hydraulic Fracturing Market Report by Well Type (Horizontal, Vertical), Fluid Type (Slick Water-based Fluid, Foam-based Fluid, Gelled Oil-based Fluid, and Others), Technology (Plug and Perf, Sliding Sleeve), Application (Shale Gas, Tight Oil, Tight Gas), and Region 2026-2034
Hydraulic Fracturing Market Size:
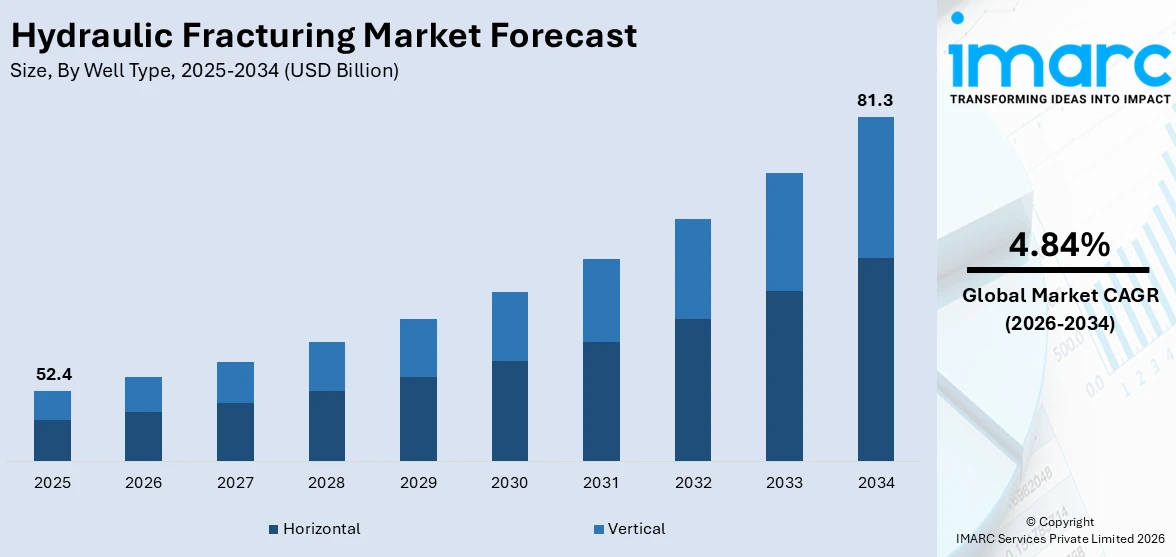
The global hydraulic fracturing market size reached USD 52.4 Billion in 2025. Looking forward, IMARC Group expects the market to reach USD 81.3 Billion by 2034, exhibiting a growth rate (CAGR) of 4.84% during 2026-2034. The market is propelled by the increasing demand for energy and natural gas, significant advancements in hydraulic fracturing technology, rising shale gas production globally, expanding exploration activities in unconventional reserves, growing focus on environmental regulations, and increasing adoption of multi-stage fracturing.
|
Report Attribute
|
Key Statistics
|
|---|---|
|
Base Year
|
2025
|
|
Forecast Years
|
2026-2034
|
|
Historical Years
|
2020-2025
|
|
Market Size in 2025
|
USD 52.4 Billion |
|
Market Forecast in 2034
|
USD 81.3 Billion |
| Market Growth Rate 2026-2034 | 4.84% |
Hydraulic Fracturing Market Analysis:
- Major Market Drivers: Some of the major market drivers include increasing demand for energy and natural gas, significant advancements in hydraulic fracturing technology, rising shale gas production globally, and expanding exploration activities in unconventional reserves.
- Key Market Trends: Increasing focus on environmental regulations and sustainable practices, increasing adoption of multi-stage fracturing, and integration of digital technologies and real-time monitoring are some of the key market trends of the industry.
- Geographical Trends: Abundant shale gas reserves across the region, significant technological advancements in hydraulic fracturing techniques, supportive government policies, and increasing demand for natural gas in power generation and industrial sectors are escalating the North America hydraulic fracturing demand.
- Competitive Landscape: Some of the major market players in the hydraulic fracturing industry include ADNOC Drilling Company PJSC, Baker Hughes Company, Calfrac Well Services Ltd, Halliburton, Liberty Energy, Inc., National Energy Services Reunited Corp., NexTier Completion Solutions, Profrac, ProPetro Services, Inc, SLB, Weatherford, among many others.
- Challenges and Opportunities: Some of the challenges include environmental concerns, regulatory pressures, water scarcity, and public opposition and community concerns. Whereas, expansion into untapped shale reserves, significant technological advancements in fracking fluids and methods, and increasing demand for energy independence, are some of the hydraulic fracturing market recent opportunities.
To get more information on this market Request Sample
Hydraulic Fracturing Market Trends:
Rising Global Energy Demand
The increasing energy demand globally can be attributed to significant factors such as population growth, industrialization, and urbanization, which is further creating a positive hydraulic fracturing market growth. According to the United Nations, the global population was recorded to be 8.0 billion in mid-November 2022. Whereas, the World Bank states that 56% of the global population resides in the urban areas. With the continuous growth in economies, the need for energy, specifically natural gas is majorly increasing. According to the International Energy Association (IEA), with no change in the prevailing policies, the energy demand is expected to increase by 1.3% each year up till 2040. Hydraulic fracturing, or fracking enable the extraction of oil and gas from unconventional reserves such as shale formulations, providing an irreplaceable assistance in meeting the rising energy demands. In line with this, the demand for fracking across the energy sector is rising, as it is a cleaner alternative to coal and oil. Moreover, with the increasing depletion rate of conventional reserves, the importance of hydraulic fracturing is significantly increasing in the global energy landscape.
Increasing Crude Oil Production in Unconventional Reserves
The rise in crude oil production globally, particularly from unconventional reserves, is creating a positive hydraulic fracturing market outlook. According to the United States Energy Information Administration, (EIA), crude oil production in the United States averaged to 12.9 million barrels per day in 2023. With conventional oil fields maturing and their output declining, the industry has increasingly turned to unconventional reserves, such as tight oil and shale oil, which require advanced extraction techniques such as hydraulic fracturing. These reserves are typically found in formations that are not permeable enough to allow oil to flow freely into a well without stimulation. Hydraulic fracturing enables the extraction of these resources by creating fractures in the rock, allowing oil to flow into the wellbore.
Expanding Shale Gas Production Globally
The expansion of shale gas production is creating a favorable hydraulic fracturing market overview. Shale gas has emerged as a vital component of the global energy mix, particularly in regions such as North America, where the shale boom has transformed the energy landscape. According to the United States Energy Information Administration (EIA), shale gas production in the year 2015, accounted for more than half of the natural gas production of the region. Hydraulic fracturing is the primary method used to extract shale gas, and as more countries seek to develop their unconventional gas reserves, the demand for fracturing services has increased. This trend is not limited to the U.S.; other countries, including Canada, China, and Argentina, are also investing heavily in shale gas exploration and production. The global shale gas market is expected to continue expanding as countries aim to reduce their dependence on imported energy and capitalize on their domestic resources, thereby contributing to a positive hydraulic fracturing market revenue.
Hydraulic Fracturing Market Segmentation:
IMARC Group provides an analysis of the key trends in each segment of the market, along with forecasts at the global, regional, and country levels for 2026-2034. Our report has categorized the market based on well type, fluid type, technology, and application.
Breakup by Well Type:
- Horizontal
- Vertical
Horizontal accounts for the majority of the market share
The report has provided a detailed breakup and analysis of the market based on the well type. This includes horizontal and vertical. According to the report, horizontal represented the largest segment.
Horizontal holds the largest hydraulic fracturing market share, due to its ability to maximize resource extraction from unconventional reservoirs, particularly in shale formations. This technique allows for greater contact with the hydrocarbon-rich layers by drilling horizontally after reaching the target depth. It significantly increases the production rate compared to vertical wells, making it more economically efficient. Additionally, horizontal wells reduce surface disruption by requiring fewer well pads, making them more environmentally favorable. As a result, horizontal drilling has become the preferred method in the hydraulic fracturing industry, driving its dominance in the market.
Breakup by Fluid Type:
- Slick Water-based Fluid
- Foam-based Fluid
- Gelled Oil-based Fluid
- Others
Slick water-based fluid holds the largest share of the industry
A detailed breakup and analysis of the market based on the fluid type have also been provided in the report. This includes slick water-based fluid, foam-based fluid, gelled oil-based fluid, and others. According to the report, slick water-based fluid accounted for the largest market share.
Slick water-based fluid is the largest segment in the hydraulic fracturing market by fluid type due to its cost-effectiveness and efficiency in creating fractures in shale formations. It is composed mainly of water mixed with a small percentage of chemical additives, which reduce friction and allow for high-pressure pumping. This type of fluid is particularly effective in shale gas extraction, where long horizontal wells are common. Its lower viscosity compared to other fluids allows for faster pumping and better proppant placement, making it a preferred choice in the industry, especially in large-scale operations.
Breakup by Technology:
- Plug and Perf
- Sliding Sleeve
Plug and perf represents the leading market segment
The report has provided a detailed breakup and analysis of the market based on technology. This includes plug and perf and sliding sleeve. According to the report, plug and perf represented the largest segment.
Plug and perf is the largest segment in the market breakup by technology due to its proven efficiency and adaptability in various shale formations. This method allows for precise targeting of specific zones within a well, maximizing hydrocarbon recovery and minimizing operational costs. Its dominance is reinforced by hydraulic fracturing market recent developments, which have focused on enhancing the efficiency and reliability of this technique. Additionally, the widespread adoption of horizontal drilling has further solidified the position of plug and perf as the preferred method in the industry, driving its growth within the global hydraulic fracturing market.
Breakup by Application:
Access the comprehensive market breakdown Request Sample
- Shale Gas
- Tight Oil
- Tight Gas
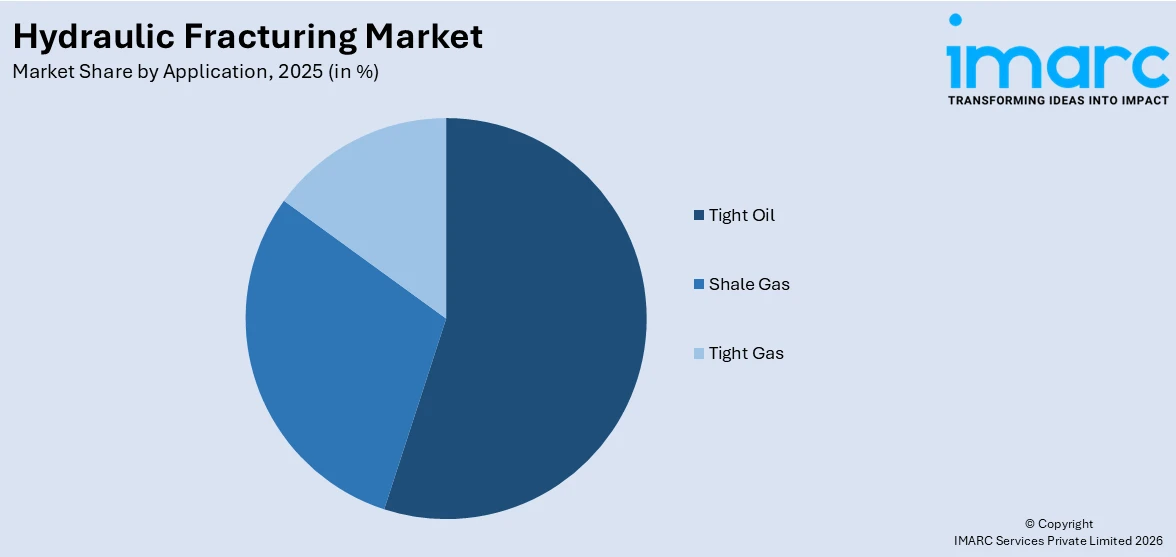
Tight oil exhibits a clear dominance in the market
A detailed breakup and analysis of the market based on the application have also been provided in the hydraulic fracturing market report. This includes shale gas, tight oil, tight gas. According to the report, tight oil accounted for the largest market share.
Tight oil is the largest segment in the market breakup by application due to its significant presence in unconventional oil reserves and the widespread adoption of hydraulic fracturing techniques to extract it. Tight oil, found in low-permeability rock formations, requires advanced fracking methods to release the trapped oil, making it a key driver in the hydraulic fracturing market. The vast resources of tight oil, particularly in regions such as North America, combined with the high demand for crude oil, contribute to its dominance in the market, as producers increasingly turn to these reserves to meet global energy needs.
Breakup by Region:
- North America
- United States
- Canada
- Asia-Pacific
- China
- Japan
- India
- South Korea
- Australia
- Indonesia
- Others
- Europe
- Germany
- France
- United Kingdom
- Italy
- Spain
- Russia
- Others
- Latin America
- Brazil
- Mexico
- Others
- Middle East and Africa
North America leads the market, accounting for the largest hydraulic fracturing market share
The report has also provided a comprehensive analysis of all the major regional markets, which include North America (the United States and Canada); Europe (Germany, France, the United Kingdom, Italy, Spain, Russia, and others); Asia Pacific (China, Japan, India, South Korea, Australia, Indonesia, and others); Latin America (Brazil, Mexico, and others); and the Middle East and Africa. According to the report, North America was the largest regional market for hydraulic fracturing.
North America is the largest segment in the hydraulic fracturing market by region due to its vast shale reserves, particularly in the United States and Canada. The U.S. shale boom has significantly increased oil and gas production, driven by advanced hydraulic fracturing techniques. Additionally, the region benefits from well-established infrastructure, favorable government policies, and significant investments in research and development. The presence of major oil and gas companies and technological innovations further solidify the dominance of North America in the market. The ongoing focus of the region on energy independence and increasing exploration activities contribute to its leading position.
Competitive Landscape:
Key players in the hydraulic fracturing market are actively investing in technological advancements, such as multi-stage fracturing and real-time monitoring systems, to enhance extraction efficiency and reduce environmental impact. Companies are also expanding their operations into new shale reserves globally, particularly in North America, to capitalize on the growing demand for energy. According to the hydraulic fracturing market forecast, strategic partnerships, mergers, and acquisitions are being pursued to strengthen market positions and drive innovation. These efforts are pivotal in shaping the market, which anticipates continued growth driven by the need for efficient energy extraction from unconventional resources.
The report provides a comprehensive analysis of the competitive landscape in the global hydraulic fracturing market with detailed profiles of all major companies, including:
- ADNOC Drilling Company PJSC
- Baker Hughes Company
- Calfrac Well Services Ltd
- Halliburton
- Liberty Energy, Inc.
- National Energy Services Reunited Corp.
- NexTier Completion Solutions
- Profrac
- ProPetro Services, Inc
- SLB
- Weatherford
Hydraulic Fracturing Market News:
- From 4-6 February 2025, there will be hydraulic fracturing innovation at the upcoming 2025 SPE Hydraulic Fracturing Technology Conference and Exhibition in The Woodlands, Texas, USA. This highly anticipated event will convene industry pioneers from around the world to explore groundbreaking developments and best practices in hydraulic fracturing.
Hydraulic Fracturing Market Report Scope:
| Report Features | Details |
|---|---|
| Base Year of the Analysis | 2025 |
| Historical Period | 2020-2025 |
| Forecast Period | 2026-2034 |
| Units | Billion USD |
| Scope of the Report | Exploration of Historical Trends and Market Outlook, Industry Catalysts and Challenges, Segment-Wise Historical and Future Market Assessment:
|
| Well Types Covered | Horizontal, Vertical |
| Fluid Types Covered | Slick Water-Based Fluid, Foam-Based Fluid, Gelled Oil-Based Fluid, Others |
| Technologies Covered | Plug and Perf, Sliding Sleeve |
| Applications Covered | Shale Gas, Tight Oil, Tight Gas |
| Regions Covered | Asia Pacific, Europe, North America, Latin America, Middle East and Africa |
| Countries Covered | United States, Canada, Germany, France, United Kingdom, Italy, Spain, Russia, China, Japan, India, South Korea, Australia, Indonesia, Brazil, Mexico |
| Companies Covered | ADNOC Drilling Company PJSC, Baker Hughes Company, Calfrac Well Services Ltd, Halliburton, Liberty Energy, Inc., National Energy Services Reunited Corp., NexTier Completion Solutions, Profrac, ProPetro Services, Inc, SLB, Weatherford, etc. |
| Customization Scope | 10% Free Customization |
| Post-Sale Analyst Support | 10-12 Weeks |
| Delivery Format | PDF and Excel through Email (We can also provide the editable version of the report in PPT/Word format on special request) |
Key Benefits for Stakeholders:
- IMARC’s industry report offers a comprehensive quantitative analysis of various market segments, historical and current market trends, market forecasts, and dynamics of the hydraulic fracturing market from 2020-2034.
- The research report provides the latest information on the market drivers, challenges, and opportunities in the global hydraulic fracturing market.
- The study maps the leading, as well as the fastest-growing, regional markets. It further enables stakeholders to identify the key country-level markets within each region.
- Porter's five forces analysis assists stakeholders in assessing the impact of new entrants, competitive rivalry, supplier power, buyer power, and the threat of substitution. It helps stakeholders to analyze the level of competition within the hydraulic fracturing industry and its attractiveness.
- The competitive landscape allows stakeholders to understand their competitive environment and provides insight into the current positions of key players in the market.
Frequently Asked Questions About the Hydraulic Fracturing Market Report
The global hydraulic fracturing market was valued at USD 52.4 Billion in 2025.
We expect the global hydraulic fracturing market to exhibit a CAGR of 4.84% during 2026-2034.
The rising number of onshore and offshore oil and gas exploration activities, along with the growing adoption of hydraulic fracturing exploring highly impermeable shale reservoirs and optimizing oil production, is primarily driving the global hydraulic fracturing market.
The sudden outbreak of the COVID-19 pandemic had led to the implementation of stringent lockdown regulations across several nations, resulting in the temporary closure of numerous manufacturing units for hydraulic fracturing.
Based on the well type, the global hydraulic fracturing market has been segmented into horizontal and vertical. Currently, horizontal holds the majority of the total market share.
Based on the fluid type, the global hydraulic fracturing market can be divided into slick water-based fluid, foam-based fluid, gelled oil-based fluid, and others. Among these, slick water-based fluid currently exhibits a clear dominance in the market.
Based on the technology, the global hydraulic fracturing market has been categorized into plug and perf and sliding sleeve, where plug and perf accounts for the majority of the global market share.
Based on the application, the global hydraulic fracturing market can be segregated into shale gas, tight oil, and tight gas. Currently, tight oil holds the largest market share.
On a regional level, the market has been classified into North America, Asia-Pacific, Europe, Latin America, and Middle East and Africa, where North America currently dominates the global market.
Some of the major players in the global hydraulic fracturing market include ADNOC Drilling Company PJSC, Baker Hughes Company, Calfrac Well Services Ltd, Halliburton, Liberty Energy, Inc., National Energy Services Reunited Corp., NexTier Completion Solutions, Profrac, ProPetro Services, Inc, SLB, and Weatherford.
Need more help?
- Speak to our experienced analysts for insights on the current market scenarios.
- Include additional segments and countries to customize the report as per your requirement.
- Gain an unparalleled competitive advantage in your domain by understanding how to utilize the report and positively impacting your operations and revenue.
- For further assistance, please connect with our analysts.
 Request Customization
 Speak to an Analyst
 Request Brochure
 Inquire Before Buying
Benefits of Customization
- Personalize this research
- Triangulate with your data
- Get data as per your format and definition
- Gain a deeper dive into a specific application, geography, customer, or competitor
- Any level of personalization
Get in Touch With Us
UNITED STATES
Phone: +1-201-971-6302
INDIA
Phone: +91-120-433-0800
UNITED KINGDOM
Phone: +44-753-714-6104
Email: [email protected]
Client Testimonials


.webp)


