
Imaging Chemicals Market Report by Product Type (Imaging Agents and Toners, Printing Inks, Image Developers, and Others), Application (Medical, Packaging and Printing, Textile, Mining, and Others), and Region 2026-2034
Market Overview:
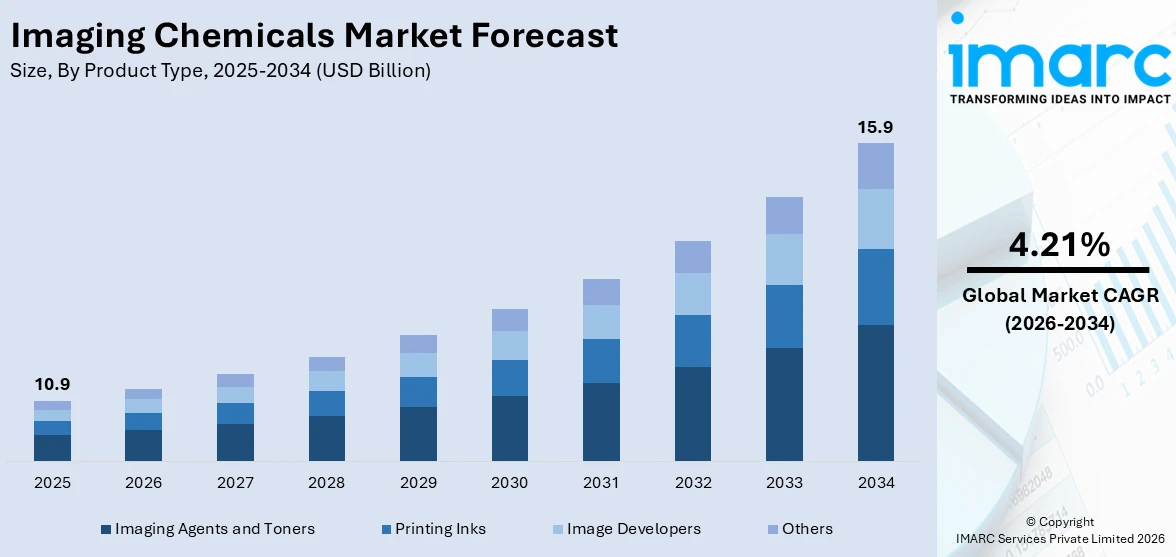
The global imaging chemicals market size reached USD 10.9 Billion in 2025. Looking forward, IMARC Group expects the market to reach USD 15.9 Billion by 2034, exhibiting a growth rate (CAGR) of 4.21% during 2026-2034. The growing advancements in nanotechnology, rising adoption of medical imaging in hospitals, nursing homes, and clinics, and increasing demand for printers in educational institutions, medical centers, and shopping malls are some of the major factors propelling the market.
|
Report Attribute
|
Key Statistics
|
|---|---|
|
Base Year
|
2025
|
|
Forecast Years
|
2026-2034
|
|
Historical Years
|
2020-2025
|
| Market Size in 2025 | USD 10.9 Billion |
| Market Forecast in 2034 | USD 15.9 Billion |
| Market Growth Rate 2026-2034 | 4.21% |
Imaging chemicals refer to a class of substances used in various imaging techniques to enhance or produce visual representations of objects, tissues, or processes. They consist of contrast agents, dyes, or radioactive isotopes that interact with the target material to generate a distinct signal. They are employed in techniques, such as X-ray, ultrasound, magnetic resonance imaging (MRI), computed tomography (CT), and positron emission tomography (PET). They aid researchers in studying cellular and molecular interactions, investigating disease mechanisms, and developing new therapeutic interventions. They also play a significant role in the field of printing, particularly in traditional photographic processes and modern digital printing technologies.
To get more information on this market Request Sample
At present, the increasing demand for printing chemicals as they offer high quality and spontaneous turnaround time and minimize printing costs for smaller quantities of printing is impelling the growth of the market. Besides this, the rising adoption of digital imaging as an alternative to conventional film-based photography is contributing to the growth of the market. In addition, the growing demand for printers in educational institutions, offices, hospitals, and malls for printing various essential documents, receipts, and flyers is offering a favorable market outlook. Apart from this, the increasing availability of eco-friendly imaging chemicals with reduced environmental impact made from eco-friendly solvents is supporting the growth of the market. Additionally, the rising utilization of film-based photography by professional photographers is bolstering the growth of the market.
Imaging Chemicals Market Trends/Drivers:
Rising advancements in nanotechnology
Nanotechnology bridges multiple disciplines, including physics, biology, chemistry, engineering, and medicine. This is resulting in a surge of collaborative research across these fields, leading to innovative solutions and breakthroughs. Recognizing the potential of nanotechnology to revolutionize various sectors, governments and private entities worldwide are increasing funding and support for nanotechnology research and development (R&D). Moreover, nanoparticles are engineered to possess specific properties that make them ideal as contrast agents in imaging. They can be functionalized with specific molecules that bind to disease-specific markers and allow for targeted imaging of specific cells or regions in the body, enhancing the accuracy of disease diagnosis. Furthermore, they enable the development of multimodal imaging chemicals.
Increasing adoption of medical imaging applications
The demand for medical imaging is increasing due to the rising occurrence of various chronic diseases along with the growing geriatric population around the world. Besides this, the increasing rate of hospitalization is fueling the demand for medical imaging. Advancements in medical imaging technology are also increasing its capabilities and applications, leading to more widespread usage. Apart from this, a rising shift towards preventive healthcare and early disease detection, coupled with the increasing patient awareness about these services, is resulting in more demand for medical imaging procedures. Medical imaging relies on imaging chemicals to enhance the clarity and accuracy of diagnostic images. Imaging chemicals, through their interaction with the body and imaging technology, provide detailed insights into the condition of a patient, aiding in accurate diagnosis and treatment planning.
Increasing demand for digital printing
Digital printing allows for easy modification and customization of designs, which is especially beneficial for small businesses and personal projects that require unique and personalized prints. It is fast, efficient, and capable of producing high-quality prints in less time than traditional printing methods. Besides this, the quality of digital printing is significantly improving, with advancements in technology offering high-resolution prints that rival traditional methods and the utilization of high-quality imaging chemicals. Moreover, digital printing uses either ink (for inkjet printers) or toners (for laser printers), which are composed of various imaging chemicals. These are formulated to provide optimal image quality, color fidelity, and durability.
Imaging Chemicals Industry Segmentation:
IMARC Group provides an analysis of the key trends in each segment of the global imaging chemicals market report, along with forecasts at the global, regional and country levels from 2026-2034. Our report has categorized the market based on product type and application.
Breakup by Product Type:
- Imaging Agents and Toners
- Printing Inks
- Image Developers
- Others
Imaging agents and toners dominate the market
The report has provided a detailed breakup and analysis of the market based on the product type. This includes imaging agents and toners, printing inks, image developers, and others. According to the report, imaging agents and toners represented the largest segment.
Imaging agents and toners are essential components in the fields of medical imaging and digital printing, each serving unique roles. Imaging agents, also known as contrast agents or contrast media, are substances used to improve the contrast of structures or fluids within the body during medical imaging procedures. They help distinguish or contrast specific areas of the body from the surrounding tissue, enhancing the detail of the images produced. On the other hand, toner is a powder mixture employed in laser printers and photocopiers to produce printed text and images on paper. In its early form, toner is a mix of carbon powder, which gives the black color, and a polymer that helps the toner particles to melt and bind to the paper under heat and pressure.
Breakup by Application:
Access the comprehensive market breakdown Request Sample
- Medical
- Packaging and Printing
- Textile
- Mining
- Others
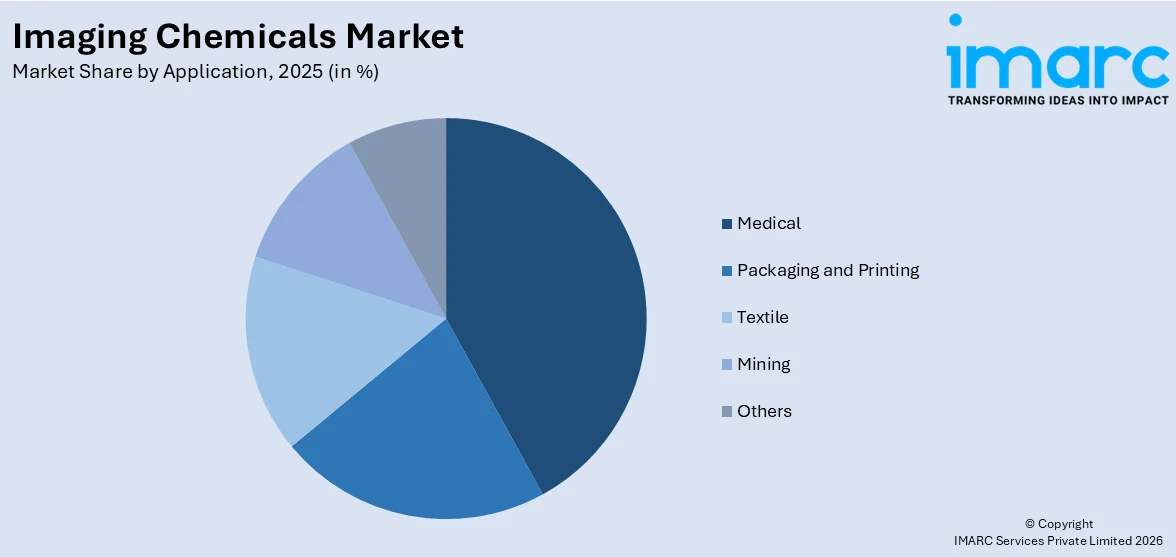
Medical holds the largest share in the market
A detailed breakup and analysis of the market based on the application have also been provided in the report. This includes medical, packaging and printing, textile, mining, and others. According to the report, medical accounted for the largest market share.
In the medical sector, imaging chemicals are fundamental for enhancing diagnostic accuracy and delivering effective treatments. They aid in creating a clearer picture of the internal structures and processes of the human body, thereby playing a crucial role in disease identification and monitoring. They help increase the visibility of blood vessels in CT scans and X-rays, while gadolinium enhances the contrast in MRIs, enabling radiologists to differentiate between healthy and diseased tissues more effectively.
Imaging chemicals are integral to the printing and packaging industry, wherein they play a pivotal role in achieving high-quality prints, vibrant colors, and durable packaging materials. They are used in various stages of the printing and packaging process, offering a range of benefits and functionalities.
Breakup by Region:
- North America
- United States
- Canada
- Asia-Pacific
- China
- Japan
- India
- South Korea
- Australia
- Indonesia
- Others
- Europe
- Germany
- France
- United Kingdom
- Italy
- Spain
- Russia
- Others
- Latin America
- Brazil
- Mexico
- Others
- Middle East and Africa
Asia Pacific exhibits a clear dominance, accounting for the largest imaging chemicals market share
The report has also provided a comprehensive analysis of all the major regional markets, which include North America (the United States and Canada); Asia Pacific (China, Japan, India, South Korea, Australia, Indonesia, and others); Europe (Germany, France, the United Kingdom, Italy, Spain, Russia, and others); Latin America (Brazil, Mexico, and others); and the Middle East and Africa. According to the report, Asia Pacific accounted for the largest market share.
Asia Pacific held the biggest market share due to the rising construction of hospitals, clinics, and nursing homes. Besides this, increasing investments in improving medical imaging techniques for better diagnosis and treatment of diseases are strengthening the growth of the market.
Another contributing aspect is the growing demand for imaging chemicals for printing labels and packaging in various industries. In addition, increasing consumerism and branding are contributing to the growth of the market.
North America is estimated to expand further in this domain due to the rising focus on sustainable packaging to reduce the carbon footprint and minimize wastage. Apart from this, the increasing emergence of e-commerce brands selling products online is propelling the growth of the market.
Competitive Landscape:
Key market players are investing in research and development (R&D) operations to develop innovative and high-performance products. They are also focusing on improving the quality, functionality, and environmental sustainability of their imaging chemicals. Top companies are forming strategic partnerships and collaborations with other companies, research institutions, and industry experts to leverage their expertise, resources, and market reach. They are also establishing local manufacturing facilities, distribution networks, and sales teams to cater to the specific needs and demands of these markets. Leading players are working to diversify their product portfolios to meet the evolving needs of their customers. They are introducing new imaging chemicals, developing application-specific formulations, and expanding their offerings to cover a wide range of printing, packaging, and medical imaging requirements.
The report has provided a comprehensive analysis of the competitive landscape in the market. Detailed profiles of all major companies have also been provided. Some of the key players in the market include:
- Agfa-Gevaert N.V.
- Altana AG
- Becton Dickinson and Company
- DIC Corporation
- Eastman Kodak Company
- Flint Group
- FUJIFILM Holdings Corporation
- Kao Corporation
- T&K TOKA Corporation
- Toray Fine Chemicals Co. Ltd.
- Toyo Ink SC Holdings Co. Ltd.
- Vivimed Labs Limited
Recent Developments:
- In 2023, Eastman Kodak Company sets new standards in inks for inkjet printing with its KODACHROME inks which enable presses using KODAL ULTRASTREAM Continuous Inkjet Technology to acquire the highest levels of color rendition, image stability, and detail.
- In July 2023, Toyo Ink SC Holdings Co. Ltd. announced the development of a silver nanoparticle paste for die-attach applications, which can be sintered at low temperatures under both pleasureless and pressure-assisted methodologies.
- In June 2023, Becton Dickinson and Company announced the launch of the world's first spectral cell sorter with high-speed imaging technology, which segregates cells based on visual characteristics.
Imaging Chemicals Market Report Scope:
| Report Features | Details |
|---|---|
| Base Year of the Analysis | 2025 |
| Historical Period | 2020-2025 |
| Forecast Period | 2026-2034 |
| Units | Billion USD |
| Scope of the Report | Exploration of Historical and Forecast Trends, Industry Catalysts and Challenges, Segment-Wise Historical and Predictive Market Assessment:
|
| Product Types Covered | Imaging Agents and Toners, Printing Inks, Image Developers, Others |
| Applications Covered | Medical, Packaging and Printing, Textile, Mining, Others |
| Regions Covered | Asia Pacific, Europe, North America, Latin America, Middle East and Africa |
| Countries Covered | United States, Canada, Germany, France, United Kingdom, Italy, Spain, Russia, China, Japan, India, South Korea, Australia, Indonesia, Brazil, Mexico |
| Companies Covered | Agfa-Gevaert N.V., Altana AG, Becton Dickinson and Company, DIC Corporation, Eastman Kodak Company, Flint Group, FUJIFILM Holdings Corporation, Kao Corporation, T&K TOKA Corporation, Toray Fine Chemicals Co. Ltd., Toyo Ink SC Holdings Co. Ltd., Vivimed Labs Limited., etc. |
| Customization Scope | 10% Free Customization |
| Post-Sale Analyst Support | 10-12 Weeks |
| Delivery Format | PDF and Excel through Email (We can also provide the editable version of the report in PPT/Word format on special request) |
Key Benefits for Stakeholders:
- IMARC’s report offers a comprehensive quantitative analysis of various market segments, historical and current market trends, market forecasts, and dynamics of the imaging chemicals market from 2020-2034.
- The research study provides the latest information on the market drivers, challenges, and opportunities in the global imaging chemicals market.
- The study maps the leading, as well as the fastest-growing, regional markets. It further enables stakeholders to identify the key country-level markets within each region.
- Porter's five forces analysis assists stakeholders in assessing the impact of new entrants, competitive rivalry, supplier power, buyer power, and the threat of substitution. It helps stakeholders to analyze the level of competition within the imaging chemicals industry and its attractiveness.
- Competitive landscape allows stakeholders to understand their competitive environment and provides an insight into the current positions of key players in the market.
Frequently Asked Questions About the Imaging Chemicals Market Report
The global imaging chemicals market was valued at USD 10.9 Billion in 2025.
We expect the global imaging chemicals market to exhibit a CAGR of 4.21% during 2026-2034.
The rising utilization of imaging chemicals for characterizing isotopic information, tracing elements, and finding organic biomarkers in fossils, is primarily driving the global imaging chemicals market.
The sudden outbreak of the COVID-19 pandemic had led to the implementation of stringent lockdown regulations across several nations resulting in temporary closure of various manufacturing units for imaging chemicals.
Based on the product type, the global imaging chemicals market has been divided into imaging agents and toners, printing inks, image developers, and others. Among these, imaging agents and toners currently exhibit a clear dominance in the market.
Based on the application, the global imaging chemicals market can be categorized into medical, packaging and printing, textile, mining, and others. Currently, the medical sector accounts for the majority of the global market share.
On a regional level, the market has been classified into North America, Asia-Pacific, Europe, Latin America, and Middle East and Africa, where Asia-Pacific currently dominates the global market.
Some of the major players in the global imaging chemicals market include Agfa-Gevaert N.V., Altana AG, Becton Dickinson and Company, DIC Corporation, Eastman Kodak Company, Flint Group, FUJIFILM Holdings Corporation, Kao Corporation, T&K TOKA Corporation, Toray Fine Chemicals Co. Ltd., Toyo Ink SC Holdings Co. Ltd., and Vivimed Labs Limited.
Need more help?
- Speak to our experienced analysts for insights on the current market scenarios.
- Include additional segments and countries to customize the report as per your requirement.
- Gain an unparalleled competitive advantage in your domain by understanding how to utilize the report and positively impacting your operations and revenue.
- For further assistance, please connect with our analysts.
 Request Customization
 Speak to an Analyst
 Request Brochure
 Inquire Before Buying
Benefits of Customization
- Personalize this research
- Triangulate with your data
- Get data as per your format and definition
- Gain a deeper dive into a specific application, geography, customer, or competitor
- Any level of personalization
Get in Touch With Us
UNITED STATES
Phone: +1-201-971-6302
INDIA
Phone: +91-120-433-0800
UNITED KINGDOM
Phone: +44-753-714-6104
Email: [email protected]
Client Testimonials


.webp)


