
India Payment Gateways Market Size, Share, Trends and Forecast by Application, Mode of Interaction, and Region, 2026-2034
India Payment Gateways Market Summary:
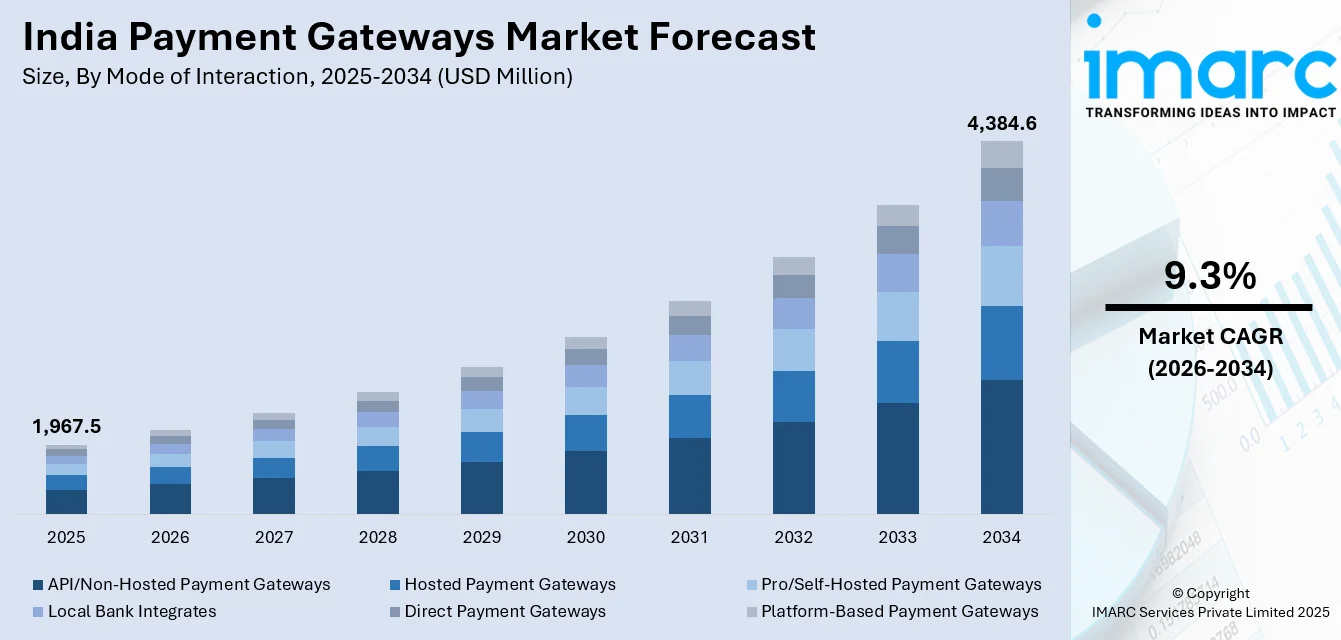
The India payment gateways market size was valued at USD 1,967.5 Million in 2025 and is projected to reach USD 4,384.6 Million by 2034, growing at a compound annual growth rate of 9.3% from 2026-2034.
The India payment gateways market is witnessing robust expansion driven by the rapid digitalization of the economy and the exponential growth of e-commerce platforms across the country. Increasing smartphone penetration, affordable high-speed internet connectivity, and the widespread adoption of the Unified Payments Interface are transforming consumer payment preferences toward digital channels. Supportive government initiatives aimed at promoting a cashless economy, along with evolving regulatory frameworks that enhance transaction security, are reinforcing market momentum. Continuous advancements in financial technology, including the integration of artificial intelligence for fraud prevention and the adoption of cloud-native payment architectures, are further fueling the India payment gateways market share.
Key Takeaways and Insights:
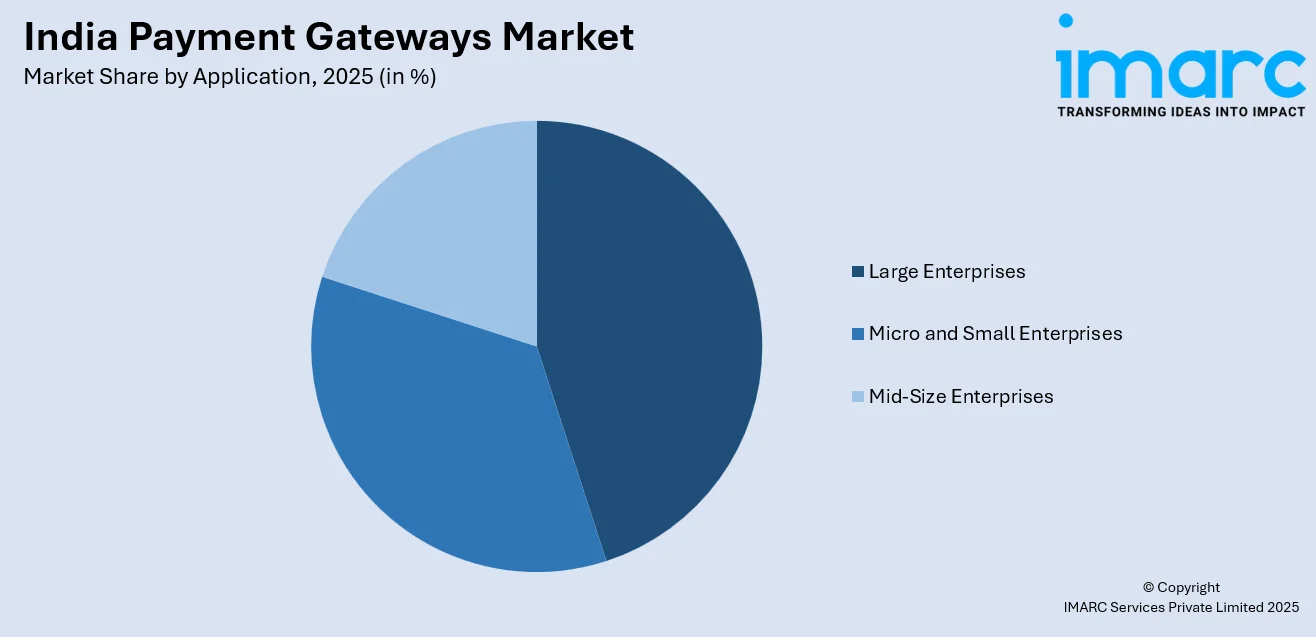
- By Application: Large enterprises dominate the market with a share of 45% in 2025, driven by their capacity to integrate sophisticated, customized payment solutions that support high transaction volumes and complex multi-channel operations.
- By Mode of Interaction: API/non-hosted payment gateways lead the market with a share of 32% in 2025, owing to growing enterprise demand for embedded, developer-friendly payment integrations that enable seamless checkout experiences and real-time settlements.
- By Region: North India represents the largest segment with a market share of 29% in 2025, supported by the concentration of major commercial hubs, extensive digital infrastructure, and strong fintech adoption across metropolitan areas.
- Key Players: The India payment gateways market features a moderately fragmented competitive landscape with established domestic fintech companies and global payment processors competing across enterprise segments. Market participants are focusing on value-added services, AI-driven fraud detection, merchant lending platforms, and cross-border payment capabilities to differentiate their offerings and strengthen market positioning. Some of the major market players include Airpay Payment Services, Cashfree Payments India Private Limited, Easebuzz, Fiserv, Inc., IndiaIdeas.com Limited (BillDesk), Infibeam Avenues Limited, IppoPay Technologies Pvt Ltd, NTT DATA Payment Services, One MobiKwik Systems Limited, One97 Communications Limited (Paytm), PayU, PhonePe, and Razorpay Software Limited.
To get more information on this market Request Sample
The India payment gateways market is undergoing a transformative phase, driven by the convergence of digital public infrastructure, regulatory evolution, and technological innovation. The country's payment ecosystem has matured significantly, underpinned by the Unified Payments Interface, which has become the world's largest retail fast-payment system by transaction volume. For instance, in June 2025, UPI handled over 18.39 billion transactions worth approximately INR 24.03 lakh crore, reflecting its deep penetration across urban and rural markets. The Reserve Bank of India's Digital Payments Index reached 493.22 as of March 2025, indicating sustained digital infrastructure maturity. Payment gateway providers are increasingly embedding value-added services such as merchant analytics, automated reconciliation, and lending capabilities into their platforms, transforming from simple transaction processors into comprehensive financial technology platforms that support the entire merchant lifecycle.
India Payment Gateways Market Trends:
UPI-Driven Payment Ecosystem Expansion
The dominance of the Unified Payments Interface continues to reshape India's payment gateway landscape, with UPI accounting for the majority of digital payment volumes processed through gateway platforms. The system's real-time, interoperable, and cost-effective transaction capabilities are driving integration across e-commerce, retail, and service platforms. For instance, in September 2025, UPI processed over 20 billion transactions worth approximately INR 24.85 lakh crore. The International Monetary Fund recognized UPI as the world's largest retail fast-payment system in its June 2025 report, confirming India's global leadership in instant payments and strengthening the India payment gateways market growth.
AI-Powered Fraud Detection and Security Enhancement
The integration of artificial intelligence and machine learning technologies is transforming payment gateway security protocols, enabling real-time transaction monitoring, behavioral analysis, and predictive fraud prevention. Payment gateway providers are deploying advanced algorithms that analyze transaction patterns to identify anomalies and prevent unauthorized activities before they occur. For instance, in October 2025, India debuted biometric authentication for UPI transactions, with the National Payments Corporation of India demonstrating facial recognition and fingerprint-based payment verification at the Global Fintech Festival in Mumbai after receiving clearance from the Reserve Bank of India. These innovations are enhancing transaction security while reducing friction in the checkout process.
Emergence of Agentic Payments and Embedded Finance
The convergence of artificial intelligence, open banking frameworks, and payment gateway APIs is enabling a new paradigm of embedded and agentic payment solutions that integrate financial services directly into digital platforms and applications. Payment gateway providers are increasingly offering comprehensive financial ecosystems that include instant settlements, automated billing, merchant lending, and subscription management through unified APIs. For instance, in October 2025, Razorpay, NPCI, and OpenAI initiated a pilot project for AI-driven agentic payments on ChatGPT, designed to make digital transactions conversational and context-aware using UPI infrastructure. This trend reflects the evolution of payment gateways from transaction facilitators into full-stack financial technology platforms.
Market Outlook 2026-2034:
The India payment gateways market is poised for sustained expansion over the forecast period, driven by deepening digital penetration, expanding e-commerce ecosystems, and the continued evolution of real-time payment infrastructure. The proliferation of quick commerce, social commerce, and cross-border digital trade is creating unprecedented demand for high-performance payment processing solutions capable of handling surge volumes and instant settlements. Rural market penetration presents significant untapped potential as digital infrastructure development and financial inclusion initiatives expand payment gateway accessibility to semi-urban and rural regions. The market generated a revenue of USD 1,967.5 Million in 2025 and is projected to reach a revenue of USD 4,384.6 Million by 2034, growing at a compound annual growth rate of 9.3% from 2026-2034.
India Payment Gateways Market Report Segmentation:
|
Segment Category |
Leading Segment |
Market Share |
|
Application |
Large Enterprises |
45% |
|
Mode of Interaction |
API/Non-Hosted Payment Gateways |
32% |
|
Region |
North India |
29% |
Application Insights:
Access the comprehensive market breakdown Request Sample
- Large Enterprises
- Micro and Small Enterprises
- Mid-Size Enterprises
Large enterprises dominate with a market share of 45% of the total India payment gateways market in 2025.
Large enterprises command the dominant share of the India payment gateways market owing to their extensive financial resources, high transaction volumes, and sophisticated digital infrastructure requirements. These organizations demand customized payment solutions that offer advanced analytics, multi-currency support, and seamless integration with enterprise resource planning systems. Their need for robust security protocols, regulatory compliance capabilities, and high-volume transaction processing drives substantial investment in premium payment gateway solutions. For instance, in May 2025, PayU received the Reserve Bank of India's final authorization to operate as an online payment aggregator, expanding its capacity to serve large enterprises with compliant, scalable payment processing solutions.
The growing complexity of enterprise payment requirements, including omnichannel payment acceptance, automated reconciliation, and real-time settlement capabilities, continues to reinforce the dominance of this segment. Large enterprises are increasingly adopting API-based payment integrations and payment orchestration platforms to optimize transaction routing across multiple acquirers and payment methods. This strategic approach enables higher approval rates, reduced processing costs, and improved customer checkout experiences across digital and physical commerce channels.
Mode of Interaction Insights:
- Hosted Payment Gateways
- Pro/Self-Hosted Payment Gateways
- API/Non-Hosted Payment Gateways
- Local Bank Integrates
- Direct Payment Gateways
- Platform-Based Payment Gateways
API/Non-hosted payment gateways lead the market with a share of 32% of the total India payment gateways market in 2025.
API-based or non-hosted payment gateways have become the preferred mode of interaction, fueled by growing demand for embedded payment solutions across sectors such as e-commerce, logistics, healthtech, and fintech. These gateways allow developers to integrate payment processing directly into their platforms, offering fully customizable checkout experiences without redirecting customers to external pages. By enabling seamless in-app payment processing through direct API connections, these solutions enhance user convenience, streamline transactions, and provide businesses with greater control over payment workflows and overall customer experience.
The growing adoption of API-based payment integrations reflects broader enterprise trends toward embedded finance and headless commerce architectures. Organizations increasingly prefer API/non-hosted solutions for their flexibility in supporting instant settlements, automated billing, subscription management, and complex payment workflows. The rise of platform-based business models, marketplace ecosystems, and mobile-first commerce strategies continues to drive demand for these developer-centric payment solutions that offer granular control over transaction processing and user experience design.
Regional Insights:
- North India
- West and Central India
- South India
- East India
North India represents the largest share at 29% of the total India payment gateways market in 2025.
North India commands the leading position in the payment gateways market, underpinned by the concentration of major commercial centers, including the National Capital Region, which serves as a hub for both government-backed digital payment initiatives and private sector fintech innovation. The region benefits from extensive digital infrastructure, high internet penetration, and a large base of digitally literate consumers and businesses, driving payment gateway adoption. The National Payments Corporation of India, headquartered in Mumbai but with significant operational presence in New Delhi, has been instrumental in expanding UPI adoption across North Indian states, with Uttar Pradesh accounts for nearly 5.3% of the nation’s total UPI transaction volumes.
The region's diverse economic landscape, encompassing large enterprise hubs, thriving small and medium business ecosystems, and rapidly growing e-commerce penetration, creates sustained demand for varied payment gateway solutions. Government programs promoting digital literacy and financial inclusion in tier-two and tier-three cities across North India are expanding the addressable market for payment gateway providers, while the growing presence of quick commerce and hyperlocal delivery platforms in cities like Delhi, Jaipur, and Lucknow is generating increasing volumes of digital transactions requiring reliable payment processing infrastructure.

Market Dynamics:
Growth Drivers:
Why is the India Payment Gateways Market Growing?
Accelerating E-Commerce and Quick Commerce Expansion
The explosive growth of India's e-commerce and quick commerce sectors is generating unprecedented demand for high-performance payment gateway solutions capable of processing massive transaction volumes, supporting multiple payment methods, and enabling instant settlements. The proliferation of online marketplaces, direct-to-consumer brands, and hyperlocal delivery platforms has created a dynamic digital commerce ecosystem that relies heavily on reliable, secure, and fast payment processing infrastructure. The Indian e-commerce industry is on an upward trajectory and is expected to become the second-largest e-commerce market globally, creating substantial opportunities for payment gateway providers. The India e-commerce market size was valued at USD 129.72 Billion in 2025 and is projected to reach USD 651.10 Billion by 2034, growing at a compound annual growth rate of 19.63% from 2026-2034. The emergence of quick commerce platforms offering delivery within minutes has further intensified the need for ultra-fast payment processing systems that can handle surge pricing, instant refunds, and real-time inventory reconciliation, pushing payment gateways to develop increasingly sophisticated transaction management capabilities.
Government-Led Digital Payment Promotion and Regulatory Support
Comprehensive government initiatives aimed at fostering a cashless economy are creating a highly favorable environment for payment gateway adoption across all segments of the Indian market. The Digital India program, combined with targeted financial inclusion efforts such as the Pradhan Mantri Jan Dhan Yojana, has dramatically expanded the base of digitally enabled consumers and merchants. As of August 2025, over 55.90 crore Jan Dhan bank accounts have been created, providing direct access to formal banking and digital payment services for previously unbanked populations. The Payments Infrastructure Development Fund has also facilitated the use of acceptance hardware in rural and semi-urban settings, which has helped more merchants to go online. At the same time, the new rules of the Reserve Bank of India concerning payment aggregators are enhancing the level of security and building increased consumer confidence in online payment options within the country.
Technological Innovation in Payment Processing and Security
The India payment gateways market is experiencing a lot of growth due to continuous technology development in payment processing structures, security measures, and value-added services. Artificial intelligence, machine learning, and blockchain technologies are being combined to detect fraud, increase the success rates of transactions, and provide customers with personalised payment experiences. Payment gateway providers are increasingly adopting cloud-native architectures that deliver dynamic scalability for handling peak transaction volumes during festive seasons and flash sales. For instance, in May 2025, Fintech company Cashfree Payments launched a beta version of a software solution that combines large language models (LLMs) with its proprietary APIs, aiming to enhance operational efficiency for merchants. This module allows businesses to streamline payment workflows, automate processes, and leverage advanced AI capabilities within the platform, improving transaction management and overall merchant experience. These innovations are transforming payment gateways from simple transaction processors into comprehensive financial technology platforms offering analytics, lending, and business intelligence services.
Market Restraints:
What Challenges the India Payment Gateways Market is Facing?
Rising Cybersecurity Threats and Data Privacy Concerns
The increasing sophistication of cyber threats, including data breaches, phishing attacks, and identity theft, poses significant challenges to the payment gateway industry. Growing consumer awareness about data privacy and the potential for financial fraud creates hesitancy in adopting digital payment solutions, particularly among first-time users in semi-urban and rural markets. Compliance with evolving data localization requirements and security standards adds operational complexity and cost for payment gateway providers.
Intense Competitive Pressure and Margin Compression
The highly competitive nature of India's payment gateway market, characterized by numerous licensed payment aggregators and aggressive pricing strategies, is creating sustained pressure on transaction margins and profitability. The zero-MDR policy on UPI and RuPay card transactions reduces direct transaction revenue, compelling providers to develop alternative monetization strategies through value-added services and premium feature offerings. This environment particularly challenges smaller market participants with limited resources for innovation.
Infrastructure Gaps and Digital Literacy Limitations
Despite significant progress, inconsistent internet connectivity in rural and remote areas continues to limit the reach of digital payment gateway services across large segments of India's population. Low digital literacy levels among certain demographic groups, combined with deeply entrenched cash usage habits in informal economic sectors, create barriers to payment gateway adoption. The digital infrastructure divide between urban and rural regions restricts uniform market penetration and growth.
Competitive Landscape:
The India payment gateways market features a moderately concentrated competitive landscape where established domestic fintech companies compete alongside global payment processors for market share across enterprise segments. Market participants are differentiating through platform-based strategies that extend beyond basic transaction processing to encompass merchant lending, analytics, automated reconciliation, and cross-border payment orchestration. Competition is intensifying as companies invest in cloud-native infrastructure, AI-powered fraud detection, and developer-friendly API ecosystems to attract merchants across all business sizes. Strategic partnerships, regulatory compliance capabilities, and value-added service portfolios have become critical competitive differentiators, with providers increasingly focusing on vertical-specific solutions for e-commerce, healthcare, education, and financial services sectors to deepen merchant relationships and expand revenue streams.
Some of the major market players include:
- Airpay Payment Services
- Cashfree Payments India Private Limited
- Easebuzz
- Fiserv, Inc.
- IndiaIdeas.com Limited (BillDesk)
- Infibeam Avenues Limited
- IppoPay Technologies Pvt Ltd
- NTT DATA Payment Services
- One MobiKwik Systems Limited
- One97 Communications Limited (Paytm)
- PayU
- PhonePe
- Razorpay Software Limited
Recent Developments:
- In August 2024, Razorpay introduced biometric authentication for its checkout platform, enabling users to verify their identity via biometric data instead of traditional OTPs. The feature improves transaction speed and user experience, particularly in low-connectivity areas, and is automatically enabled for merchants using standard checkout on Android devices.
- In August 2024, PhonePe launched PhonePe PG Bolt, a faster payment gateway solution offering UPI Lite, wallets, and electronic gift vouchers with a one-click, PIN-less checkout process. The solution eliminates the need for redirection to external payment platforms, enhancing the customer payment experience for merchants.
- In August 2024, Zoho introduced Zoho Payments, a comprehensive payment gateway enabling businesses to securely receive payments via UPI. The solution incorporates B2B payment features powered by the Bharat Bill Payment System from NPCI, establishing Zoho Payments as a recognized Bharat Bill Payment Operating Unit.
India Payment Gateways Market Report Coverage:
| Report Features | Details |
|---|---|
| Base Year of the Analysis | 2025 |
| Historical Period | 2020-2025 |
| Forecast Period | 2026-2034 |
| Units | Million USD |
| Scope of the Report |
Exploration of Historical Trends and Market Outlook, Industry Catalysts and Challenges, Segment-Wise Historical and Future Market Assessment:
|
| Applications Covered | Large Enterprises, Micro and Small Enterprises, Mid-Size Enterprises |
| Mode of Interactions Covered | Hosted Payment Gateways, Pro/Self-Hosted Payment Gateways, API/Non-Hosted Payment Gateways, Local Bank Integrates, Direct Payment Gateways, Platform-Based Payment Gateways |
| Region Covered | North India, West and Central India, South India, East India |
| Companies Covered | Airpay Payment Services, Cashfree Payments India Private Limited, Easebuzz, Fiserv, Inc., IndiaIdeas.com Limited (BillDesk), Infibeam Avenues Limited, IppoPay Technologies Pvt Ltd, NTT DATA Payment Services, One MobiKwik Systems Limited, One97 Communications Limited (Paytm), PayU, PhonePe, Razorpay Software Limited, etc. |
| Customization Scope | 10% Free Customization |
| Post-Sale Analyst Support | 10-12 Weeks |
| Delivery Format | PDF and Excel through Email (We can also provide the editable version of the report in PPT/Word format on special request) |
Frequently Asked Questions About the India Payment Gateways Market Report
The India payment gateways market size was valued at USD 1,967.5 Million in 2025.
The India payment gateways market is expected to grow at a compound annual growth rate of 9.3% from 2026-2034 to reach USD 4,384.6 Million by 2034.
Large enterprises represent the largest market share at 45% in 2025, driven by their substantial financial resources, high transaction volumes, sophisticated digital infrastructure needs, and demand for customized, enterprise-grade payment processing solutions with advanced analytics and compliance capabilities.
Key factors driving the India payment gateways market include the rapid expansion of e-commerce and quick commerce platforms, government-led digital payment promotion initiatives, increasing smartphone and internet penetration, UPI ecosystem growth, and continuous technological innovations in AI-powered fraud detection and embedded finance solutions.
Major challenges include rising cybersecurity threats and data privacy concerns, intense competitive pressure causing margin compression, digital infrastructure gaps in rural areas, regulatory compliance complexities, low digital literacy among certain demographics, and deeply entrenched cash usage habits in informal economic sectors.
Need more help?
- Speak to our experienced analysts for insights on the current market scenarios.
- Include additional segments and countries to customize the report as per your requirement.
- Gain an unparalleled competitive advantage in your domain by understanding how to utilize the report and positively impacting your operations and revenue.
- For further assistance, please connect with our analysts.
 Request Customization
 Speak to an Analyst
 Request Brochure
 Inquire Before Buying
Benefits of Customization
- Personalize this research
- Triangulate with your data
- Get data as per your format and definition
- Gain a deeper dive into a specific application, geography, customer, or competitor
- Any level of personalization
Get in Touch With Us
UNITED STATES
Phone: +1-201-971-6302
INDIA
Phone: +91-120-433-0800
UNITED KINGDOM
Phone: +44-753-714-6104
Email: [email protected]
Client Testimonials


.webp)


