
India Plywood Market Size, Share, Trends and Forecast by Sector, Product Type, Application, Consumer Price, Dealer Price, and State, 2026-2034
India Plywood Market Summary:
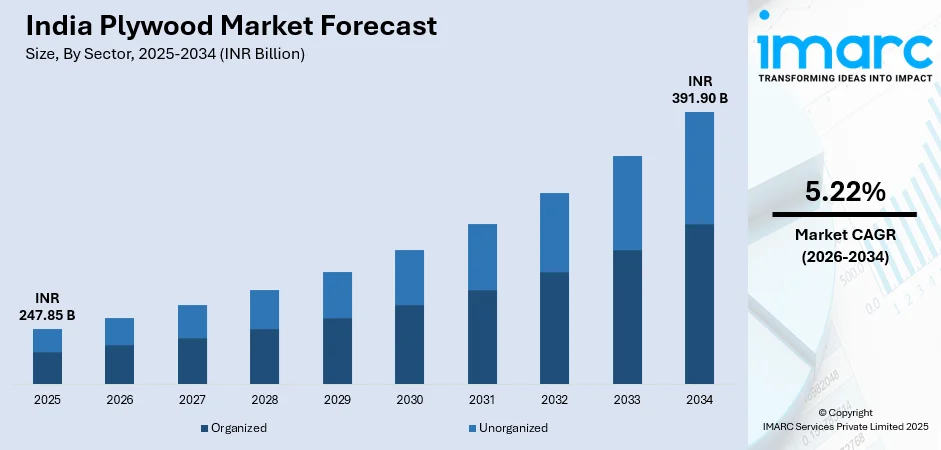
The India plywood market size was valued at INR 247.85 Billion in 2025 and is projected to reach INR 391.90 Billion by 2034, growing at a compound annual growth rate of 5.22% from 2026-2034.
The India plywood market is experiencing robust growth driven by rapid urbanization, expanding residential and commercial construction activities, and rising consumer preference for modern interior furnishings. The organized sector continues to strengthen its market presence through quality standardization, brand building initiatives, and expansion of distribution networks across urban and semi-urban centers. Increasing disposable incomes, changing lifestyle patterns, and government housing schemes are creating substantial demand opportunities for plywood manufacturers nationwide.
Key Takeaways and Insights:
-
By Sector: Organized dominates with a share of 62% in 2025, driven by increasing consumer preference for branded and quality-certified plywood products with standardized specifications and reliable after-sales support.
-
By Product Type: Commercial ply leads the market with a share of 58% in 2025, owing to its widespread application in residential furniture, interior decoration, and general construction purposes across diverse consumer segments.
-
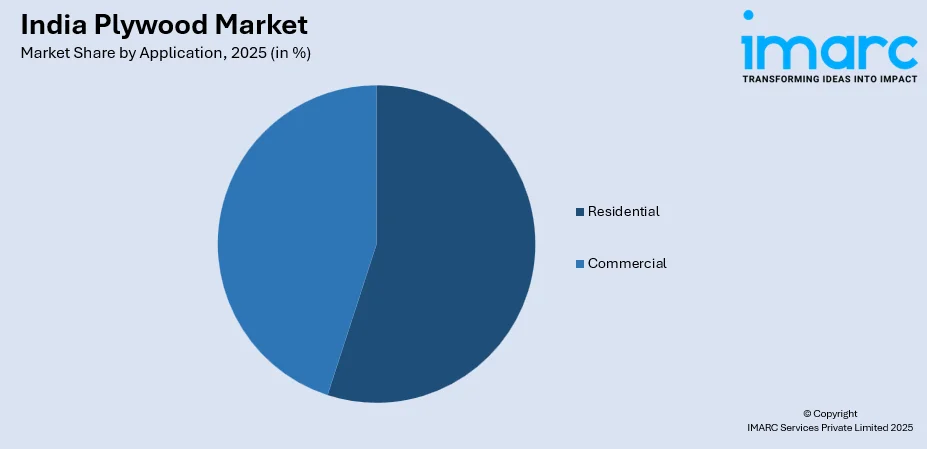
By Application: Residential represent the largest segment with a market share of 55% in 2025, fueled by expanding housing construction, home renovation activities, and growing demand for modern furniture and interior solutions.
-
By Consumer Price: INR 80-94 per Sq. Ft. dominates with a share of 21% in 2025, representing the mid-premium category preferred by quality-conscious consumers seeking balance between affordability and product performance.
-
By Dealer Price: INR 80-94 per Sq. Ft. leads the market with a share of 24% in 2025, reflecting strong dealer margins and sustained demand from retail channels serving residential and small commercial projects.
-
Key Players: The India plywood market demonstrates a competitive landscape characterized by established organized manufacturers competing alongside regional unorganized players. Market participants differentiate through product quality, brand reputation, distribution reach, and pricing strategies. Some of the key players include, Archid Ply, Austin Ply, Century Plywood, Duro Ply, Gattani Plywood, Green Ply, Green Panel, Kajaria Ply, Kit Ply, Merino Industries Limited, Oswin Plywood Prestige Ply, Saburi Ply, Trojan Ply, and Uni Ply.
To get more information on this market Request Sample
The India plywood market is undergoing significant transformation propelled by changing consumer preferences and favorable demographic trends. In 2025, the Government of India introduced mandatory quality control orders (QCO) requiring plywood, MDF boards, and other wooden products to meet defined Indian standards, a move aimed at boosting domestic manufacturing and curbing sub-standard imports. Homeowners and interior designers increasingly prefer premium quality plywood for its durability, aesthetic appeal, and versatility in furniture and construction applications. The expanding middle class coupled with easier access to financing options is enabling broader consumer segments to invest in quality home interiors. Infrastructure development in secondary cities is further extending market reach beyond traditional urban centers. Government initiatives focused on affordable housing and urban development demonstrate policy support toward enhancing construction sector activities across the country.
India Plywood Market Trends:
Shift Toward Organized Sector and Branded Products
The India plywood market is witnessing a significant transition from unorganized to organized sector as consumers increasingly prioritize quality assurance, brand reliability, and warranty-backed products. In December 2025, Greenply Industries announced plans to invest around ₹500 crore to build a new MDF manufacturing plant in India, highlighting organised players’ expansion and regulatory compliance efforts. Rising awareness about product specifications and durability is driving preference for certified plywood from established manufacturers with extensive dealer networks and customer service infrastructure.
Sustainable and Eco-Friendly Plywood Innovations
Environmental consciousness is driving demand for sustainable plywood products manufactured using responsibly sourced timber and low-emission adhesives. In April 2024, Greenply Industries expanded its “Green Rise” plantation drive across four states, planting over 42 million saplings to promote sustainability and reduce reliance on natural forests. Manufacturers are investing in green manufacturing processes and developing eco-friendly variants that meet stringent environmental standards while maintaining structural integrity and aesthetic appeal for environmentally conscious consumers.
Premium Interior Solutions and Design Innovation
Growing consumer aspirations for sophisticated interior designs are driving demand for premium plywood products with enhanced textures, finishes, and decorative laminates. Manufacturers are introducing innovative design solutions including pre-laminated boards, designer veneers, and customized products that cater to evolving aesthetic preferences in residential and commercial interiors. According to 2024-2025 reports, Western India Plywoods Limited launched pre‑veneered plywood under the Kohinoor Luxury Veneer Collection to target high-end furniture and premium interior markets.
Market Outlook 2026-2034:
The India plywood market is expected to witness steady growth over the forecast period, supported by favorable demographic trends, rapid urbanization, and strong construction activity. Rising demand for premium interior solutions, modular furniture, and aesthetically appealing home décor is further strengthening market prospects. Growth in residential housing projects, commercial infrastructure development, and organized furniture manufacturing continues to create significant opportunities. Additionally, increasing disposable incomes and preference for durable, high-quality materials are reinforcing long-term market expansion. The market generated a revenue of INR 247.85 Billion in 2025 and is projected to reach a revenue of INR 391.90 Billion by 2034, growing at a compound annual growth rate of 5.22% from 2026-2034.
India Plywood Market Report Segmentation:
| Segment Category | Leading Segment | Market Share |
|---|---|---|
| Sector | Organized | 62% |
| Product Type | Commercial Ply | 58% |
| Application | Residential | 55% |
| Consumer Price | INR 80-94 per Sq. Ft. | 21% |
| Dealer Price | INR 80-94 per Sq. Ft. | 24% |
Sector Insights:
- Organized
- Unorganized
The organized dominates with a market share of 62% of the total India plywood market in 2025.
The organized plywood sector is solidifying its market dominance by emphasizing standardized quality, expanding dealer networks, and executing strong brand-building strategies. Leading manufacturers are adopting advanced production technologies, obtaining rigorous quality certifications, and rolling out targeted marketing campaigns to attract customers from the unorganized segment. Growing consumer demand for products that come with warranties and maintain consistent quality is further driving the preference for branded plywood, accelerating the transition toward reliable, recognized, and professionally backed solutions in the market.
Growing consumer demand for warranty-backed plywood with uniform quality is driving the market toward branded solutions. The organized sector leverages advanced manufacturing facilities, standardized product grades, and dependable after-sales service, appealing to quality-focused buyers. Strategic marketing initiatives, combined with broader distribution through exclusive stores and multi-brand retail partnerships, allow organized manufacturers to expand their reach across urban, semi-urban, and emerging rural markets, strengthening their presence and gradually capturing market share from unorganized competitors.
Product Type Insights:
- Commercial Ply
- Marine Ply
The commercial ply leads with a share of 58% of the total India plywood market in 2025.
Commercial plywood maintains dominant market position owing to its versatile applications across residential furniture, interior partitions, and general construction purposes. Century Plyboards reported strong Q2 FY26 growth, with rising demand and improved margins across plywood, MDF, and laminates, fueled by robust construction and interior furnishing activity nationwide. The product category offers excellent value proposition with adequate moisture resistance and structural strength suitable for diverse interior applications nationwide.
Rising demand from furniture makers and interior designers is sustaining plywood consumption in urban and semi-urban markets. Commercial plywood remains a preferred choice for cost-conscious buyers and large-scale furniture production due to its affordability compared to marine-grade alternatives. The segment is strengthened by ongoing product innovations, such as superior surface finishes, enhanced durability, and a wider range of thickness options, enabling it to meet the changing requirements of residential and commercial projects while maintaining practicality and value for end-users.
Application Insights:
Access the comprehensive market breakdown Request Sample
- Residential
- Commercial
The residential dominates with a market share of 55% of the total India plywood market in 2025.
The residential segment accounts for the largest share of plywood consumption, fueled by expanding housing construction, home renovation projects, and increasing demand for contemporary furniture designs. Growing nuclear families and rising aspirations for well-designed, comfortable living spaces are creating steady demand for high-quality plywood across India. Consumers are increasingly seeking durable, aesthetically appealing, and reliable products that align with modern interior trends, driving manufacturers to focus on premium offerings tailored to residential applications.
Government initiatives like the Pradhan Mantri Awas Yojana (PMAY), which has already sanctioned over 112 lakh houses and grounded nearly 112.98 lakh homes under its urban component alone as of October 2025, are expanding affordable housing supply across cities and towns, further driving residential construction activity and material demand. Rapid urbanization, rising living standards, and the preference for semi-furnished or fully furnished homes are maintaining strong consumption trends across metropolitan cities and emerging tier-two urban centers, reinforcing plywood’s role as a key material in modern residential construction and interior design.
Consumer Price Insights:
- Less than INR 60 per Sq. Ft.
- INR 60-79 per Sq. Ft.
- INR 80-94 per Sq. Ft.
- INR 95-104 per Sq. Ft.
- INR 105-115 per Sq. Ft.
- Above INR 115 per Sq. Ft.
The INR 80-94 per Sq. Ft leads with a share of 21% of the total India plywood market in 2025.
The mid-premium plywood segment appeals to quality-conscious buyers looking for an ideal balance between cost and performance. It caters to the expanding middle-class population with rising disposable incomes, who seek products offering both durability and attractive finishes without paying a high premium. This category addresses the demand for reliable, aesthetically pleasing plywood solutions suitable for residential and commercial projects, making it a preferred choice for consumers who value long-term performance alongside reasonable affordability.
Rising living standards and consumer willingness to invest in quality home furnishings support sustained demand in this value segment. The price range appeals to first-time homeowners, renovation projects, and furniture manufacturers targeting mid-market consumer segments. Products in this category typically offer certified quality standards, reasonable warranty coverage, and consistent specifications that meet expectations of discerning buyers seeking reliable plywood solutions for residential interiors and furniture applications.
Dealer Price Insights:
- Less than INR 60 per Sq. Ft.
- INR 60-79 per Sq. Ft.
- INR 80-94 per Sq. Ft.
- INR 95-104 per Sq. Ft.
- INR 105-115 per Sq. Ft.
- Above INR 115 per Sq. Ft.
The INR 80-94 per Sq. Ft. dominates with a market share of 24% of the total India plywood market in 2025.
The mid-range dealer price segment offers attractive margins for distributors while keeping products competitively priced for end consumers. This category allows dealers to cater to a wide range of buyers, including residential contractors, furniture manufacturers, and individual customers seeking dependable and quality plywood solutions. By balancing profitability for channel partners with affordability for purchasers, the segment strengthens dealer networks and supports broader market penetration across urban, semi-urban, and emerging rural areas.
Strong dealer engagement and attractive margin structures support extensive distribution penetration across retail networks throughout urban and semi-urban areas. The segment benefits from manufacturer support programs including credit facilities, marketing assistance, and inventory management solutions that strengthen dealer loyalty. Products in this price range typically represent established brands with proven market acceptance, enabling dealers to maintain consistent sales volumes while meeting diverse customer requirements for residential and commercial applications.
States Insights:
- North India
- Delhi NCR
- Uttar Pradesh
- Rajasthan
- Punjab, Haryana, Himachal Pradesh and Jammu & Kashmir
- West and Central India
- Maharashtra and Goa
- Gujarat, Dadra and Nagar Haveli and Daman & Diu
- Madhya Pradesh and Chhattisgarh
- South India
- Tamil Nadu and Puducherry
- Andhra Pradesh
- Kerala and Lakshadweep
- Karnataka
- Telangana
- East India
- West Bengal and Andaman & Nicobar Islands
- Orissa
- Jharkhand
- Bihar
- Northeastern States
North India remains a key market for plywood due to rapid urbanization, residential projects, and rising disposable incomes. Branded plywood is gaining traction as consumers increasingly seek certified, durable, and aesthetically appealing products for housing and commercial projects. Major cities like Delhi, Chandigarh, and Jaipur witness strong demand, prompting manufacturers to expand distribution networks and provide after-sales services. The organized sector is steadily capturing market share from local unbranded suppliers.
In West and Central India, growing construction activity and industrial development are driving plywood consumption. Markets in Maharashtra, Gujarat, and Madhya Pradesh are witnessing heightened interest in premium, branded plywood with standardized quality. The organized sector is strengthening its presence through dealer networks, advertising campaigns, and partnerships with interior designers. Consumers are increasingly prioritizing warranty-backed products over unbranded alternatives, accelerating the shift toward trusted plywood manufacturers.
South India is a mature plywood market characterized by high brand awareness and preference for quality-certified products. States like Karnataka, Tamil Nadu, Andhra Pradesh, and Kerala show strong demand in residential, commercial, and institutional projects. Leading manufacturers are investing in advanced production technologies, marketing initiatives, and extensive dealer networks. Rising consumer preference for durable, moisture-resistant, and termite-proof plywood further reinforces the dominance of organized players over local unbranded producers.
East India is emerging as a promising plywood market with increasing urbanization, infrastructural growth, and industrial projects in West Bengal, Orissa, and Bihar. Consumers are gradually shifting from unbranded, local plywood to standardized, branded offerings that provide consistent quality and warranty. The organized sector is leveraging aggressive marketing, regional distribution expansion, and quality certification to strengthen its position. Rising awareness about durability, aesthetics, and safety continues to support the adoption of branded plywood products.
Market Dynamics:
Growth Drivers:
Why is the India Plywood Market Growing?
Rapid Urbanization and Construction Sector Expansion
India's accelerating urbanization and construction boom represent fundamental drivers for plywood demand growth. Expanding cities, new township developments, and infrastructure projects are creating substantial requirements for construction materials including plywood for interior applications. The India construction materials market size reached USD 114.45 Million in 2024, and it is expected to grow to USD 156.80 Million by 2033, reflecting a CAGR of 3.20% during 2025‑2033. Government affordable housing schemes under Pradhan Mantri Awas Yojana are generating additional demand from residential construction segment. The real estate sector's recovery and expansion across metropolitan and tier-two cities continues to support sustained plywood consumption.
Rising Consumer Affluence and Interior Design Aspirations
Improving disposable incomes and changing lifestyle preferences are driving demand for quality furniture and interior furnishings that utilize plywood as primary material. For example, Spacewood Group, a leading modular furniture manufacturer, announced in November 2025 that it secured ₹300 crore in private equity funding from A91 Partners to expand its manufacturing and retail footprint, reflecting confidence in the growth of quality furniture demand. Growing middle-class population increasingly prioritizes aesthetically appealing and durable home interiors. Nuclear family formations and preference for modern furnished homes are accelerating renovation and home improvement activities. Rising awareness about interior design trends supports demand for premium plywood products with enhanced finishes and textures.
Organized Sector Expansion and Distribution Network Growth
The organized plywood sector is witnessing rapid expansion driven by significant investments in manufacturing capacity, extensive dealer network development, and focused brand-building initiatives. Leading manufacturers are enhancing their distribution presence across urban, semi-urban, and rural markets through a combination of exclusive outlets and multi-brand retail partnerships. Offering quality certifications, warranty programs, and reliable after-sales support, organized players distinguish themselves from unorganized competitors. These efforts resonate with quality-conscious consumers who increasingly prefer branded, dependable plywood solutions, accelerating the shift from unorganized to organized market offerings while reinforcing long-term brand loyalty.
Market Restraints:
What Challenges the India Plywood Market is Facing?
Competition from Unorganized Sector
The unorganized sector continues to present significant competitive challenges through lower pricing and extensive local presence. Small-scale manufacturers and local carpenters offering economical alternatives capture price-sensitive consumer segments. Quality inconsistency and lack of standardization in unorganized products create market confusion among consumers evaluating purchase decisions.
Raw Material Availability and Cost Fluctuations
Timber availability constraints and price volatility impact manufacturing costs and profit margins across the industry. Regulatory restrictions on forest resources and import dependencies create supply chain uncertainties. Rising raw material costs pressure manufacturers to balance quality maintenance with competitive pricing requirements.
Alternative Material Competition
Emerging alternatives including medium-density fiberboard, particleboard, and engineered wood products present competitive challenges to traditional plywood applications. These substitutes offer cost advantages in specific applications and attract price-conscious consumers. Market participants must differentiate through quality positioning and application-specific product development.
Competitive Landscape:
The India plywood market is highly competitive, consisting of national brands, regional producers, and a large number of unorganized players. Organized sector participants are increasingly investing in capacity expansion, product innovation, and distribution network enhancement to consolidate their market positions. Competition is driven by quality differentiation, brand development, strategic pricing, and strong dealer relationships. Companies are launching premium product lines, eco-friendly options, and innovative finishes to align with changing consumer preferences and the growing trend of premiumization. Continuous focus on technological upgrades, sustainability, and customer-centric offerings is helping organized players capture market share from unorganized competitors and strengthen their brand presence.
Some of the key players include:
- Archid Ply
- Austin Ply
- Century Plywood
- Duro Ply
- Gattani Plywood
- Green Ply
- Green Panel
- Kajaria Ply
- Kit Ply
- Merino Industries Limited
- Oswin Plywood Prestige Ply
- Saburi Ply
- Trojan Ply
- Uni Ply
Recent Developments:
-
In August 2025, Wigwam Ply inaugurated India’s largest plywood manufacturing unit in the KIADB Industrial Area, Chamarajanagar, Karnataka, with a 500 CBM/day capacity and over 6.5 lakh sq ft space, aiming to boost production and jobs.
Report Coverage:
| Report Features | Details |
|---|---|
| Base Year of the Analysis | 2025 |
| Historical Period | 2020-2025 |
| Forecast Period | 2026-2034 |
| Units | Billion INR, Billion sq. ft. |
| Scope of the Report | Exploration of Historical and Forecast Trends, Industry Catalysts and Challenges, Segment-Wise Historical and Predictive Market Assessment:
|
| Sectors Covered | Organized, Unorganized |
| Product Types Covered | Commercial Ply, Marine Ply |
| Applications Covered | Residential, Commercial |
| Consumer Prices Covered | Less than INR 60 per Sq. Ft., INR 60-79 per Sq. Ft., INR 80-94 per Sq. Ft., INR 95-104 per Sq. Ft., INR 105-115 per Sq. Ft., Above INR 115 per Sq. Ft. |
| Dealer Prices Covered | Less than INR 60 per Sq. Ft., INR 60-79 per Sq. Ft., INR 80-94 per Sq. Ft., INR 95-104 per Sq. Ft., INR 105-115 per Sq. Ft., Above INR 115 per Sq. Ft. |
| Regions Covered | North India, South India, West and Central India, East India |
| States Covered | Delhi NCR, Uttar Pradesh, Rajasthan, Punjab, Haryana, Himachal Pradesh and Jammu & Kashmir, West and Central India, Maharashtra and Goa, Gujarat, Dadra and Nagar Haveli and Daman & Diu, Madhya Pradesh and Chhattisgarh, South India, Tamil Nadu and Puducherry, Andhra Pradesh, Kerala and Lakshadweep, Karnataka, Telangana, East India, West Bengal and Andaman & Nicobar Islands, Orissa, Jharkhand, Bihar, Northeastern States |
| Companies Covered | Archid Ply, Austin Ply, Century Plywood, Duro Ply, Gattani Plywood, Green Ply, Green Panel, Kajaria Ply, Kit Ply, Merino Industries Limited, Oswin Plywood Prestige Ply, Saburi Ply, Trojan Ply, and Uni Ply. |
| Customization Scope | 10% Free Customization |
| Post-Sale Analyst Support | 10-12 Weeks |
| Delivery Format | PDF and Excel through Email (We can also provide the editable version of the report in PPT/Word format on special request) |
Key Benefits for Stakeholders:
- IMARC’s report offers a comprehensive quantitative analysis of various market segments, historical and current market trends, market forecasts, and dynamics of the India plywood market from 2020-2034.
- The research study provides the latest information on the market drivers, challenges, and opportunities in the India plywood market.
- The study maps the leading, as well as the fastest-growing, regional markets. It further enables stakeholders to identify the key country-level markets within each region.
- Porter's five forces analysis assist stakeholders in assessing the impact of new entrants, competitive rivalry, supplier power, buyer power, and the threat of substitution. It helps stakeholders to analyze the level of competition within the India plywood industry and its attractiveness.
- Competitive landscape allows stakeholders to understand their competitive environment and provides an insight into the current positions of key players in the market.
Frequently Asked Questions About the India Plywood Market Report
The India plywood market size was valued at INR 247.85 Billion in 2025.
The India plywood market is expected to grow at a compound annual growth rate of 5.22% from 2026-2034 to reach INR 391.90 Billion by 2034.
The organized sector dominates the India plywood market with a share of 62%, driven by increasing consumer preference for branded and quality-certified plywood products with standardized specifications.
Key factors driving the India plywood market include rapid urbanization and construction sector expansion, rising consumer affluence and interior design aspirations, organized sector expansion through distribution network growth, and government housing schemes promoting residential construction activities.
Major challenges include competition from the unorganized sector offering lower-priced alternatives, raw material availability constraints and cost fluctuations, and competition from alternative materials such as medium-density fiberboard and particleboard in specific applications.
Need more help?
- Speak to our experienced analysts for insights on the current market scenarios.
- Include additional segments and countries to customize the report as per your requirement.
- Gain an unparalleled competitive advantage in your domain by understanding how to utilize the report and positively impacting your operations and revenue.
- For further assistance, please connect with our analysts.
 Request Customization
 Speak to an Analyst
 Request Brochure
 Inquire Before Buying
Benefits of Customization
- Personalize this research
- Triangulate with your data
- Get data as per your format and definition
- Gain a deeper dive into a specific application, geography, customer, or competitor
- Any level of personalization
Get in Touch With Us
UNITED STATES
Phone: +1-201-971-6302
INDIA
Phone: +91-120-433-0800
UNITED KINGDOM
Phone: +44-753-714-6104
Email: sales@imarcgroup.com
Client Testimonials


.webp)


