
IoT in Transportation Market Size, Share, Trends and Forecast by Type, Mode of Transport, Application, and Region, 2026-2034
IoT in Transportation Market Size and Share:
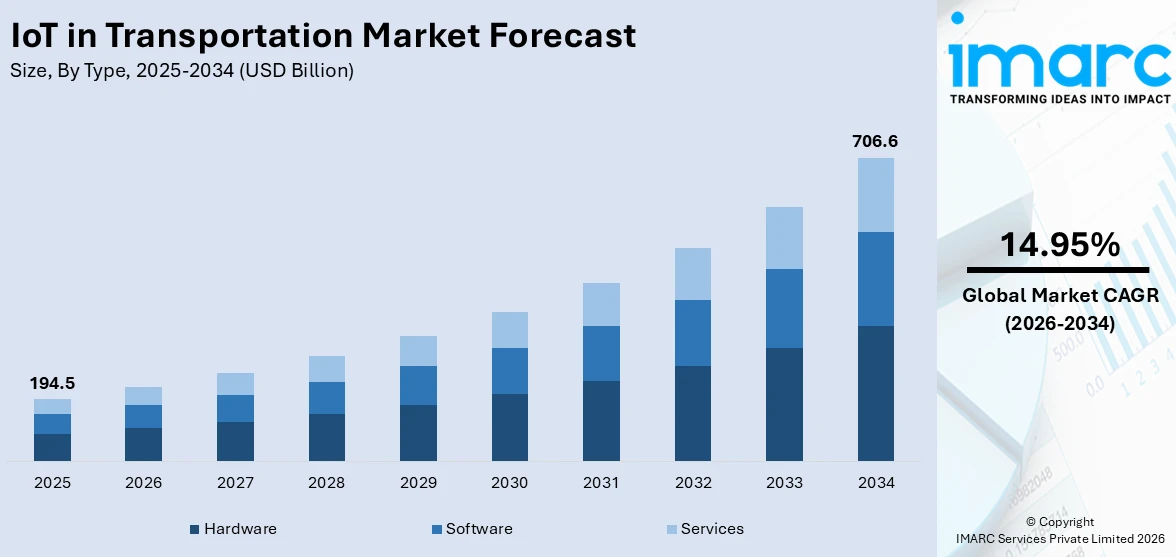
The global IoT in transportation market size was valued at USD 194.5 Billion in 2025. Looking forward, IMARC Group estimates the market to reach USD 706.6 Billion by 2034, exhibiting a CAGR of 14.95% during 2026-2034. North America currently dominates the market, holding a significant market share of over 42.2% in 2025. The market is experiencing rapid growth driven by advancements in smart infrastructure, fleet management and connected vehicles. Key applications include real-time monitoring, predictive maintenance, and autonomous systems. The market is competitive with companies focusing on innovation to address increasing demand for efficiency and safety.
|
Report Attribute
|
Key Statistics
|
|---|---|
|
Base Year
|
2025
|
|
Forecast Years
|
2026-2034
|
|
Historical Years
|
2020-2025
|
|
Market Size in 2025
|
USD 194.5 Billion |
|
Market Forecast in 2034
|
USD 706.6 Billion |
| Market Growth Rate (2026-2034) | 14.95% |
Key drivers in the IoT in transportation market are growing demand for real-time tracking and fleet management which enhance operational efficiency and reduce costs. Advances in connectivity technologies such as 5G and LPWAN will enable better data transmission. Increasing safety regulations and the push for smart cities also accelerate IoT adoption. The rise of autonomous vehicles and the demand for predictive maintenance systems further fuel IoT in transportation market growth by offering enhanced reliability and performance. In line with this, the IoT in transportation market is experiencing rapid innovation with major companies introducing advanced solutions that enhance vehicle management and user experience. For instance, in November 2023, Reliance Retail launched JioMotive an IoT device for cars. This OBD-II tracker offers real-time vehicle tracking, health insights and Wi-Fi capabilities. It features geo-fencing, anti-theft alerts and a user-friendly app for analytics with a one-year warranty.
To get more information on this market Request Sample
Key drivers in the United States IoT in transportation market include the widespread adoption of connected vehicle technologies, which enable real-time data sharing and improved traffic management. The increasing focus on reducing traffic congestion and improving road safety through IoT solutions, such as vehicle-to-everything (V2X) communication, also plays a crucial role. The rising demand for fleet management solutions and advancements in autonomous vehicle development further represent key IoT in transportation market trends in the country. For instance, in October 2024, Jacksonville, Florida, announced the launch of autonomous vehicles using T-Mobile's 5G private network as part of its Ultimate Urban Circulator program. The initiative aims to enhance public transport with real-time communication and telemetry beginning operations by mid-2025 potentially shaping the future of urban mobility and connected transport solutions. Regulatory support and infrastructure investments further stimulate IoT adoption in transportation across the United States.
IoT in Transportation Market Trends:
Integration of AI and ML
Integration of AI and machine learning in IoT systems is changing transportation by improving operational efficiency. AI algorithms analyze real-time data from connected vehicles enabling predictive analytics that forecast maintenance needs preventing expensive breakdowns. Machine learning algorithms optimize routes by analyzing traffic patterns, weather and other variables reducing fuel consumption and improving delivery times. AI enhances vehicle performance by adjusting to real-time conditions while machine learning models continuously improve through data feedback. This combination not only reduces operational costs but also enhances safety and reliability making transportation systems more responsive and efficient. For instance, in January 2025, Tata Motors announced enhancing the vehicle safety by integrating artificial intelligence to address safety before, during and after accidents. The company utilizes machine learning for rapid responses and incorporates advanced driver-assistance systems. Its approach includes optimizations for local conditions ensuring effective safety measures for all road users.
Rising Adoption of Vehicle-to-Everything (V2X) Communication
Vehicle-to-Everything (V2X) communication enables vehicles to exchange data with their surrounding environment including infrastructure, pedestrians, and other vehicles. This technology improves road safety by providing real-time alerts about potential hazards such as pedestrians crossing or nearby vehicles. For instance, in September 2023, Saudi Arabia launched V2X technology in the 5.9 GHz bandwidth to enhance intelligent transport systems and support autonomous vehicles. This initiative aims to improve road safety and communications among drivers, pedestrians, and traffic signals. It aligns with the country’s goals for advanced telecommunications and spectrum management by 2025. V2X also enhances traffic efficiency by enabling smart traffic signals, adjusting traffic flow based on real-time conditions and facilitating platooning for improved fuel efficiency. As V2X adoption accelerates it supports the development of autonomous vehicles, reduces accidents, and helps create smarter more connected transportation networks. It eventually enhances the general driving experience while optimizing urban mobility.
Rise of Electric and Autonomous Vehicles
The rise of electric and autonomous vehicles is accelerating the IoT in transportation market demand. According to industry reports, in 2024, the global electric vehicle market witnessed significant growth with 17.1 million units sold, which represents a 25% increase from the previous year. December alone recorded 1.9 million sales driven by regulatory incentives and emission standards particularly in China where sales surged by 40%, reaching 11 million vehicles. IoT systems enable real-time monitoring of battery health, optimizing charging cycles and ensuring efficient energy usage in electric vehicles. In autonomous vehicles IoT technologies support vehicle-to-vehicle (V2V) communication enhancing safety by enabling cars to share information about road conditions, obstacles, or traffic changes. IoT also plays an important role in fleet management. IoT tracks the location of vehicles, monitors their performance, and informs maintenance requirements. This helps in better resource allocation, reduced downtime, and smooth operation of electric and autonomous fleets. These IoT in transportation market trends are contributing positively to the market growth across the world.
IoT in Transportation Industry Segmentation:
IMARC Group provides an analysis of the key trends in each segment of the global IoT in transportation market, along with forecasts at the global, regional, and country levels from 2026-2034. The market has been categorized based on type, mode of transport, and application.
Analysis by Type:
- Hardware
- Software
- Services
Hardware stand as the largest type in 2025, holding around 46.9% of the market. The hardware segment is the largest in the IoT transportation market as it connects physical assets to digital networks. Key components include sensors, GPS devices and communication modules that enable the collection, tracking and monitoring of vehicles, infrastructure, and cargo in real time. Hardware forms the backbone of IoT systems in transportation, making fleet management, traffic monitoring and predictive maintenance possible. Increasing demand for smart vehicles, connected infrastructure and autonomous transport solutions drives the adoption of advanced hardware which made it the most dominant category in the IoT in transportation market.
Analysis by Mode of Transport:
- Roadways
- Railways
- Airways
- Maritime
Railways leads the market with around 44.7% of IoT in transportation market share in 2025. Railways lead the IoT in the transportation market due to their extensive use of IoT technologies for improving efficiency, safety, and customer experience. IoT-enabled sensors track train locations, monitor engine health, and provide real-time data on rail infrastructure helping prevent accidents and reduce maintenance costs. Predictive analytics allow for better scheduling optimizing routes and energy consumption. IoT solutions also improve the passenger services by offering real-time updates and personalized travel experiences. This makes the rail industry the market leader in the IoT in transportation market as it highly depends on IoT for operational optimization, safety, and customer satisfaction.
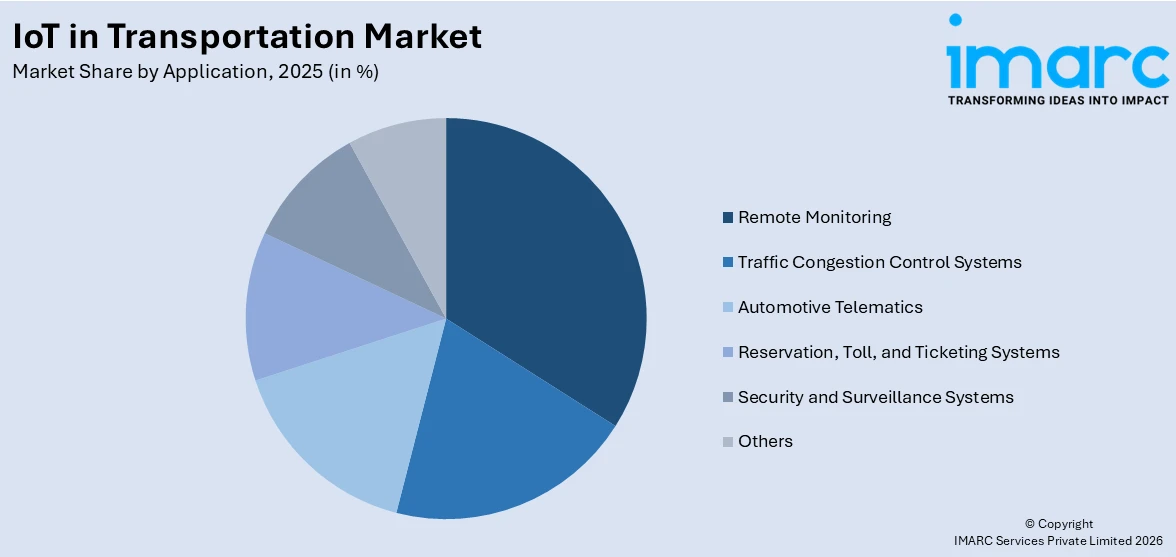
Analysis by Application:
Access the comprehensive market breakdown Request Sample
- Traffic Congestion Control Systems
- Automotive Telematics
- Reservation, Toll, and Ticketing Systems
- Security and Surveillance Systems
- Remote Monitoring
- Others
Remote monitoring leads the market with around 33.2% of market share in 2025. Remote monitoring leads in the IoT within the transportation market as it allows for real-time oversight of vehicles, fleet, and infrastructure without the need to be physically present. IoT sensors and tracking devices transmit vital information on vehicle health, location, fuel consumption and traffic conditions to centralized platforms allowing operators to make informed decisions and optimize efficiency. It is particularly useful in fleet management because it reduces downtime, prevents accidents, and optimizes routes. Remote monitoring supports predictive maintenance avoiding expensive repairs by detecting potential problems early. Widespread adoption of remote monitoring solutions makes it a key driver in IoT-enabled transportation.
Regional Analysis:
To get more information on the regional analysis of this market Request Sample
- North America
- United States
- Canada
- Asia-Pacific
- China
- Japan
- India
- South Korea
- Australia
- Indonesia
- Others
- Europe
- Germany
- France
- United Kingdom
- Italy
- Spain
- Russia
- Others
- Latin America
- Brazil
- Mexico
- Others
- Middle East and Africa
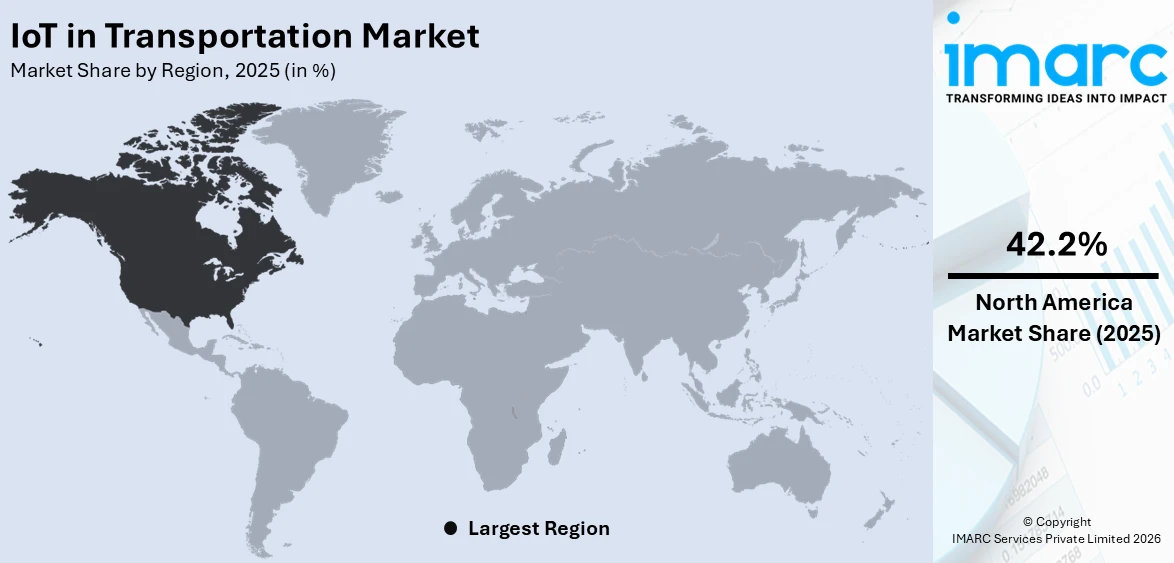
In 2025, North America accounted for the largest market share of over 42.2%. North America holds the largest share of the IoT in transportation market due to significant investments in smart infrastructure, advanced technologies, and a strong focus on innovation. The region's adoption of IoT solutions for fleet management, autonomous vehicles and connected transportation systems is driven by government initiatives and the presence of leading technology companies. North America also has a well-developed transportation network in terms of highways, railways, and air traffic. The region also has a high demand for efficiency, safety and real-time data analytics making it a dominant player in the IoT transportation sector.
Key Regional Takeaways:
United States IoT in Transportation Market Analysis
In 2025, the United States captured 82.00% of revenue in the North American market. The United States is experiencing rapid adoption of IoT technologies in transportation driven by the need for improved efficiency, safety, and sustainability. Smart infrastructure development such as connected traffic management systems and intelligent highways is a significant factor. These innovations enable real-time traffic monitoring reducing congestion and optimizing road usage. Federal and state governments support these initiatives through investments in smart city projects including IoT-powered transportation networks. Advancements in autonomous vehicles are another critical driver. The U.S. is a leader in autonomous and connected vehicle technologies with companies like Tesla, Waymo and General Motors investing heavily in IoT solutions. These vehicles rely on IoT for navigation, data exchange and vehicle-to-everything (V2X) communication enhancing operational efficiency. The growing focus on road safety on account of higher cases of road accidents in the country is offering a favorable IoT in transportation market outlook. As per the NHTSA, there were 40,990 people died in motor vehicle traffic crashes in 2023. Apart from this, the growing demand for freight and logistics efficiency is positively influencing the market. IoT-enabled fleet management systems help companies track shipments, monitor vehicle health and reduce fuel consumption contributing to cost savings and better resource utilization.
Asia Pacific IoT in Transportation Market Analysis
Asia Pacific's IoT in transportation market is expanding rapidly due to the rapid urbanization, growing population, and increasing investments in smart city initiatives. The India population reached 1,395.0 Million in March 2024 as per the CEIC. Countries like China, India, Japan, and South Korea are leading the region with large-scale adoption of IoT technologies to address traffic congestion and transportation inefficiencies. Smart city projects are at the forefront with governments prioritizing intelligent traffic systems, smart parking solutions and integrated public transportation. China's nationwide "New Infrastructure" initiative and India’s Smart Cities Mission exemplify substantial investments aimed at leveraging IoT for urban mobility enhancements. The region's robust ecommerce and logistics sectors also drive IoT adoption in transportation. IoT-powered solutions such as route optimization, fleet management and asset tracking cater to the growing demand for efficient last-mile delivery and supply chain operations. Environmental concerns further support IoT integration as governments and organizations push for ecofriendly transportation. Electrification initiatives coupled with IoT-based energy management systems optimize resource usage and reduce emissions. Countries like Japan and South Korea are implementing rigorous policies to promote IoT in public and private transportation sectors contributing to the IoT in transportation market growth in the region.
Europe IoT in Transportation Market Analysis
Europe's IoT in transportation market benefits from advanced infrastructure, strict regulatory frameworks, and a strong focus on sustainability. The European Union (EU) plays a pivotal role in fostering IoT adoption through policies and funding for smart transportation initiatives. Programs like the Horizon Europe framework prioritize IoT-driven advancements in urban mobility, autonomous vehicles, and logistics. Environmental sustainability is a primary driver as the EU enforces stringent emissions regulations. IoT technologies help monitor and manage fuel consumption, emissions and energy efficiency supporting compliance with regulations. Smart public transportation systems featuring IoT-enabled buses, trains and ticketing enhance operational efficiency and passenger experiences. The rising adoption of vehicles among individuals in the region due to changing lifestyles and commuting purposes is bolstering the market growth. According to the International Council on Clean Transportation, about 10.6 Million new cars were registered in the 27 Member States of EU in 2023. Besides this, the region’s focus on autonomous and connected vehicles also propels IoT adoption. European automakers are integrating IoT solutions for vehicle-to-everything (V2X) communication and real-time navigation. Collaborative projects such as C-ROADS promote interoperable V2X systems across EU member states. The proliferation of 5G networks across Europe enhances IoT functionality enabling faster and more reliable data exchange.
Latin America IoT in Transportation Market Analysis
Rapid urbanization, government-backed smart city projects and the growing need for efficient logistics solutions in the region is contributing to the market growth. Rapid population growth in countries like Brazil, Mexico and Colombia is leading to severe traffic congestion prompting investments in IoT-enabled traffic management systems. These systems optimize urban mobility by monitoring and controlling traffic flow in real-time. The rising usage of smartphones and the development of 5G networks in the region enable seamless IoT applications in transportation. As per reports, the share of smartphones users is 66.6% in Brazil. Furthermore, the region’s burgeoning ecommerce sector also contributes to IoT adoption with logistics companies leveraging IoT for fleet management, asset tracking and last-mile delivery optimization. Partnerships between public and private sectors are accelerating IoT integration in transportation fostering sustainable practices and reducing emissions.
Middle East and Africa IoT in Transportation Market Analysis
The Middle East and Africa (MEA) region is embracing IoT in transportation propelled by infrastructure investments. Countries like the UAE and Saudi Arabia are at the forefront with projects such as Dubai’s Smart City initiative and Saudi Vision 2030 integrating IoT for efficient traffic management and public transportation. Oil-exporting nations are diversifying their economies and IoT-enabled transportation solutions play a key role in creating sustainable urban mobility. Smart technologies are deployed in logistics hubs and ports to enhance operational efficiency particularly in global trade hubs like Dubai and Cape Town. In Africa, IoT adoption is rising in response to urban challenges like traffic congestion and inefficient public transport. Governments and private entities are deploying IoT-powered systems for fleet tracking, route optimization and real-time monitoring supported by growing investments in 4G and 5G networks across the region. In the MENA region, there were 30 Million 5G connections as of November 2023, as per reports.
Competitive Landscape:
The competitive landscape of the IoT in transportation market is marked by a mix of established technology giants and specialized startups each striving to capture market share through innovation. Key players focus on developing IoT solutions that enhance fleet management, predictive maintenance, real-time tracking, and autonomous vehicle technology. Companies are investing heavily in AI, machine learning and data analytics to offer more efficient data-driven solutions. Partnerships between tech providers, transportation companies and governments are common as they enable the integration of smart infrastructure and enhanced safety features.
The report provides a comprehensive analysis of the competitive landscape in the IoT in transportation market with detailed profiles of all major companies, including:
- ALE International
- AT&T Inc
- Cisco Systems, Inc.
- Denso Corporation
- Garmin Ltd.
- International Business Machines Corporation
- Semtech
- Telstra Enterprise
- Thales Group
- TomTom International BV
- Verizon
Latest News and Developments:
- October 2024: Kia India and Airtel Business engaged in a partnership that will allow the car manufacturer to begin embedding Airtel’s IoT tech within their connected vehicles. Kia’s cars will come equipped with Airtel eSIMs enabling them to connect to Airtel's mobile network and the 'Airtel IoT Hub.' This integration will ensure connectivity for the vehicles while also facilitating telematics, infotainment, improved safety features and firmware updates over the air (FOTA).
- September 2024: Ericsson introduced two cutting-edge routers, the Ericsson Cradlepoint R980 and S400, designed to deliver seamless, secure, and scalable connectivity for enterprises, supporting AI, data analytics, computer vision, and other advanced applications in IoT networks. Incorporated with Ericsson’s NetCloud platform featuring NetCloud SASE Secure Connect these routers provide effortless deployment and management along with strong zero-trust security for widespread IoT and vehicle endpoints. The Ericsson Cradlepoint R980 is a durable 5G router that supplies high-performance connectivity for vehicles facilitating the rollout of advanced applications.
- August 2024: Salesforce introduced Connected Vehicle a new application within its Automotive Cloud that enables automakers to develop and provide safer and more tailored driving experiences more efficiently. This app allows manufacturers to seamlessly integrate data from vehicles, the Internet of Things (IoT), drivers and retail sources including AWS IoT FleetWise and Snapdragon® Car to-Cloud Connected Services Platform to improve driver experiences and ensure vehicles operate effectively.
- February 2024: Soracom, Inc., a global leader in advanced IoT connectivity, and Suzuki Motor Corporation announced an agreement to explore the use of advanced IoT technologies in mobility services.
IoT in Transportation Market Report Scope:
| Report Features | Details |
|---|---|
| Base Year of the Analysis | 2025 |
| Historical Period | 2020-2025 |
| Forecast Period | 2026-2034 |
| Units | Billion USD |
| Scope of the Report |
Exploration of Historical Trends and Market Outlook, Industry Catalysts and Challenges, Segment-Wise Historical and Future Market Assessment:
|
| Types Covered | Hardware, Software, Services |
| Mode of Transports Covered | Roadways, Railways, Airways, Maritime |
| Applications Covered | Traffic Congestion Control Systems, Automotive Telematics, Reservation, Toll and Ticketing Systems, Security and Surveillance Systems, Remote Monitoring, Others |
| Region Covered | Asia Pacific, Europe, North America, Latin America, Middle East and Africa |
| Countries Covered | United States, Canada, Germany, France, United Kingdom, Italy, Spain, Russia, China, Japan, India, South Korea, Australia, Indonesia, Brazil, Mexico |
| Companies Covered | ALE International, AT&T Inc, Cisco Systems, Inc., Denso Corporation, Garmin Ltd., International Business Machines Corporation, Semtech, Telstra Enterprise, Thales Group, TomTom International BV, Verizon, etc. |
| Customization Scope | 10% Free Customization |
| Post-Sale Analyst Support | 10-12 Weeks |
| Delivery Format | PDF and Excel through Email (We can also provide the editable version of the report in PPT/Word format on special request) |
Key Benefits for Stakeholders:
- IMARC’s report offers a comprehensive quantitative analysis of various market segments, historical and current market trends, market forecasts, and dynamics of the IoT in transportation market from 2020-2034.
- The IoT in transportation market research report provides the latest information on the market drivers, challenges, and opportunities in the global market.
- The study maps the leading, as well as the fastest-growing, regional markets. It further enables stakeholders to identify the key country-level markets within each region.
- Porter's five forces analysis assist stakeholders in assessing the impact of new entrants, competitive rivalry, supplier power, buyer power, and the threat of substitution. It helps stakeholders to analyze the level of competition within the IoT in transportation industry and its attractiveness.
- Competitive landscape allows stakeholders to understand their competitive environment and provides an insight into the current positions of key players in the market.
Frequently Asked Questions About the IoT in Transportation Market Report
The IoT in transportation market was valued at USD 194.5 Billion in 2025.
IMARC estimates the IoT in transportation market to reach USD 706.6 Billion by 2034, exhibiting a CAGR of 14.95% during 2026-2034.
Key factors driving the IoT in transportation market include the growing demand for real-time tracking and fleet management, advances in connectivity technologies like 5G and LPWAN, increasing safety regulations, the rise of autonomous vehicles, and the push for smart city initiatives. These trends enhance operational efficiency, reduce costs, and improve safety.
North America dominates the market, holding over 42.2% of the share in 2025. Key factors driving the IoT in transportation market in the region include the widespread adoption of IoT solutions for fleet management and autonomous vehicles. The presence of leading technology companies, along with the favorable government initiatives further create a positive IoT in transportation market outlook across the North American region.
Some of the major players in the IoT in transportation market include ALE International, AT&T Inc, Cisco Systems, Inc., Denso Corporation, Garmin Ltd., International Business Machines Corporation, Semtech, Telstra Enterprise, Thales Group, TomTom International BV, Verizon, etc.
Need more help?
- Speak to our experienced analysts for insights on the current market scenarios.
- Include additional segments and countries to customize the report as per your requirement.
- Gain an unparalleled competitive advantage in your domain by understanding how to utilize the report and positively impacting your operations and revenue.
- For further assistance, please connect with our analysts.
 Request Customization
 Speak to an Analyst
 Request Brochure
 Inquire Before Buying
Benefits of Customization
- Personalize this research
- Triangulate with your data
- Get data as per your format and definition
- Gain a deeper dive into a specific application, geography, customer, or competitor
- Any level of personalization
Get in Touch With Us
UNITED STATES
Phone: +1-201-971-6302
INDIA
Phone: +91-120-433-0800
UNITED KINGDOM
Phone: +44-753-714-6104
Email: [email protected]
Client Testimonials


.webp)


