
Lead Prices, Trend, Chart, Demand, Market Analysis, News, Historical and Forecast Data Report 2026 Edition
Lead Price Trend, Index and Forecast
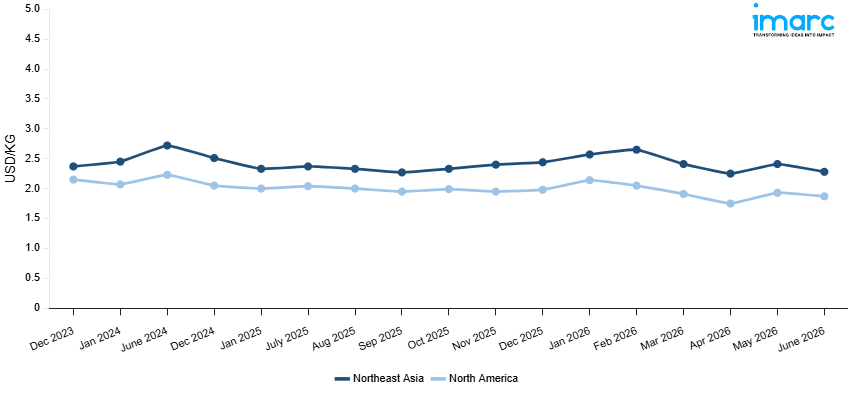
Track real-time and historical lead prices across global regions. Updated monthly with market insights, drivers, and forecasts.
Lead Prices June 2026
| Region | Price (USD/KG) | Latest Movement |
|---|---|---|
| Northeast Asia | 2.28 | -5.4% ↓ Down |
| North America | 1.87 | -3.1% ↓ Down |
Lead Price Index (USD/KG):
The chart below highlights monthly lead prices across different regions.
Get Access to Monthly/Quarterly/Yearly Prices, Request Sample
Market Overview Q1 Ending March 2026
Northeast Asia: The lead prices in Northeast Asia reached 2.41 USD/KG in March 2026. The downward pricing movement registered between December and March 2026 was 1.2%. This decline in price can be attributed to a relatively stable market environment, which saw steady demand from the lead acid battery, cable sheathing, and radiation shielding manufacturing industries, as their procurement rates remained constant throughout the quarter. The relatively lower prices of lead concentrate and scrap, which serve as raw materials in production, slightly affected the production economics of the regional lead smelters. The comfortable supply position, ensured by primary and secondary production capacities, along with a steady rate of consumption from the automotive starter battery and industrial standby power industries, formed a baseline for offtake market fundamentals.
North America: The lead prices in North America reached 1.91 USD/KG in March 2026. The downward pricing movement registered between December and March 2026 was 3.5%. The modest price decrease can be attributed mainly to lower demand from lead acid battery production and ammunition, driven by conservative consumer spending patterns and a slowdown in replacement market sales in the region. A decrease in the prices of lead concentrate and scrap, which form the raw materials, lowered the production cost benchmarks for both primary and secondary production in the country. Adequate supply was ensured by sufficient production capacity from primary and secondary sources. An increase in recycling programs also boosted supply, exerting downward pressure on prices.
Market Overview Q4 Ending December 2025
Northeast Asia: The lead prices in Northeast Asia reached 2.44 USD/KG in December 2025. The upward pricing movement registered between September and December 2025 was 7.3%. Regional markets demonstrated substantial price appreciation as demand from lead-acid battery manufacturers intensified throughout the quarter, driven by robust automotive replacement battery sales and expanding energy storage system installations. Production constraints at several smelting operations, attributed to environmental compliance upgrades and periodic maintenance activities, tightened primary lead availability and provided fundamental support to pricing levels. Secondary lead supply from battery recycling operations remained active but proved insufficient to fully satisfy growing consumption requirements, particularly as collection rates faced seasonal headwinds.
North America: The lead prices in North America reached 1.98 USD/KG in December 2025. The upward pricing movement registered between September and December 2025 was 1.3%. North American markets recorded modest price firming, as automotive battery demand remained resilient amid broader economic uncertainties that are affecting vehicle sales patterns. Replacement battery purchases, which account for the dominant share of regional lead consumption, remained relatively steady as ageing vehicle fleets required ongoing maintenance regardless of new-car market dynamics. Battery manufacturers maintained regular production schedules, securing lead supplies through established procurement relationships that emphasized delivery reliability over aggressive pricing negotiations. Primary smelter operations ran at stable utilization rates, balancing output with demand requirements while managing input costs from concentrate purchases and energy expenses.
Market Overview Q3 Ending September 2025
Northeast Asia: Lead prices in Northeast Asia declined this quarter as weaker procurement from the battery manufacturing sector weighed on demand. The lead price index reflected downward momentum due to subdued activity in the automotive and industrial battery markets. Ample availability from regional smelters and steady imports contributed to oversupply pressures. At the same time, softer demand from construction and cable manufacturing provided little support to stabilize prices. This combination of strong supply and muted downstream consumption kept prices under bearish pressure.
North America: In North America, lead prices trended lower as the regional lead price index weakened in response to sluggish offtake from the automotive and backup power storage industries. Abundant domestic production and steady secondary lead recovery kept supply levels high, while downstream demand failed to absorb volumes effectively. Additionally, muted construction activity limited metal procurement, further restraining price growth. Imports also played a role in adding competition, reinforcing the overall softness in market conditions during this quarter.
Lead Price Trend, Market Analysis, and News
IMARC's latest publication, “Lead Prices, Trend, Chart, Demand, Market Analysis, News, Historical and Forecast Data Report 2026 Edition,” presents a detailed examination of the lead market, providing insights into both global and regional trends that are shaping prices. This report delves into the spot price of lead at major ports and analyzes the composition of prices, including FOB and CIF terms. It also presents detailed lead prices trend analysis by region, covering North America, Europe, Asia Pacific, Latin America, and Middle East and Africa. The factors affecting lead pricing, such as the dynamics of supply and demand, geopolitical influences, and sector-specific developments, are thoroughly explored. This comprehensive report helps stakeholders stay informed with the latest market news, regulatory updates, and technological progress, facilitating informed strategic decision-making and forecasting.
Lead Industry Analysis
The global lead industry size reached 4,704.09 Thousand Tons in 2025. By 2034, IMARC Group expects the market to reach 5,703.27 Thousand Tons, at a projected CAGR of 2.16% during 2026-2034. Growth is supported by the rising demand for lead acid batteries in automotive, industrial, and renewable energy storage applications. Additionally, stable usage in cable sheathing, radiation shielding, and construction materials contributes to long term market resilience, despite regulatory pressures surrounding lead use in certain industries.
Latest developments in the Lead Industry:
- May 2025: Ecobat received a binding offer from Campine NV to acquire its French lead operations, which include both battery recycling and specialty lead manufacturing facilities. The company granted exclusivity to Campine NV, marking a significant step in the consolidation of the European lead recycling market.
- March 2024: Singapore became the hub for surplus industrial metals amid global demand downturns. Over 64,000 tons of lead arrived, marking a 34% increase, and pushing inventories to their highest since 2013.
Product Description
Lead (Pb) is a dense, soft, and malleable heavy metal with high corrosion resistance and excellent electrical conductivity. It occurs naturally in the mineral galena (PbS) and is primarily produced through smelting processes. Industrially, lead is best known for its use in lead-acid batteries, which dominate global consumption due to their widespread application in vehicles, backup power systems, and renewable energy storage. Beyond batteries, lead is employed in cable sheathing, construction materials, radiation shielding, and specialized alloys. Its chemical stability and resistance to corrosion make it suitable for protective coatings and chemical equipment. However, due to its toxicity, strict environmental regulations govern its production and use. Despite these challenges, lead remains a vital industrial metal owing to its versatility and essential role in energy storage solutions.
Report Coverage
| Key Attributes | Details |
|---|---|
| Product Name | Lead |
| Report Features | Exploration of Historical Trends and Market Outlook, Industry Demand, Industry Supply, Gap Analysis, Challenges, Lead Price Analysis, and Segment-Wise Assessment. |
| Currency/Units | US$ (Data can also be provided in local currency) or Metric Tons |
| Region/Countries Covered | The current coverage includes analysis at the global and regional levels only. Based on your requirements, we can also customize the report and provide specific information for the following countries: Asia Pacific: China, India, Indonesia, Pakistan, Bangladesh, Japan, Philippines, Vietnam, Thailand, South Korea, Malaysia, Nepal, Taiwan, Sri Lanka, Hongkong, Singapore, Australia, and New Zealand Europe: Germany, France, United Kingdom, Italy, Spain, Russia, Turkey, Netherlands, Poland, Sweden, Belgium, Austria, Ireland, Switzerland, Norway, Denmark, Romania, Finland, Czech Republic, Portugal and Greece North America: United States and Canada Latin America: Brazil, Mexico, Argentina, Columbia, Chile, Ecuador, and Peru Middle East & Africa: Saudi Arabia, UAE, Israel, Iran, South Africa, Nigeria, Oman, Kuwait, Qatar, Iraq, Egypt, Algeria, and Morocco The list of countries presented is not exhaustive. Information on additional countries can be provided if required by the client. |
| Information Covered for Key Suppliers |
|
| Customization Scope | The report can be customized as per the requirements of the customer |
| Report Price and Purchase Option |
Plan A: Monthly Updates - Annual Subscription
Plan B: Quarterly Updates - Annual Subscription
Plan C: Biannually Updates - Annual Subscription
|
| Post-Sale Analyst Support | 360-degree analyst support after report delivery |
| Delivery Format | PDF and Excel through email (We can also provide the editable version of the report in PPT/Word format on special request) |
Key Benefits for Stakeholders:
- IMARC’s report presents a detailed analysis of lead pricing, covering global and regional trends, spot prices at key ports, and a breakdown of ex-works, FOB, and CIF prices.
- The study examines factors affecting lead price trend, including supply-demand shifts and geopolitical impacts, offering insights for informed decision-making.
- The competitive landscape review equips stakeholders with crucial insights into the latest market news, regulatory changes, and technological advancements, ensuring a well-rounded, strategic overview for forecasting and planning.
- IMARC offers various subscription options, including monthly, quarterly, and biannual updates, allowing clients to stay informed with the latest market trends, ongoing developments, and comprehensive market insights. The lead price charts ensure our clients remain at the forefront of the industry.
Frequently Asked Questions About the Lead Price Trend Report
The lead prices in June 2026 were 2.28 USD/Kg in Northeast Asia and 1.87 USD/Kg in North America.
The lead pricing data is updated on a monthly basis.
We provide the pricing data primarily in the form of an Excel sheet and a PDF.
Yes, our report includes a forecast for lead prices.
The regions covered include North America, Europe, Asia Pacific, Middle East, and Latin America. Countries can be customized based on the request (additional charges may be applicable).
Yes, we provide both FOB and CIF prices in our report.
Need more help?
- Speak to our experienced analysts for insights on the current market scenarios.
- Include additional segments and countries to customize the report as per your requirement.
- Gain an unparalleled competitive advantage in your domain by understanding how to utilize the report and positively impacting your operations and revenue.
- For further assistance, please connect with our analysts.
 Request Customization
 Inquire Before Buying
 Speak to an Analyst
 Request Brochure
Benefits of Customization
- Personalize this research
- Triangulate with your data
- Get data as per your format and definition
- Gain a deeper dive into a specific application, geography, customer, or competitor
- Any level of personalization
Get in Touch With Us
UNITED STATES
Phone: +1-201-971-6302
INDIA
Phone: +91-120-433-0800
UNITED KINGDOM
Phone: +44-753-714-6104
Email: [email protected]
Client Testimonials


.webp)


Why Choose Us
IMARC offers trustworthy, data-centric insights into commodity pricing and evolving market trends, enabling businesses to make well-informed decisions in areas such as procurement, strategic planning, and investments. With in-depth knowledge spanning more than 1000 commodities and a vast global presence in over 150 countries, we provide tailored, actionable intelligence designed to meet the specific needs of diverse industries and markets.
1000
+Commodities
150
+Countries Covered
3000
+Clients
20
+Industry
Robust Methodologies & Extensive Resources
IMARC delivers precise commodity pricing insights using proven methodologies and a wealth of data to support strategic decision-making.
Subscription-Based Databases
Our extensive databases provide detailed commodity pricing, import-export trade statistics, and shipment-level tracking for comprehensive market analysis.
Primary Research-Driven Insights
Through direct supplier surveys and expert interviews, we gather real-time market data to enhance pricing accuracy and trend forecasting.
Extensive Secondary Research
We analyze industry reports, trade publications, and market studies to offer tailored intelligence and actionable commodity market insights.
Trusted by 3000+ industry leaders worldwide to drive data-backed decisions. From global manufacturers to government agencies, our clients rely on us for accurate pricing, deep market intelligence, and forward-looking insights.