
Malaysia Children’s Entertainment Centers Market Size, Share, Trends and Forecast by Visitor Demographics, Facility Size, Revenue Source, Activity Area, and Region, 2025-2033
Malaysia Children’s Entertainment Centers Market Overview:
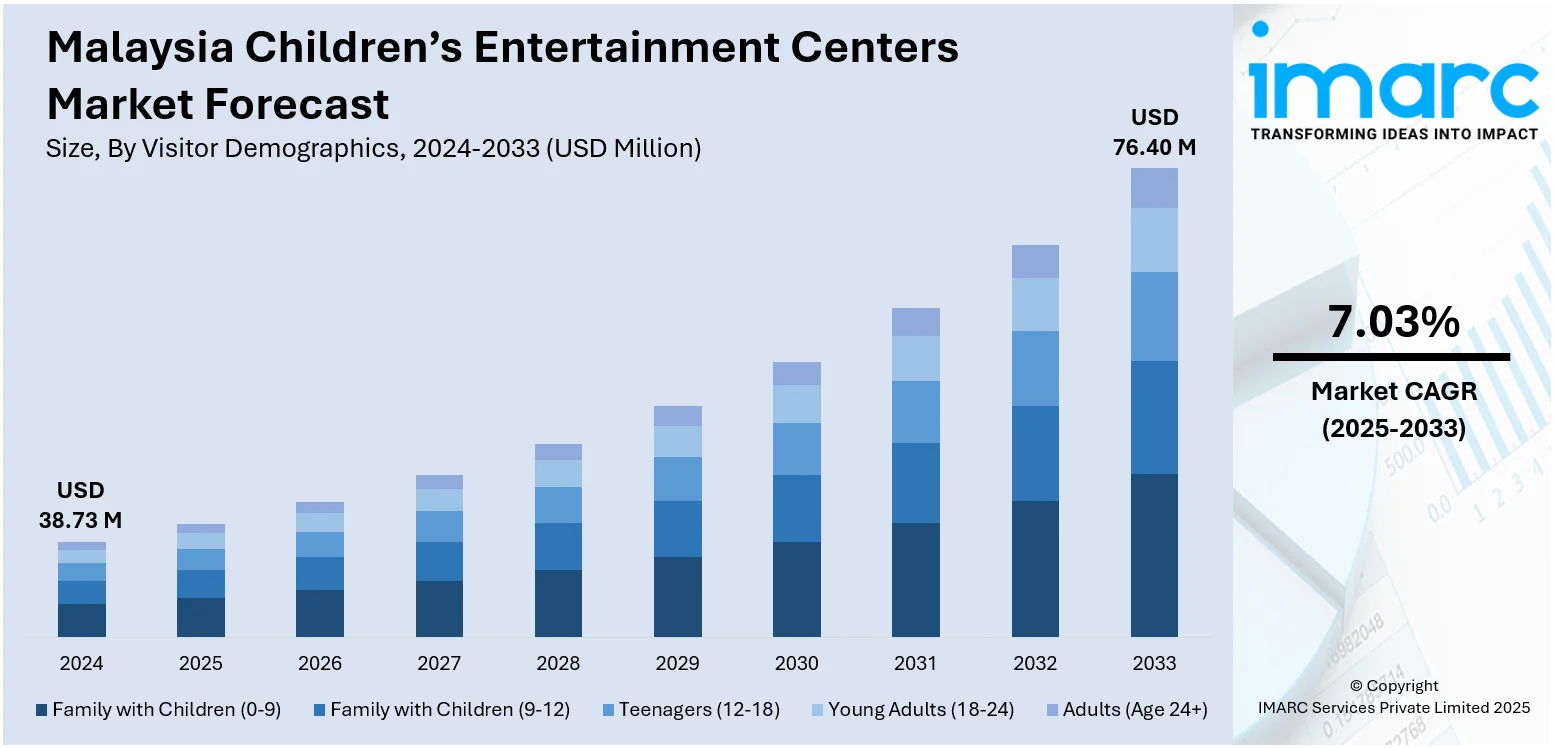
The Malaysia children’s entertainment centers market size reached USD 38.73 Million in 2024. Looking forward, IMARC Group expects the market to reach USD 76.40 Million by 2033, exhibiting a growth rate (CAGR) of 7.03% during 2025-2033. Rising disposable incomes, urbanization, and growing demand for family leisure activities are some of the factors contributing to the Malaysia children’s entertainment centers market share. Increasing mall developments, tourism, and digital engagement among children also support market expansion. Government support for child development and a shift toward experiential entertainment add further momentum to industry growth.
|
Report Attribute
|
Key Statistics
|
|---|---|
|
Base Year
|
2024
|
|
Forecast Years
|
2025-2033
|
|
Historical Years
|
2019-2024
|
| Market Size in 2024 | USD 38.73 Million |
| Market Forecast in 2033 | USD 76.40 Million |
| Market Growth Rate 2025-2033 | 7.03% |
Malaysia Children’s Entertainment Centers Market Trends:
Focus on Indoor Edutainment Integration
Children’s entertainment centers in Malaysia are increasingly blending education with play, giving rise to edutainment zones that appeal to both children and their parents. These centers go beyond basic arcade and soft play offerings, integrating interactive STEM-based exhibits, language immersion pods, and real-world roleplay environments that mimic professional settings. Shopping malls in Klang Valley and Penang are particularly active in this space, with new openings featuring digital art studios, simulated science labs, and augmented reality games focused on learning. Parents see these as productive alternatives to screen time, especially during school holidays. Operators benefit from longer visitor dwell times and higher ticket prices, while also attracting partnerships with educational institutions and corporate sponsors. The shift is also helping centers operate sustainably during weekdays by offering curated learning modules for school groups. The demand for themed learning-through-play attractions is shaping the design of new projects, pushing developers to collaborate with curriculum specialists and child psychologists to make these offerings credible and immersive.
To get more information on this market, Request Sample
Demand for Smaller Format, Neighborhood-Based Play Zones
There’s growing demand for compact, community-anchored children’s play centers in suburban townships and mid-sized cities across Malaysia. These are not mega indoor theme parks, but rather 2,000–5,000 sq. ft. units fitted with modular soft play, climbing structures, and sensory zones. With rising traffic congestion and changing work routines, parents prefer having quick-access options closer to home. This trend is particularly visible in areas like Shah Alam, Johor Bahru, and Ipoh, where developers are building retail strips within residential clusters. Instead of aiming for high footfall from tourists, these operators focus on repeat local visitors with loyalty schemes, affordable memberships, and birthday party packages. The model favors lower startup costs and leaner staff requirements. Mall landlords also welcome these formats, as they bring weekday traffic and fill out less desirable upper-floor units. This move toward decentralization reflects a shift in consumer behavior where convenience, familiarity, and consistent quality outweigh spectacle and novelty. The result is a hyper-localized entertainment model built for frequency and familiarity.
Malaysia Children’s Entertainment Centers Market Segmentation:
IMARC Group provides an analysis of the key trends in each segment of the market, along with forecasts at the country and regional levels for 2025-2033. Our report has categorized the market based on visitor demographics, facility size, revenue source, and activity area.
Visitor Demographics Insights:
- Family with Children (0-9)
- Family with Children (9-12)
- Teenagers (12-18)
- Young Adults (18-24)
- Adults (Age 24+)
The report has provided a detailed breakup and analysis of the market based on the visitor demographics. This includes family with children (0-9), family with children (9-12), teenagers (12-18), young adults (18-24), and adults (age 24+).
Facility Size Insights:
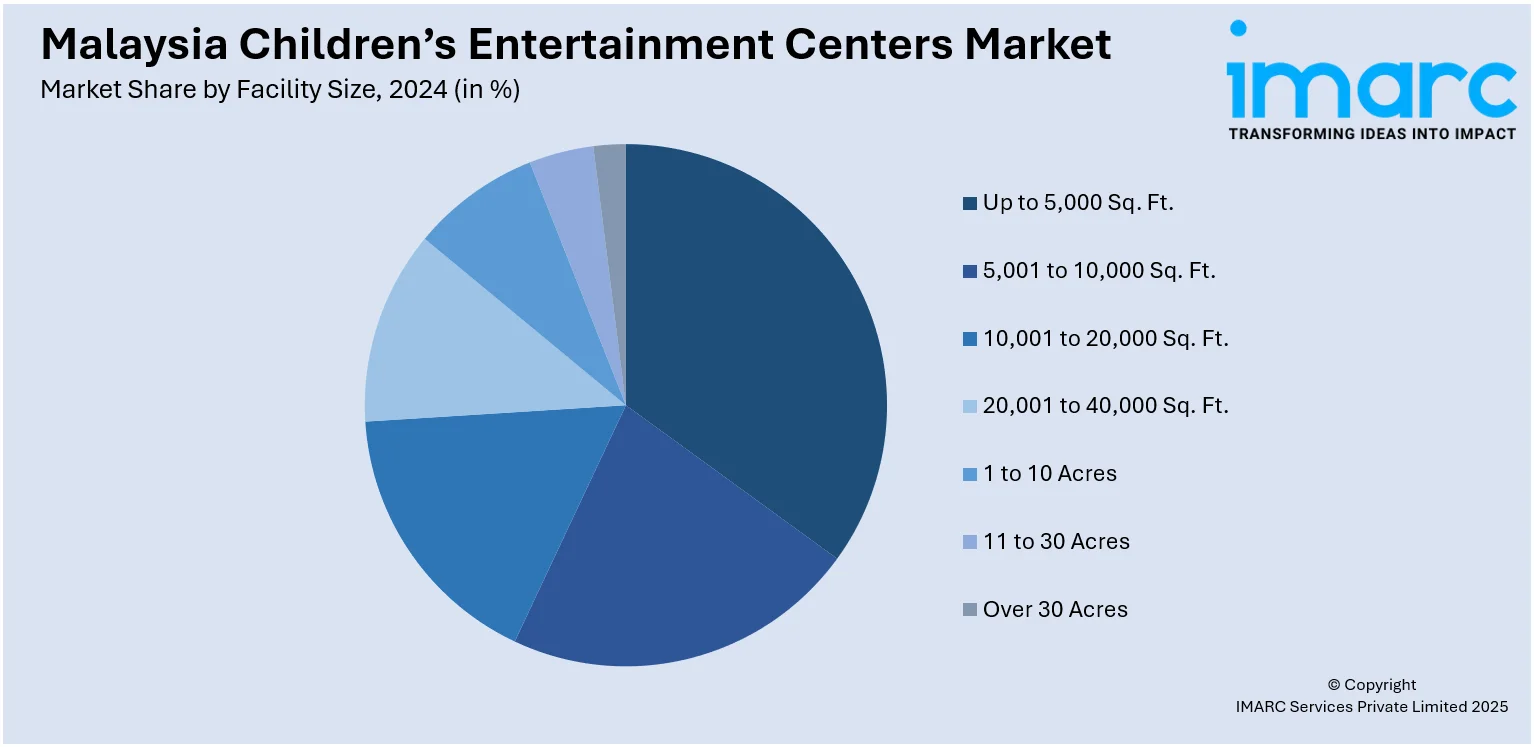
- Up to 5,000 Sq. Ft.
- 5,001 to 10,000 Sq. Ft.
- 10,001 to 20,000 Sq. Ft.
- 20,001 to 40,000 Sq. Ft.
- 1 to 10 Acres
- 11 to 30 Acres
- Over 30 Acres
The report has provided a detailed breakup and analysis of the market based on the facility size. This includes up to 5,000 sq. ft., 5,001 to 10,000 sq. ft., 10,001 to 20,000 sq. ft., 20,001 to 40,000 sq. ft., 1 to 10 acres, 11 to 30 acres, and over 30 acres.
Revenue Source Insights:
- Entry Fees and Ticket Sales
- Food and Beverages
- Merchandising
- Advertising
- Others
The report has provided a detailed breakup and analysis of the market based on the revenue source. This includes entry fees and ticket sales, food and beverages, merchandising, advertising, and others.
Activity Area Insights:
- Arcade Studios
- AR and VR Gaming Zone
- Physical Play Activities
- Skill/Competition Games
- Others
A detailed breakup and analysis of the market based on the activity area have also been provided in the report. This includes arcade studios, AR and VR gaming zone, physical play activities, skill/competition games, and others.
Regional Insights:
- Selangor
- W.P. Kuala Lumpur
- Johor
- Sarawak
- Others
The report has also provided a comprehensive analysis of all the major regional markets, which include Selangor, W.P. Kuala Lumpur, Johor, Sarawak, and others.
Competitive Landscape:
The market research report has also provided a comprehensive analysis of the competitive landscape. Competitive analysis such as market structure, key player positioning, top winning strategies, competitive dashboard, and company evaluation quadrant has been covered in the report. Also, detailed profiles of all major companies have been provided.
Malaysia Children’s Entertainment Centers Market News:
- In December 2024, Astro hosted “Home of Kids,” a 4-day children’s entertainment event at IOI Grand Convention Centre, Malaysia, from 26–29 December. Open to all with free entry, it featured popular characters and engaging activities from partners like Cartoon Network, DreamWorks, Nickelodeon, and Disney+ Hotstar. The event contributed to Malaysia’s children’s entertainment centers market by delivering immersive, family-friendly experiences through content-driven attractions and brand collaborations.
Malaysia Children’s Entertainment Centers Market Report Coverage:
| Report Features | Details |
|---|---|
| Base Year of the Analysis | 2024 |
| Historical Period | 2019-2024 |
| Forecast Period | 2025-2033 |
| Units | Million USD |
| Scope of the Report |
Exploration of Historical Trends and Market Outlook, Industry Catalysts and Challenges, Segment-Wise Historical and Future Market Assessment:
|
| Visitor Demographics Covered | Family with Children (0-9), Family with Children (9-12), Teenagers (12-18), Young Adults (18-24), Adults (Age 24+) |
| Facility Sizes Covered | Up to 5,000 Sq. Ft., 5,001 to 10,000 Sq. Ft., 10,001 to 20,000 Sq. Ft., 20,001 to 40,000 Sq. Ft., 1 to 10 Acres, 11 to 30 Acres, Over 30 Acres |
| Revenue Sources Covered | Entry Fees and Ticket Sales, Food and Beverages, Merchandising, Advertising, Others |
| Activity Areas Covered | Arcade Studios, AR and VR Gaming Zone, Physical Play Activities, Skill/Competition Games, Others |
| Regions Covered | Selangor, W.P. Kuala Lumpur, Johor, Sarawak, Others |
| Customization Scope | 10% Free Customization |
| Post-Sale Analyst Support | 10-12 Weeks |
| Delivery Format | PDF and Excel through Email (We can also provide the editable version of the report in PPT/Word format on special request) |
Key Questions Answered in This Report:
- How has the Malaysia children’s entertainment centers market performed so far and how will it perform in the coming years?
- What is the breakup of the Malaysia children’s entertainment centers market on the basis of visitor demographics?
- What is the breakup of the Malaysia children’s entertainment centers market on the basis of facility size?
- What is the breakup of the Malaysia children’s entertainment centers market on the basis of revenue source?
- What is the breakup of the Malaysia children’s entertainment centers market on the basis of activity area?
- What is the breakup of the Malaysia children’s entertainment centers market on the basis of region?
- What are the various stages in the value chain of the Malaysia children’s entertainment centers market?
- What are the key driving factors and challenges in the Malaysia children’s entertainment centers market?
- What is the structure of the Malaysia children’s entertainment centers market and who are the key players?
- What is the degree of competition in the Malaysia children’s entertainment centers market?
Key Benefits for Stakeholders:
- IMARC’s industry report offers a comprehensive quantitative analysis of various market segments, historical and current market trends, market forecasts, and dynamics of the Malaysia children’s entertainment centers market from 2019-2033.
- The research report provides the latest information on the market drivers, challenges, and opportunities in the Malaysia children’s entertainment centers market.
- Porter's five forces analysis assist stakeholders in assessing the impact of new entrants, competitive rivalry, supplier power, buyer power, and the threat of substitution. It helps stakeholders to analyze the level of competition within the Malaysia children’s entertainment centers industry and its attractiveness.
- Competitive landscape allows stakeholders to understand their competitive environment and provides an insight into the current positions of key players in the market.
Need more help?
- Speak to our experienced analysts for insights on the current market scenarios.
- Include additional segments and countries to customize the report as per your requirement.
- Gain an unparalleled competitive advantage in your domain by understanding how to utilize the report and positively impacting your operations and revenue.
- For further assistance, please connect with our analysts.
 Request Customization
 Speak to an Analyst
 Request Brochure
 Inquire Before Buying
Benefits of Customization
- Personalize this research
- Triangulate with your data
- Get data as per your format and definition
- Gain a deeper dive into a specific application, geography, customer, or competitor
- Any level of personalization
Get in Touch With Us
UNITED STATES
Phone: +1-201-971-6302
INDIA
Phone: +91-120-433-0800
UNITED KINGDOM
Phone: +44-753-714-6104
Email: sales@imarcgroup.com
Client Testimonials


.webp)


