
Maple Water Market Report by Product (Flavored, Unflavored), Packaging Type (Tetra-Packs, Bottles, Pouches, Cans), Sales Channel (Direct Sales, Supermarkets and Hypermarkets, Convenience Stores, Online Stores, and Others), and Region 2026-2034
Market Overview 2026-2034:
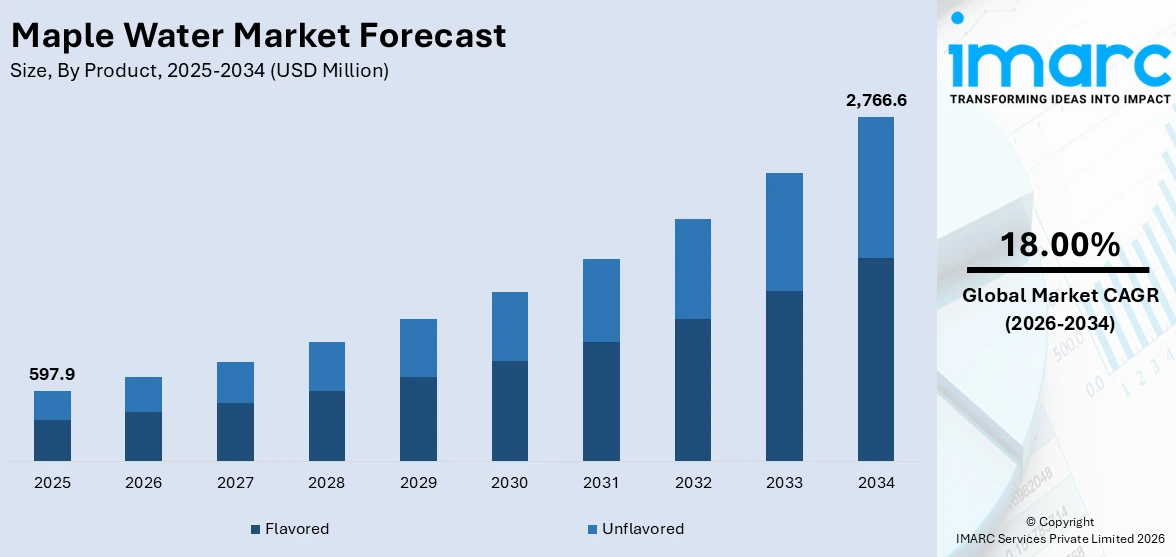
The global maple water market size reached USD 597.9 Million in 2025. Looking forward, IMARC Group expects the market to reach USD 2,766.6 Million by 2034, exhibiting a growth rate (CAGR) of 18.00% during 2026-2034.
|
Report Attribute
|
Key Statistics
|
|---|---|
|
Base Year
|
2025
|
|
Forecast Years
|
2026-2034
|
|
Historical Years
|
2020-2025
|
|
Market Size in 2025
|
USD 597.9 Million |
|
Market Forecast in 2034
|
USD 2,766.6 Million |
| Market Growth Rate 2026-2034 | 18.00% |
Maple water refers to a clear liquid, or sap, extracted and collected from maple trees. It is a rich source of phytochemicals and other essential nutrients, such as calcium, manganese, potassium, magnesium, iron, thiamin, riboflavin and phosphorus. It is also low in sugar and contains high amounts of electrolytes and antioxidants that aid in providing additional hydration, boosting immunity, preventing degenerative diseases and improving digestion. Maple water is usually available in packaged bottles and is offered in flavored and unflavored variants that can be used in alcoholic and non-alcoholic beverages, soups, sorbets, ice creams and marinades.
To get more information on this market Request Sample
Global Maple Water Market Trends and Drivers:
Significant growth in the food and beverage industry is one of the key factors creating a positive outlook for the market. Furthermore, the rising health consciousness among the masses is providing a thrust to the maple water market growth. With changing lifestyles and dietary habits, there is an increasing preference for organic and plant-based beverages instead of carbonated drinks, juices and sparkling drinks. In line with this, maple water is also gaining traction as a weight management and sports recovery drink, due to its low-calorie and high electrolyte content. Additionally, advancements in manufacturing technologies have enabled vendors to improve product quality and packaging designs to cater to a wide consumer base with diversified requirements. Other factors, including increasing product demand for the manufacturing of natural sweeteners, maple syrup, butter, liqueur and baked desserts, along with the aggressive promotional activities by manufacturers and easy product availability through proliferating online retail channels, are expected to drive the market further.
Key Market Segmentation:
IMARC Group provides an analysis of the key trends in each sub-segment of the global maple water market report, along with forecasts at the global, regional and country level from 2026-2034. Our report has categorized the market based on product, packaging type and sales channel.
Breakup by Product:
- Flavored
- Unflavored
Breakup by Packaging Type:
- Tetra-Packs
- Bottles
- Pouches
- Cans
Breakup by Sales Channel:
Access the comprehensive market breakdown Request Sample
- Direct Sales
- Supermarkets and Hypermarkets
- Convenience Stores
- Online Stores
- Others
Breakup by Region:
- North America
- United States
- Canada
- Asia Pacific
- Europe
- Germany
- France
- United Kingdom
- Italy
- Spain
- Russia
- Others
- Latin America
- Middle East and Africa

Competitive Landscape:
The report has also analysed the competitive landscape of the market with some of the key players being Drink Maple Inc., Feronia Forests LLC, Happytree Maple Water, Lower Valley Beverage Company, Maple 3, Oviva Eau D’Erable Pure, Sibberi and Smith & Salmon Inc.
Report Scope:
| Report Features | Details |
|---|---|
| Base Year of the Analysis | 2025 |
| Historical Period | 2020-2025 |
| Forecast Period | 2026-2034 |
| Units | Million USD |
| Segment Coverage | Product, Packaging Type, Sales Channel, Region |
| Region Covered | Asia Pacific, Europe, North America, Latin America, Middle East and Africa |
| Countries Covered | United States, Canada, Germany, France, United Kingdom, Italy, Spain, Russia |
| Companies Covered | Drink Maple Inc., Feronia Forests LLC, Happytree Maple Water, Lower Valley Beverage Company, Maple 3, Oviva Eau D’Erable Pure, Sibberi, Smith & Salmon Inc. |
| Customization Scope | 10% Free Customization |
| Post-Sale Analyst Support | 10-12 Weeks |
| Delivery Format | PDF and Excel through Email (We can also provide the editable version of the report in PPT/Word format on special request) |
Frequently Asked Questions About the Maple Water Market Report
The global maple water market was valued at USD 597.9 Million in 2025.
We expect the global maple water market to exhibit a CAGR of 18.00% during 2026-2034.
The rising demand for maple water, as it aids in providing hydration, boosting immunity, preventing degenerative diseases, improving digestion, etc., is primarily driving the global maple water market.
The sudden outbreak of the COVID-19 pandemic has led to the changing consumer inclination from conventional brick-and-mortar distribution channels towards online retail platforms for the purchase of maple water.
Based on the product, the global maple water market can be categorized into flavored and unflavored. Currently, flavored accounts for the majority of the global market share.
Based on the packaging type, the global maple water market has been segregated into tetra-packs, bottles, pouches, and cans. Among these, bottles currently exhibit a clear dominance in the market.
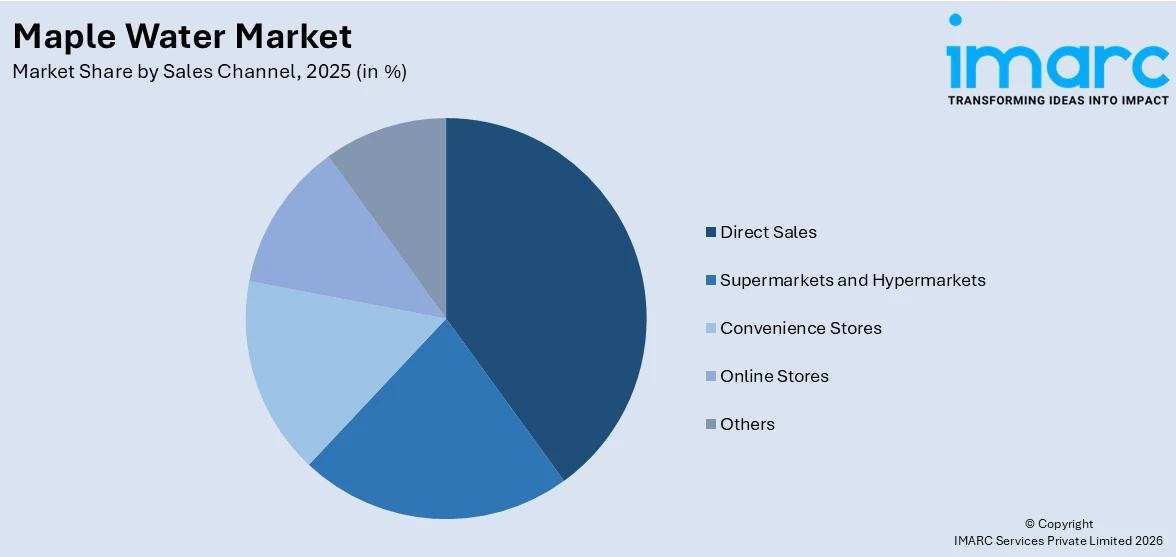
Based on the sales channel, the global maple water market can be bifurcated into direct sales, supermarkets and hypermarkets, convenience stores, online stores, and others. Currently, supermarkets and hypermarkets hold the largest market share.
On a regional level, the market has been classified into North America, Asia Pacific, Europe, Latin America, and Middle East and Africa, where North America currently dominates the global market.
Some of the major players in the global maple water market include Drink Maple Inc., Feronia Forests LLC, Happytree Maple Water, Lower Valley Beverage Company, Maple 3, Oviva Eau D’Erable Pure, Sibberi, and Smith & Salmon Inc.
Need more help?
- Speak to our experienced analysts for insights on the current market scenarios.
- Include additional segments and countries to customize the report as per your requirement.
- Gain an unparalleled competitive advantage in your domain by understanding how to utilize the report and positively impacting your operations and revenue.
- For further assistance, please connect with our analysts.
 Request Customization
 Speak to an Analyst
 Request Brochure
 Inquire Before Buying
Benefits of Customization
- Personalize this research
- Triangulate with your data
- Get data as per your format and definition
- Gain a deeper dive into a specific application, geography, customer, or competitor
- Any level of personalization
Get in Touch With Us
UNITED STATES
Phone: +1-201-971-6302
INDIA
Phone: +91-120-433-0800
UNITED KINGDOM
Phone: +44-753-714-6104
Email: [email protected]
Client Testimonials


.webp)


