
Methanol Prices, Trend, Chart, Demand, Market Analysis, News, Historical and Forecast Data Report 2026 Edition
Methanol Price Trend, Index and Forecast
Track real-time and historical methanol prices across global regions. Updated monthly with market insights, drivers, and forecasts.
Methanol Prices June 2026
| Region | Price (USD/KG) | Latest Movement |
|---|---|---|
| Africa | 0.5 | Unchanged |
| Northeast Asia | 0.48 | -7.7% ↓ Down |
| Europe | 0.96 | 4.3% ↑ Up |
| South America | 0.55 | -6.8% ↓ Down |
| Middle East | 0.45 | -21.1% ↓ Down |
| Southeast Asia | 0.54 | -25.0% ↓ Down |
| North America | 1.26 | -8.0% ↓ Down |
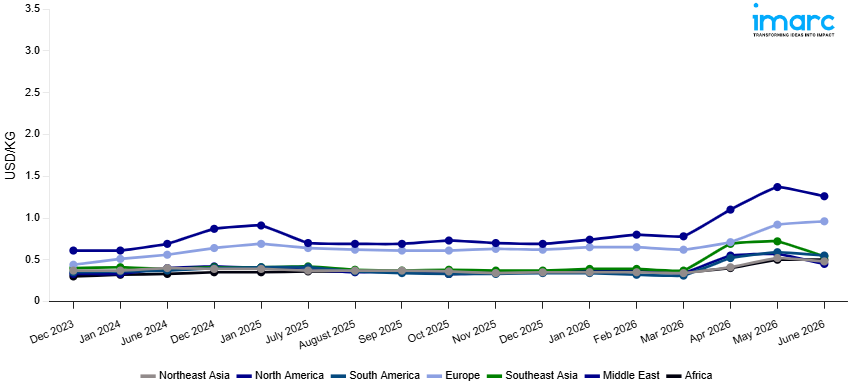
Methanol Price Index (USD/KG):
The chart below highlights monthly methanol prices across different regions.
Get Access to Monthly/Quarterly/Yearly Prices, Request Sample
Market Overview Q1 Ending March 2026
Africa: The methanol prices in Africa reached 0.35 USD/KG in March 2026. The pricing movement between December and March 2026 remained unchanged. Steady demand from the formaldehyde and chemical manufacturing sectors maintained consistent methanol procurement activity across the region throughout the quarter. Stable upstream natural gas feedstock costs in key producing nations, sustained production expenses at existing levels, and provided balanced support to prevailing African market prices. Import cargo availability from Middle Eastern and Asian supply regions remained adequate, offsetting any potential tightening of regional supply conditions. Cautious procurement behavior from downstream buyers, amid limited market moving catalysts, contributed to broadly stable and range bound pricing conditions throughout the review period.
Northeast Asia: The methanol prices in Northeast Asia reached 0.34 USD/KG in March 2026. The downward pricing movement registered between December and March 2026 was 2.9%. A decrease in downstream demand from formaldehyde, acetic acid, and olefins industries led to reduced procurement activity, hence contributing to the weak market conditions. The availability of sufficient local production capacity in China led to an oversupply, hence increased competitiveness among local suppliers. Lower upstream natural gas feedstock costs in the major exporting regions led to lower production costs, thereby reducing support for the local market. The cautious procurement strategies adopted by downstream market players, anticipating continued weak market conditions, only contributed to the region's continued downtrend.
Europe: The methanol prices in Europe reached 0.62 USD/KG in March 2026. The pricing movement between December and March 2026 remained unchanged. Consistent demand from the formaldehyde, biodiesel, and specialty chemical manufacturing sectors maintained steady methanol procurement activity across European markets throughout the review period. Stable upstream natural gas and energy costs at regional production facilities sustained manufacturing expenses at prevailing levels and provided balanced support to European market prices. Import cargo availability from Middle Eastern and North African supplying regions remained sufficient, preventing any significant tightening of regional supply balances. Steady procurement patterns from downstream industrial buyers reflected stable market fundamentals and contributed to rangebound pricing conditions throughout the quarter.
South America: The methanol prices in South America reached 0.31 USD/KG in March 2026. The downward pricing movement registered between December and March 2026 was 8.8%. Subdued demand for formaldehyde and chemical processing dampened methanol procurement activity, sustaining bearish sentiment over the review period. Higher availability of import cargo from competitively priced Middle Eastern and North American supply regions exerted significant downward pressure on the region's ruling market rates. Decreases in natural gas costs, a major feedstock for production, in major supplying nations lowered production costs, negatively impacting regional pricing. Local currency depreciation in major import nations slightly increased import costs, though it did not alter the overall downward pricing trend.
Middle East: The methanol prices in the Middle East reached 0.34 USD/KG in March 2026. The downward pricing movement registered between December and March 2026 was 5.6%. Softening export demand from key Asian and European importing regions reduced methanol offtake volumes and contributed to bearish pricing conditions during the review period. Ample regional production capacity among major Middle Eastern methanol producers generated surplus supply conditions and intensified competitive pricing pressure on prevailing market rates. Declining upstream natural gas feedstock costs at regional production facilities lowered manufacturing expenses and reduced the cost floor supporting existing price levels. Cautious procurement strategies among downstream buyers anticipating further price softness reinforced reduced restocking activity and sustained the prevailing downward pricing trend throughout the quarter.
Southeast Asia: The methanol prices in Southeast Asia reached 0.37 USD/KG in March 2026. The pricing movement between December and March 2026 remained unchanged. Steady market requirements from the formaldehyde, biodiesel, and chemical industries maintained consistent methanol procurement activity in Southeast Asia. Stable upstream natural gas feedstock prices at regional and export nation production sites maintained current levels of industry production costs. This maintained balanced support for current market prices. Favorable levels of import cargo availability were maintained at the Middle Eastern and Northeast Asian supplying regions. These precluded any tightening of regional supply conditions. Steady procurement activity from industrial consumers was maintained with limited directional market catalysts.
North America: The methanol prices in North America reached 0.78 USD/KG in March 2026. The upward pricing movement registered between December and March 2026 was 13.0%. Firm demand from the formaldehyde, biodiesel, and specialty chemical manufacturing sectors drove active methanol procurement and reinforced bullish pricing conditions across North American markets throughout the review period. Rising upstream natural gas feedstock costs at domestic production facilities elevated manufacturing expenses and provided consistent upward support to prevailing regional market rates during the quarter. Tightening domestic methanol production availability amid seasonal plant maintenance outages constrained supply volumes and intensified competition among downstream industrial buyers across the region.
Market Overview Q4 Ending December 2025
Africa: The methanol prices in Africa reached 0.35 USD/KG in December 2025. The downward pricing movement registered between September and December 2025 was 2.9%. The muted demand from the formaldehyde and chemical intermediate production industries, which reduced procurement volumes amid weakening industrial activity across the region, was the main driver of the price drop. Support for regional producers' production costs was further undermined by falling natural gas feedstock prices. While higher stockpile positions among major distributors reduced the need for replenishment, increased import availability from competitively priced cargoes further pushed down current market costs.
Northeast Asia: The methanol prices in Northeast Asia reached 0.35 USD/KG in December 2025. The downward pricing movement registered between September and December 2025 was 5.7%. The notable price decline was driven by weakened downstream demand from the methanol-to-olefins, formaldehyde, and acetic acid manufacturing sectors amid subdued petrochemical industry activity across the region. Softening upstream coal and natural gas feedstock costs further diminished production cost benchmarks for regional manufacturers. Elevated inventory levels among major producers intensified competitive discounting strategies to accelerate stock clearance, while surplus production capacity from recently commissioned facilities amplified supply-side pressure.
Europe: The methanol prices in Europe reached 0.62 USD/KG in December 2025. The upward pricing movement registered between September and December 2025 was 2.4%. The moderate price appreciation was underpinned by escalating natural gas feedstock costs across the region, which significantly elevated production expenses for domestic methanol manufacturers. Sustained demand from the formaldehyde, MTBE, and biodiesel blending sectors maintained robust procurement activity throughout the quarter. Tightened supply conditions, driven by capacity constraints and scheduled maintenance turnarounds at key production facilities, further limited regional availability. Additionally, elevated energy and logistics costs reinforced upward cost pressures across the supply chain, while controlled production output from established manufacturers prevented market oversaturation, thereby maintaining moderately bullish pricing momentum throughout the quarter.
South America: The methanol prices in South America reached 0.34 USD/KG in December 2025. The downward pricing movement registered between September and December 2025 was 1.2%. The marginal price decline reflected subdued demand from the formaldehyde and chemical processing sectors amid moderating industrial manufacturing activity across the region. Adequate supply availability from domestic production facilities and competitively priced import cargoes maintained comfortable market volumes, limiting upward pricing support. Softening upstream natural gas feedstock costs provided diminished production cost benchmarks for regional manufacturers. Elevated stockpile positions among key distributors reduced restocking urgency, while conservative procurement strategies adopted by downstream consumers anticipating stable pricing conditions restricted purchasing competition, sustaining mildly bearish yet largely stable market conditions throughout the quarterly period.
Middle East: The methanol prices in the Middle East reached 0.36 USD/KG in December 2025. The upward pricing movement registered between September and December 2025 was 1.0%. Consistent procurement activity throughout the quarter was maintained by stable export demand from conventional importing destinations, which supported the marginal price increase. Access to inexpensive natural gas feedstock gave regional industries a competitive edge, supporting steady pricing by preserving solid production margins. While limited domestic consumption from the formaldehyde and fuel blending sectors preserved baseline offtake fundamentals, controlled production output from established mega-methanol facilities ensured balanced supply availability.
Southeast Asia: The methanol prices in Southeast Asia reached 0.37 USD/KG in December 2025. The upward pricing movement registered between September and December 2025 was 0.1%. The negligible price increase reflected a predominantly balanced market environment, with equilibrium between supply and demand fundamentals across the region. Moderate consumption from the formaldehyde, biodiesel, and solvent manufacturing sectors maintained consistent procurement activity, while adequate production output and steady import flows ensured comfortable supply availability. Firm upstream natural gas feedstock costs provided marginal pricing support for regional producers, while balanced inventory positions among key distributors limited significant pricing fluctuations, contributing to near-flat market conditions throughout the quarter.
North America: The methanol prices in North America reached 0.69 USD/KG in December 2025. The downward pricing movement registered between September and December 2025 was 0.3%. The minor price drop indicated a mostly stable market, with moderate demand from the formaldehyde, MTBE, and gasoline blending sectors, maintaining consistent procurement volumes throughout the quarter. Abundant domestic natural gas availability kept feedstock costs competitive for regional producers, while appropriate production capacity assured stable supply levels throughout the distribution network. Consistent consumption from the adhesives and coatings manufacturing segments-maintained baseline offtake fundamentals, while equilibrium between supply availability and downstream requirements limited significant pricing fluctuation, resulting in predominantly flat market conditions over the quarter.
Market Overview Q3 Ending September 2025
Africa: Methanol prices in Africa edged higher as stronger demand from formaldehyde and acetic acid producers supported procurement activity. Stable production levels ensured adequate supply, but downstream industries in construction and resins increased their purchasing volumes, lifting sentiment. The methanol price index reflected healthy consumption trends, particularly in urban infrastructure projects. Import flows remained balanced, with domestic refiners catering to most needs, allowing the market to register modest but steady price gains this quarter.
Northeast Asia: In Northeast Asia, methanol prices recorded a slight increase due to improved buying from the chemical intermediates sector. Demand from olefins and resins provided support, while moderate plant turnarounds tightened supply in certain areas. The methanol price index indicated steady procurement from downstream manufacturers, although competitive market conditions kept price gains limited. Additional uplift came from marginally higher feedstock costs, with traders cautiously optimistic about demand stability across industrial applications.
Europe: Methanol prices in Europe fell as ample availability and weaker downstream consumption weighed on sentiment. Softer demand from biodiesel and formaldehyde producers limited buying activity, while steady imports ensured oversupply conditions. The methanol price index highlighted muted procurement trends, with downstream sectors hesitant to expand orders amid uncertain economic conditions. Declining crude oil values also reinforced bearish fundamentals, leaving regional prices under consistent downward pressure during the quarter.
South America: In South America, methanol prices decreased as slower demand from industrial and fuel-blending applications dampened procurement. Ample availability from local plants and imports contributed to competitive conditions, further pressuring prices. The methanol price index showed a clear dip in buying momentum, particularly in the construction and automotive sectors. Seasonal weakness in certain industries added to bearish sentiment, curbing market support despite generally steady supply levels across the region.
Middle East: Methanol prices in the Middle East rose, supported by firm demand from the petrochemical and fuel additive industries. Rising export orders added momentum, while planned maintenance at select facilities restricted supply in certain hubs. The methanol price index reflected strong regional consumption patterns, with buyers showing increased willingness to secure volumes. Higher crude oil values also lent support, reinforcing a bullish trend across the Middle Eastern methanol market during the quarter.
Southeast Asia: In Southeast Asia, methanol prices moved lower as abundant regional production and steady imports created oversupply. Demand from formaldehyde and olefins remained subdued, weighing on procurement sentiment. The methanol price index indicated softer market activity, with downstream sectors cautious in their buying strategies. Economic uncertainties further limited industrial consumption, leaving methanol prices under consistent downward pressure throughout the quarter.
North America: Methanol prices in North America held mostly steady, with only a marginal decline, as balanced supply and demand kept markets stable. Ample domestic production ensured adequate availability, while demand from chemicals and fuel applications remained steady but not exceptionally strong. The methanol price index showed moderate activity, with no significant fluctuations in downstream orders. Lower energy input costs prevented any notable upward trend, resulting in flat-to-slightly lower pricing across the quarter.
Methanol Price Trend, Market Analysis, and News
IMARC's latest publication, “Methanol Prices, Trend, Chart, Demand, Market Analysis, News, Historical and Forecast Data Report 2026 Edition,” presents a detailed examination of the methanol market, providing insights into both global and regional trends that are shaping prices. This report delves into the spot price of methanol at major ports and analyzes the composition of prices, including FOB and CIF terms. It also presents detailed methanol prices trend analysis by region, covering North America, Europe, Asia Pacific, Latin America, and Middle East and Africa. The factors affecting methanol pricing, such as the dynamics of supply and demand, geopolitical influences, and sector-specific developments, are thoroughly explored. This comprehensive report helps stakeholders stay informed with the latest market news, regulatory updates, and technological progress, facilitating informed strategic decision-making and forecasting.
Methanol Industry Analysis
The global methanol industry size reached USD 39.64 Billion in 2025. By 2034, IMARC Group expects the market to reach USD 57.31 Billion, at a projected CAGR of 4.18% during 2026-2034. The market is driven by the rising demand in clean energy (as fuel and in fuel cells), expanding usage in chemical intermediates, increased adoption of methanol to olefins (MTO) technology, and growing interest in sustainable feedstocks such as biomethanol.
Latest developments in the Methanol industry:
- May 2025: The Kassø e-methanol facility in Aabenraa, Denmark officially commenced operations and begun delivering e-methanol to its commercial offtakers. The plant was developed by European Energy A/S and is operated in partnership with Mitsui & Co., reflecting a strategic collaboration between European and global energy players.
- November 2024: On NTPC's 50th Raising Day, the company launched the world's first CO₂-to-methanol conversion plant at its Vindhyachal facility. NTPC Chairman Gurdeep Singh said the company was well on the path in terms of its green technologies such as hydrogen, carbon capture, and indigenous development of methanol synthesis catalysts.
- October 2024: Transition Industries LLC executed a Letter of Intent (LOI) with Mitsubishi Gas Chemical Company, Inc. (MGC) for a long-term Methanol Sales Agreement. Transition Industries will sell MGC 1 million MT per annum of ultra-low carbon methanol from its Pacifico Mexinol project in Sinaloa, Mexico, slated to come onstream in 2028.
- October 2024: Maersk signs long-term bio-methanol offtake deal with LONGi Green Energy. This agreement will bring Maersk closer to reducing the greenhouse gas emission from its dual-fuel methanol vessels. Deliveries are expected to take place starting in 2026.
- June 2024: Mitshubishi Gas Chemical declared that it became Japan's first manufacturer to be capable of producing bio-methanol from digester gas at its Niigata Plant following the utilization-gas partnership agreement with Niigata Prefecture. Its certification is ISCC PLUS- the bio-methanol, which would be for the purpose of contributing toward decarbonization and producing environmentally responsible chemicals.
- February 2023: BASF SE signed an agreement with Linde Engineering to develop a new process for producing methanol from carbon dioxide. The process uses renewable energy sources, such as wind and solar power, to convert carbon dioxide into methanol, which can then be used as a fuel or chemical feedstock.
Product Description
Methanol (CH₃OH) is a volatile, colorless, liquid chemical classified as the simplest alcohol. It serves as a key feedstock in the global chemical industry, ranking among the most produced and utilized commodity chemicals. Renowned for its high reactivity and multipurpose nature, methanol is extensively used in formaldehyde and acetic acid synthesis, fuel blending (e.g., biodiesel and marine fuel), and as a precursor in plastics, resins, solvents, and MTO (methanol-to-olefins) processes. It enhances product performance by offering clean-burning fuel alternatives and efficient, versatile chemical processing pathways, supporting both industrial production and environmental objectives.
Report Coverage
| Key Attributes | Details |
|---|---|
| Product Name | Methanol |
| Report Features | Exploration of Historical Trends and Market Outlook, Industry Demand, Industry Supply, Gap Analysis, Challenges, Methanol Price Analysis, and Segment-Wise Assessment. |
| Currency/Units | US$ (Data can also be provided in local currency) or Metric Tons |
| Region/Countries Covered | The current coverage includes analysis at the global and regional levels only. Based on your requirements, we can also customize the report and provide specific information for the following countries: Asia Pacific: China, India, Indonesia, Pakistan, Bangladesh, Japan, Philippines, Vietnam, Thailand, South Korea, Malaysia, Nepal, Taiwan, Sri Lanka, Hongkong, Singapore, Australia, and New Zealand Europe: Germany, France, United Kingdom, Italy, Spain, Russia, Turkey, Netherlands, Poland, Sweden, Belgium, Austria, Ireland, Switzerland, Norway, Denmark, Romania, Finland, Czech Republic, Portugal and Greece North America: United States and Canada Latin America: Brazil, Mexico, Argentina, Columbia, Chile, Ecuador, and Peru Middle East & Africa: Saudi Arabia, UAE, Israel, Iran, South Africa, Nigeria, Oman, Kuwait, Qatar, Iraq, Egypt, Algeria, and Morocco The list of countries presented is not exhaustive. Information on additional countries can be provided if required by the client. |
| Information Covered for Key Suppliers |
|
| Customization Scope | The report can be customized as per the requirements of the customer |
| Report Price and Purchase Option |
Plan A: Monthly Updates - Annual Subscription
Plan B: Quarterly Updates - Annual Subscription
Plan C: Biannually Updates - Annual Subscription
Includes: One PDF and Excel datasheet per Half, Post Purchase Analyst Support throughout the year |
| Post-Sale Analyst Support | 360-degree analyst support after report delivery |
| Delivery Format | PDF and Excel through email (We can also provide the editable version of the report in PPT/Word format on special request) |
Key Benefits for Stakeholders:
- IMARC’s report presents a detailed analysis of methanol pricing, covering global and regional trends, spot prices at key ports, and a breakdown of FOB and CIF prices.
- The study examines factors affecting methanol price trend, including input costs, supply-demand shifts, and geopolitical impacts, offering insights for informed decision-making.
- The competitive landscape review equips stakeholders with crucial insights into the latest market news, regulatory changes, and technological advancements, ensuring a well-rounded, strategic overview for forecasting and planning.
- IMARC offers various subscription options, including monthly, quarterly, and biannual updates, allowing clients to stay informed with the latest market trends, ongoing developments, and comprehensive market insights. The methanol price charts ensure our clients remain at the forefront of the industry.
Frequently Asked Questions About the Methanol Price Trend Report
The methanol prices in June 2026 were 0.5 USD/Kg in Africa, 0.48 USD/Kg in Northeast Asia, 0.96 USD/Kg in Europe, 0.55 USD/Kg in South America, 0.45 USD/Kg in Middle East, 0.54 USD/Kg in Southeast Asia, and 1.26 USD/Kg in North America.
The methanol prices data is updated on a monthly basis.
We provide the pricing data primarily in the form of an Excel sheet and a PDF.
Yes, our report includes a forecast for methanol prices.
The regions covered include North America, Europe, Asia Pacific, Middle East, and Latin America. Countries can be customized based on the request (additional charges may be applicable).
Yes, we provide both FOB and CIF prices in our report.
Need more help?
- Speak to our experienced analysts for insights on the current market scenarios.
- Include additional segments and countries to customize the report as per your requirement.
- Gain an unparalleled competitive advantage in your domain by understanding how to utilize the report and positively impacting your operations and revenue.
- For further assistance, please connect with our analysts.
 Request Customization
 Inquire Before Buying
 Speak to an Analyst
 Request Brochure
Benefits of Customization
- Personalize this research
- Triangulate with your data
- Get data as per your format and definition
- Gain a deeper dive into a specific application, geography, customer, or competitor
- Any level of personalization
Get in Touch With Us
UNITED STATES
Phone: +1-201-971-6302
INDIA
Phone: +91-120-433-0800
UNITED KINGDOM
Phone: +44-753-714-6104
Email: [email protected]
Client Testimonials


.webp)


Why Choose Us
IMARC offers trustworthy, data-centric insights into commodity pricing and evolving market trends, enabling businesses to make well-informed decisions in areas such as procurement, strategic planning, and investments. With in-depth knowledge spanning more than 1000 commodities and a vast global presence in over 150 countries, we provide tailored, actionable intelligence designed to meet the specific needs of diverse industries and markets.
1000
+Commodities
150
+Countries Covered
3000
+Clients
20
+Industry
Robust Methodologies & Extensive Resources
IMARC delivers precise commodity pricing insights using proven methodologies and a wealth of data to support strategic decision-making.
Subscription-Based Databases
Our extensive databases provide detailed commodity pricing, import-export trade statistics, and shipment-level tracking for comprehensive market analysis.
Primary Research-Driven Insights
Through direct supplier surveys and expert interviews, we gather real-time market data to enhance pricing accuracy and trend forecasting.
Extensive Secondary Research
We analyze industry reports, trade publications, and market studies to offer tailored intelligence and actionable commodity market insights.
Trusted by 3000+ industry leaders worldwide to drive data-backed decisions. From global manufacturers to government agencies, our clients rely on us for accurate pricing, deep market intelligence, and forward-looking insights.