
Monoammonium Phosphate (MAP) Prices, Trend, Chart, Demand, Market Analysis, News, Historical and Forecast Data Report 2026 Edition
Monoammonium Phosphate (MAP) Price Trend, Index and Forecast
Track real-time and historical monoammonium phosphate (MAP) prices across global regions. Updated monthly with market insights, drivers, and forecasts.
Monoammonium Phosphate (MAP) Prices June 2026
| Region | Price (USD/Kg) | Latest Movement |
|---|---|---|
| Northeast Asia | 0.59 | -6.3% ↓ Down |
| Europe | 1.05 | -6.3% ↓ Down |
| North America | 0.72 | -5.3% ↓ Down |
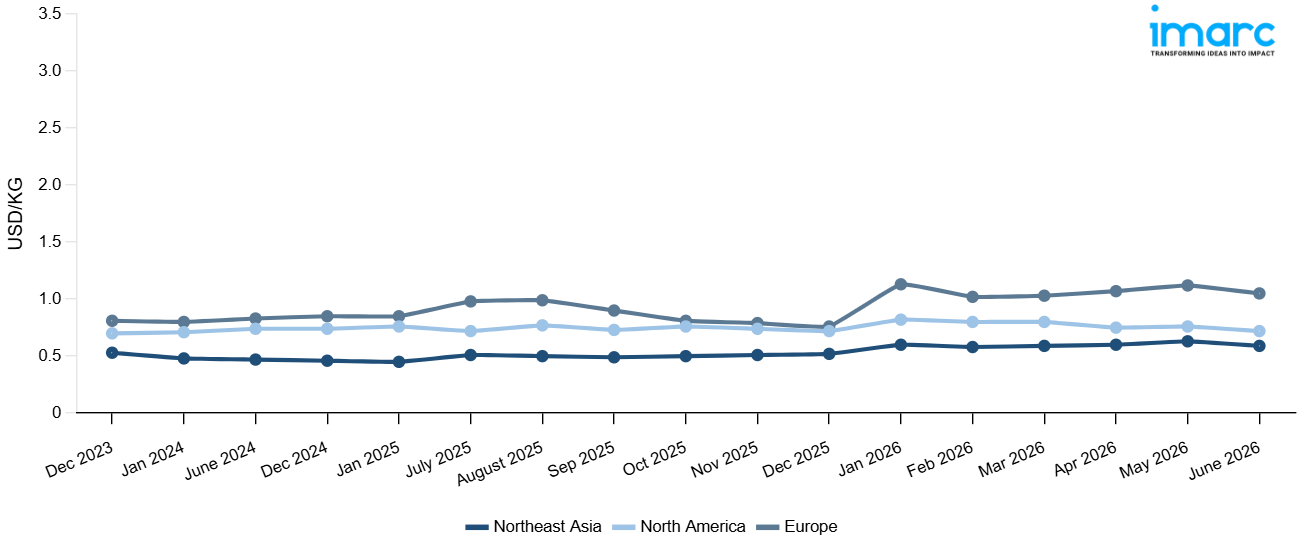
Monoammonium Phosphate (MAP) Price Index (USD/KG):
The chart below highlights monthly , monoammonium phosphate (MAP) prices across different regions.
Get Access to Monthly/Quaterly/Yearly Prices, Request Sample
Market Overview Q3 Ending September 2025
Northeast Asia: In Northeast Asia, MAP prices declined slightly, with the keyword price index reflecting softer procurement activity. Demand from the fertilizer sector remained moderate as agricultural cycles entered a less active phase, while feedstock availability from ammonia and phosphoric acid production stayed sufficient. Export competitiveness weakened, with limited traction in overseas orders. Although production remained stable, subdued downstream demand restrained any upward pricing momentum. Market participants were cautious, with buyers delaying large-scale purchases in anticipation of further easing in values.
Europe: Europe witnessed a sharper fall in MAP prices, as the keyword price index slipped amid weak consumption from the agriculture and specialty fertilizer sectors. Ample supply availability, combined with muted seasonal farming demand, exerted strong downward pressure on pricing. Lower raw material costs further reduced support for market stability. Imports remained competitive, adding to domestic price weakness and squeezing producer margins. With the fertilizer off-season weighing on activity, distributors operated with reduced procurement volumes, intensifying bearish sentiment across the regional market.
North America: In North America, MAP prices also trended lower, as the keyword price index registered a decline consistent with sluggish demand patterns. Reduced consumption from agriculture was the primary driver, as farmers moderated purchases ahead of the next cropping season. Domestic supply levels remained steady, while logistical bottlenecks were minimal, ensuring sufficient product availability. Imports from overseas markets introduced additional competition, exerting pressure on local values. Market players adopted a cautious stance, with price adjustments reflecting the subdued sentiment and limited downstream pull.
Monoammonium Phosphate (MAP) Price Trend, Market Analysis, and News
IMARC's latest publication, “Monoammonium Phosphate (MAP) Prices, Trend, Chart, Demand, Market Analysis, News, Historical and Forecast Data Report 2026 Edition,” presents a detailed examination of the monoammonium phosphate (MAP) market, providing insights into both global and regional trends that are shaping prices. This report delves into the spot price of monoammonium phosphate (MAP) at major ports and analyzes the composition of prices, including FOB and CIF terms. It also presents detailed monoammonium phosphate (MAP) prices trend analysis by region, covering North America, Europe, Asia Pacific, Latin America, and Middle East and Africa. The factors affecting monoammonium phosphate (MAP) pricing, such as the dynamics of supply and demand, geopolitical influences, and sector-specific developments, are thoroughly explored. This comprehensive report helps stakeholders stay informed with the latest market news, regulatory updates, and technological progress, facilitating informed strategic decision-making and forecasting.
Monoammonium Phosphate (MAP) Industry Analysis
The global monoammonium phosphate (MAP) industry size reached USD 18.90 Billion in 2025. By 2034, IMARC Group expects the market to reach USD 27.60 Billion, at a projected CAGR of 4.09% during 2026-2034. The growth is primarily supported by rising demand for high-efficiency fertilizers, expanding global food requirements, and sustained government initiatives to enhance crop yields through nutrient-rich inputs.
Latest developments in the Monoammonium Phosphate (MAP) Industry:
- May 2025: OCP Nutricrops, a subsidiary of Morocco’s OCP Group, announced plans to boost its phosphate fertilizer output by 9 million tonnes by 2028 through new mining and industrial hubs in Mzinda (Youssoufia) and Meskala (Essaouira). This expansion is expected to significantly strengthen global phosphate supply and support growing demand for phosphate-based fertilizers such as MAP.
- May 2024: Ma'aden, a company from Saudi Arabia, is set to purchase Mosaic's 25% share in their joint venture, Ma'aden Wa'ad Al Shamal Phosphate Company (MWSPC), by issuing about 111 million new shares for $1.5 billion. This purchase will increase Ma'aden's ownership in MWSPC from 60% to 85%, improving its phosphate production capacity.
Product Description
Monoammonium phosphate (MAP) is a widely used phosphate fertilizer containing a high concentration of phosphorus and nitrogen. Chemically, it is produced by reacting ammonia with phosphoric acid, resulting in a crystalline solid that is highly water soluble. MAP is valued for its high nutrient content and compatibility with a variety of crops, making it suitable for both direct soil application and blending with other fertilizers. Its low nitrogen-to-phosphorus ratio makes it particularly effective for early plant growth and root development. Beyond agriculture, MAP is also utilized in industrial applications such as flame retardants and dry chemical fire extinguishers. Its versatility, ease of handling, and strong agronomic value ensure its widespread adoption in global farming practices.
Report Coverage
| Key Attributes | Details |
|---|---|
| Product Name | Monoammonium Phosphate (MAP) |
| Report Features | Exploration of Historical Trends and Market Outlook, Industry Demand, Industry Supply, Gap Analysis, Challenges, Monoammonium phosphate (MAP) Price Analysis, and Segment-Wise Assessment. |
| Currency/Units | US$ (Data can also be provided in local currency) or Metric Tons |
| Region/Countries Covered | The current coverage includes analysis at the global and regional levels only. Based on your requirements, we can also customize the report and provide specific information for the following countries: Asia Pacific: China, India, Indonesia, Pakistan, Bangladesh, Japan, Philippines, Vietnam, Thailand, South Korea, Malaysia, Nepal, Taiwan, Sri Lanka, Hongkong, Singapore, Australia, and New Zealand* Europe: Germany, France, United Kingdom, Italy, Spain, Russia, Turkey, Netherlands, Poland, Sweden, Belgium, Austria, Ireland, Switzerland, Norway, Denmark, Romania, Finland, Czech Republic, Portugal and Greece* North America: United States and Canada Latin America: Brazil, Mexico, Argentina, Columbia, Chile, Ecuador, and Peru* Middle East & Africa: Saudi Arabia, UAE, Israel, Iran, South Africa, Nigeria, Oman, Kuwait, Qatar, Iraq, Egypt, Algeria, and Morocco* *The list of countries presented is not exhaustive. Information on additional countries can be provided if required by the client. |
| Information Covered for Key Suppliers |
|
| Customization Scope | The report can be customized as per the requirements of the customer |
| Report Price and Purchase Option |
Plan A: Monthly Updates - Annual Subscription
Plan B: Quarterly Updates - Annual Subscription
Plan C: Biannually Updates - Annual Subscription
|
| Post-Sale Analyst Support | 360-degree analyst support after report delivery |
| Delivery Format | PDF and Excel through email (We can also provide the editable version of the report in PPT/Word format on special request) |
Key Benefits for Stakeholders:
- IMARC’s report presents a detailed analysis of monoammonium phosphate (MAP) pricing, covering global and regional trends, spot prices at key ports, and a breakdown of Ex Works, FOB, and CIF prices.
- The study examines factors affecting monoammonium phosphate (MAP) price trend, including raw material costs, supply-demand shifts, geopolitical impacts, and industry developments, offering insights for informed decision-making.
- The competitive landscape review equips stakeholders with crucial insights into the latest market news, regulatory changes, and technological advancements, ensuring a well-rounded, strategic overview for forecasting and planning.
- IMARC offers various subscription options, including monthly, quarterly, and biannual updates, allowing clients to stay informed with the latest market trends, ongoing developments, and comprehensive market insights. The monoammonium phosphate (MAP) price charts ensure our clients remain at the forefront of the industry.
Frequently Asked Questions About the Monoammonium Phosphate (MAP) Price Trend Report
The monoammonium phosphate (MAP) prices in June 2026 were 0.59 USD/KG in Northeast Asia, 1.05 USD/KG in Europe, and 0.72 USD/KG in North America.
The monoammonium phosphate (MAP) pricing data is updated on a monthly basis.
We provide the pricing data primarily in the form of an Excel sheet and a PDF.
Yes, our report includes a forecast for monoammonium phosphate (MAP) prices.
The regions covered include North America, Europe, Asia Pacific, Middle East, and Latin America. Countries can be customized based on the request (additional charges may be applicable).
Yes, we provide both FOB and CIF prices in our report.
Need more help?
- Speak to our experienced analysts for insights on the current market scenarios.
- Include additional segments and countries to customize the report as per your requirement.
- Gain an unparalleled competitive advantage in your domain by understanding how to utilize the report and positively impacting your operations and revenue.
- For further assistance, please connect with our analysts.
 Request Customization
 Inquire Before Buying
 Speak to an Analyst
 Request Brochure
Benefits of Customization
- Personalize this research
- Triangulate with your data
- Get data as per your format and definition
- Gain a deeper dive into a specific application, geography, customer, or competitor
- Any level of personalization
Get in Touch With Us
UNITED STATES
Phone: +1-201-971-6302
INDIA
Phone: +91-120-433-0800
UNITED KINGDOM
Phone: +44-753-714-6104
Email: [email protected]
Client Testimonials


.webp)


Related Reports
Why Choose Us
IMARC offers trustworthy, data-centric insights into commodity pricing and evolving market trends, enabling businesses to make well-informed decisions in areas such as procurement, strategic planning, and investments. With in-depth knowledge spanning more than 1000 commodities and a vast global presence in over 150 countries, we provide tailored, actionable intelligence designed to meet the specific needs of diverse industries and markets.
1000
+Commodities
150
+Countries Covered
3000
+Clients
20
+Industry
Robust Methodologies & Extensive Resources
IMARC delivers precise commodity pricing insights using proven methodologies and a wealth of data to support strategic decision-making.
Subscription-Based Databases
Our extensive databases provide detailed commodity pricing, import-export trade statistics, and shipment-level tracking for comprehensive market analysis.
Primary Research-Driven Insights
Through direct supplier surveys and expert interviews, we gather real-time market data to enhance pricing accuracy and trend forecasting.
Extensive Secondary Research
We analyze industry reports, trade publications, and market studies to offer tailored intelligence and actionable commodity market insights.
Trusted by 3000+ industry leaders worldwide to drive data-backed decisions. From global manufacturers to government agencies, our clients rely on us for accurate pricing, deep market intelligence, and forward-looking insights.