Market Overview:
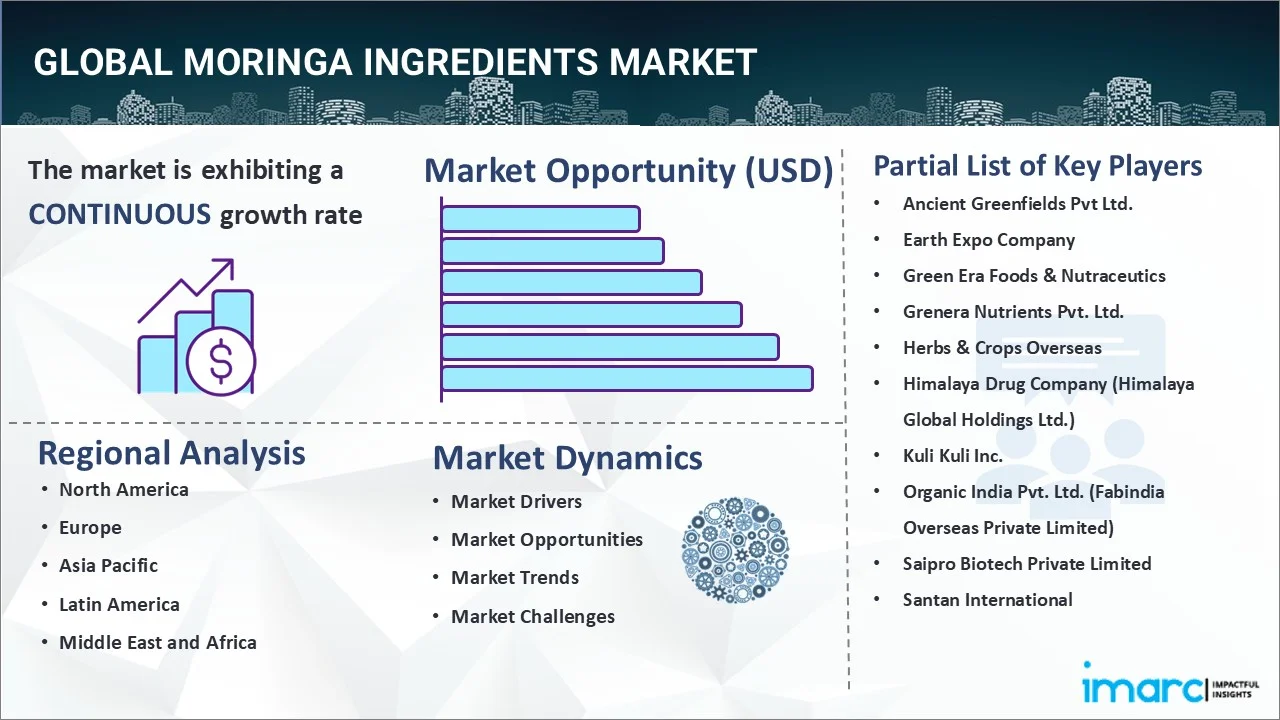
The global moringa ingredients market grew at a CAGR of around 5% during 2015-2020. Looking forward, IMARC Group expects the market to exhibit moderate growth during 2021-2026. Keeping in mind the uncertainties of COVID-19, we are continuously tracking and evaluating the direct as well as the indirect influence of the pandemic on different end use industries. These insights are included in the report as a major market contributor.
Moringa ingredients are obtained from the genus of shrubs and trees whose components like nuts, pods, seeds, roots, barks, leaves and flowers are suitable for human consumption. Amongst these, leaves contain bioactive compounds, which are used fresh, dried or in powdered form in different food recipes. Moreover, flowers are considered aphrodisiac and useful for treating hysteria, muscle pain, splenomegaly, and tumors, while pods are consumed as vegetables. As moringa ingredients possess analgesic, hypo-tensive and glycemic, and anti-inflammatory, microbial, bacterial, and oxidant activities, they find extensive application in the production of medications for diabetes, hypertension and human immunodeficiency virus (HIV).
The growing awareness about the health benefits associated with moringa ingredients is increasing their usage in the food and beverage (F&B) industry worldwide for preparing tea, curries, sauces, and salad dressing. Their demand is also supported by their usefulness in enhancing the nutritional content of different animal feeds and crops. Besides this, as moringa seed oil is sweet and resistant to rancidity, it finds applications in the manufacturing of perfumes, paints, lubricants and biodiesel, and purification of drinking water. Moringa ingredients are also used to produce fiber for ropes and mats and pulp for papers. Moreover, several scientific studies support that moringa trees grow faster and better in arid areas and plays a prominent role against desertification. This is resulting in their rising utilization for supporting global food security and minimizing malnutrition. Furthermore, the increasing adoption of moringa ingredients in reducing body weight, decreasing adiposity, improving glucose tolerance and slowing several cancer cells is anticipated to drive the market.
Key Market Segmentation:
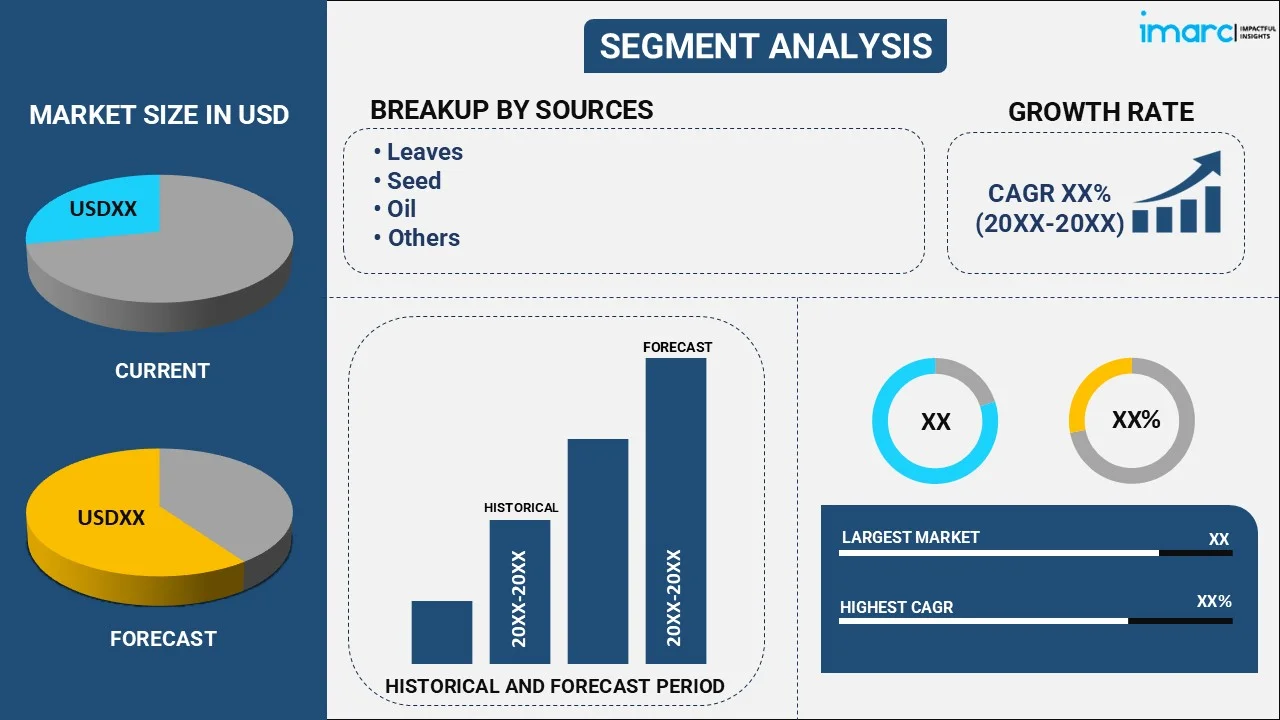
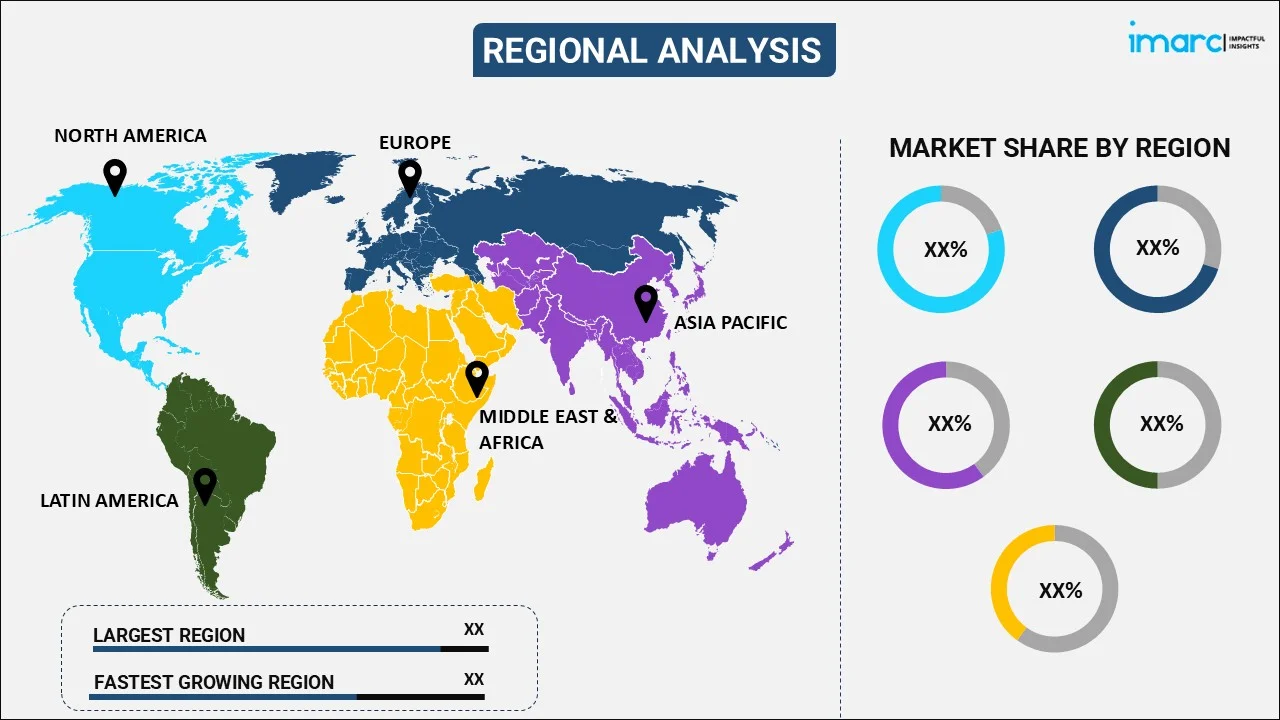
IMARC Group provides an analysis of the key trends in each sub-segment of the global moringa ingredients market, along with forecasts at the global, regional and country level from 2021-2026. Our report has categorized the market based on source, application and distribution channel.
Breakup by Source:
Breakup by Application:
- Food and Beverages
- Cosmetics and Personal Care
- Pharmaceuticals
- Others
Breakup by Distribution Channel:
- Supermarkets
- Online Stores
- Specialty Stores
- Others
Breakup by Region:
- North America
- Asia-Pacific
- China
- Japan
- India
- South Korea
- Australia
- Indonesia
- Others
- Europe
- Germany
- France
- United Kingdom
- Italy
- Spain
- Russia
- Others
- Latin America
- Middle East and Africa
Competitive Landscape:
The competitive landscape of the industry has also been examined along with the profiles of the key players being Ancient Greenfields Pvt Ltd., Earth Expo Company, Green Era Foods & Nutraceutics, Grenera Nutrients Pvt. Ltd., Herbs & Crops Overseas, Himalaya Drug Company (Himalaya Global Holdings Ltd.), Kuli Kuli Inc., Organic India Pvt. Ltd. (Fabindia Overseas Private Limited), Saipro Biotech Private Limited and Santan International.
Report Coverage:
Report Features |
Details |
---|
Base Year of the Analysis |
2020 |
Historical Period |
2015-2020 |
Forecast Period |
2021-2026 |
Units |
US$ Billion |
Segment Coverage |
Source, Application, Distribution Channel, Region |
Region Covered |
Asia Pacific, Europe, North America, Latin America, Middle East and Africa |
Countries Covered |
United States, Canada, Germany, France, United Kingdom, Italy, Spain, Russia, China, Japan, India, South Korea, Australia, Indonesia, Brazil, Mexico |
Companies Covered |
Ancient Greenfields Pvt Ltd., Earth Expo Company, Green Era Foods & Nutraceutics, Grenera Nutrients Pvt. Ltd., Herbs & Crops Overseas, Himalaya Drug Company (Himalaya Global Holdings Ltd.), Kuli Kuli Inc., Organic India Pvt. Ltd. (Fabindia Overseas Private Limited), Saipro Biotech Private Limited and Santan International |
Customization Scope |
10% Free Customization |
Report Price and Purchase Option |
Single User License: US$ 2299
Five User License: US$ 3399
Corporate License: US$ 4499 |
Post-Sale Analyst Support |
10-12 Weeks |
Delivery Format |
PDF and Excel through Email (We can also provide the editable version of the report in PPT/Word format on special request) |
Key Questions Answered in This Report:
- How has the global moringa ingredients market performed so far and how will it perform in the coming years?
- What has been the impact of COVID-19 on the global moringa ingredients market?
- What are the key regional markets?
- What is the breakup of the market based on the sources?
- What is the breakup of the market based on the application?
- What is the breakup of the market based on the distribution channel?
- What are the various stages in the value chain of the industry?
- What are the key driving factors and challenges in the industry?
- What is the structure of the global moringa ingredients market and who are the key players?
- What is the degree of competition in the industry?
1 Preface
2 Scope and Methodology
2.1 Objectives of the Study
2.2 Stakeholders
2.3 Data Sources
2.3.1 Primary Sources
2.3.2 Secondary Sources
2.4 Market Estimation
2.4.1 Bottom-Up Approach
2.4.2 Top-Down Approach
2.5 Forecasting Methodology
3 Executive Summary
4 Introduction
4.1 Overview
4.2 Key Industry Trends
5 Global Moringa Ingredients Market
5.1 Market Overview
5.2 Market Performance
5.3 Impact of COVID-19
5.4 Market Forecast
6 Market Breakup by Source
6.1 Leaves
6.1.1 Market Trends
6.1.2 Market Forecast
6.2 Seed
6.2.1 Market Trends
6.2.2 Market Forecast
6.3 Oil
6.3.1 Market Trends
6.3.2 Market Forecast
6.4 Others
6.4.1 Market Trends
6.4.2 Market Forecast
7 Market Breakup by Application
7.1 Food and Beverages
7.1.1 Market Trends
7.1.2 Market Forecast
7.2 Cosmetics and Personal Care
7.2.1 Market Trends
7.2.2 Market Forecast
7.3 Pharmaceuticals
7.3.1 Market Trends
7.3.2 Market Forecast
7.4 Others
7.4.1 Market Trends
7.4.2 Market Forecast
8 Market Breakup by Distribution Channel
8.1 Supermarkets
8.1.1 Market Trends
8.1.2 Market Forecast
8.2 Online Stores
8.2.1 Market Trends
8.2.2 Market Forecast
8.3 Specialty Stores
8.3.1 Market Trends
8.3.2 Market Forecast
8.4 Others
8.4.1 Market Trends
8.4.2 Market Forecast
9 Market Breakup by Region
9.1 North America
9.1.1 United States
9.1.1.1 Market Trends
9.1.1.2 Market Forecast
9.1.2 Canada
9.1.2.1 Market Trends
9.1.2.2 Market Forecast
9.2 Asia-Pacific
9.2.1 China
9.2.1.1 Market Trends
9.2.1.2 Market Forecast
9.2.2 Japan
9.2.2.1 Market Trends
9.2.2.2 Market Forecast
9.2.3 India
9.2.3.1 Market Trends
9.2.3.2 Market Forecast
9.2.4 South Korea
9.2.4.1 Market Trends
9.2.4.2 Market Forecast
9.2.5 Australia
9.2.5.1 Market Trends
9.2.5.2 Market Forecast
9.2.6 Indonesia
9.2.6.1 Market Trends
9.2.6.2 Market Forecast
9.2.7 Others
9.2.7.1 Market Trends
9.2.7.2 Market Forecast
9.3 Europe
9.3.1 Germany
9.3.1.1 Market Trends
9.3.1.2 Market Forecast
9.3.2 France
9.3.2.1 Market Trends
9.3.2.2 Market Forecast
9.3.3 United Kingdom
9.3.3.1 Market Trends
9.3.3.2 Market Forecast
9.3.4 Italy
9.3.4.1 Market Trends
9.3.4.2 Market Forecast
9.3.5 Spain
9.3.5.1 Market Trends
9.3.5.2 Market Forecast
9.3.6 Russia
9.3.6.1 Market Trends
9.3.6.2 Market Forecast
9.3.7 Others
9.3.7.1 Market Trends
9.3.7.2 Market Forecast
9.4 Latin America
9.4.1 Brazil
9.4.1.1 Market Trends
9.4.1.2 Market Forecast
9.4.2 Mexico
9.4.2.1 Market Trends
9.4.2.2 Market Forecast
9.4.3 Others
9.4.3.1 Market Trends
9.4.3.2 Market Forecast
9.5 Middle East and Africa
9.5.1 Market Trends
9.5.2 Market Breakup by Country
9.5.3 Market Forecast
10 SWOT Analysis
10.1 Overview
10.2 Strengths
10.3 Weaknesses
10.4 Opportunities
10.5 Threats
11 Value Chain Analysis
12 Porters Five Forces Analysis
12.1 Overview
12.2 Bargaining Power of Buyers
12.3 Bargaining Power of Suppliers
12.4 Degree of Competition
12.5 Threat of New Entrants
12.6 Threat of Substitutes
13 Price Analysis
14 Competitive Landscape
14.1 Market Structure
14.2 Key Players
14.3 Profiles of Key Players
14.3.1 Ancient Greenfields Pvt Ltd.
14.3.1.1 Company Overview
14.3.1.2 Product Portfolio
14.3.2 Earth Expo Company
14.3.2.1 Company Overview
14.3.2.2 Product Portfolio
14.3.3 Green Era Foods & Nutraceutics
14.3.3.1 Company Overview
14.3.3.2 Product Portfolio
14.3.4 Grenera Nutrients Pvt. Ltd.
14.3.4.1 Company Overview
14.3.4.2 Product Portfolio
14.3.5 Herbs & Crops Overseas
14.3.5.1 Company Overview
14.3.5.2 Product Portfolio
14.3.6 Himalaya Drug Company (Himalaya Global Holdings Ltd.)
14.3.6.1 Company Overview
14.3.6.2 Product Portfolio
14.3.7 Kuli Kuli Inc.
14.3.7.1 Company Overview
14.3.7.2 Product Portfolio
14.3.8 Organic India Pvt. Ltd. (Fabindia Overseas Private Limited)
14.3.8.1 Company Overview
14.3.8.2 Product Portfolio
14.3.9 Saipro Biotech Private Limited
14.3.9.1 Company Overview
14.3.9.2 Product Portfolio
14.3.10 Santan International
14.3.10.1 Company Overview
14.3.10.2 Product Portfolio
List of Figures
Figure 1: Global: Moringa Ingredients Market: Major Drivers and Challenges
Figure 2: Global: Moringa Ingredients Market: Sales Value (in Billion US$), 2015-2020
Figure 3: Global: Moringa Ingredients Market Forecast: Sales Value (in Billion US$), 2021-2026
Figure 4: Global: Moringa Ingredients Market: Breakup by Sources (in %), 2020
Figure 5: Global: Moringa Ingredients Market: Breakup by Application (in %), 2020
Figure 6: Global: Moringa Ingredients Market: Breakup by Distribution Channel (in %), 2020
Figure 7: Global: Moringa Ingredients Market: Breakup by Region (in %), 2020
Figure 8: Global: Moringa Ingredients (Leaves) Market: Sales Value (in Million US$), 2015 & 2020
Figure 9: Global: Moringa Ingredients (Leaves) Market Forecast: Sales Value (in Million US$), 2021-2026
Figure 10: Global: Moringa Ingredients (Seed) Market: Sales Value (in Million US$), 2015 & 2020
Figure 11: Global: Moringa Ingredients (Seed) Market Forecast: Sales Value (in Million US$), 2021-2026
Figure 12: Global: Moringa Ingredients (Oil) Market: Sales Value (in Million US$), 2015 & 2020
Figure 13: Global: Moringa Ingredients (Oil) Market Forecast: Sales Value (in Million US$), 2021-2026
Figure 14: Global: Moringa Ingredients (Other Sources) Market: Sales Value (in Million US$), 2015 & 2020
Figure 15: Global: Moringa Ingredients (Other Sources) Market Forecast: Sales Value (in Million US$), 2021-2026
Figure 16: Global: Moringa Ingredients (Food and Beverages) Market: Sales Value (in Million US$), 2015 & 2020
Figure 17: Global: Moringa Ingredients (Food and Beverages) Market Forecast: Sales Value (in Million US$), 2021-2026
Figure 18: Global: Moringa Ingredients (Cosmetics and Personal Care) Market: Sales Value (in Million US$), 2015 & 2020
Figure 19: Global: Moringa Ingredients (Cosmetics and Personal Care) Market Forecast: Sales Value (in Million US$), 2021-2026
Figure 20: Global: Moringa Ingredients (Pharmaceuticals) Market: Sales Value (in Million US$), 2015 & 2020
Figure 21: Global: Moringa Ingredients (Pharmaceuticals) Market Forecast: Sales Value (in Million US$), 2021-2026
Figure 22: Global: Moringa Ingredients (Other Applications) Market: Sales Value (in Million US$), 2015 & 2020
Figure 23: Global: Moringa Ingredients (Other Applications) Market Forecast: Sales Value (in Million US$), 2021-2026
Figure 24: Global: Moringa Ingredients (Supermarkets) Market: Sales Value (in Million US$), 2015 & 2020
Figure 25: Global: Moringa Ingredients (Supermarkets) Market Forecast: Sales Value (in Million US$), 2021-2026
Figure 26: Global: Moringa Ingredients (Online Stores) Market: Sales Value (in Million US$), 2015 & 2020
Figure 27: Global: Moringa Ingredients (Online Stores) Market Forecast: Sales Value (in Million US$), 2021-2026
Figure 28: Global: Moringa Ingredients (Specialty Stores) Market: Sales Value (in Million US$), 2015 & 2020
Figure 29: Global: Moringa Ingredients (Specialty Stores) Market Forecast: Sales Value (in Million US$), 2021-2026
Figure 30: Global: Moringa Ingredients (Other Distribution Channels) Market: Sales Value (in Million US$), 2015 & 2020
Figure 31: Global: Moringa Ingredients (Other Distribution Channels) Market Forecast: Sales Value (in Million US$), 2021-2026
Figure 32: North America: Moringa Ingredients Market: Sales Value (in Million US$), 2015 & 2020
Figure 33: North America: Moringa Ingredients Market Forecast: Sales Value (in Million US$), 2021-2026
Figure 34: United States: Moringa Ingredients Market: Sales Value (in Million US$), 2015 & 2020
Figure 35: United States: Moringa Ingredients Market Forecast: Sales Value (in Million US$), 2021-2026
Figure 36: Canada: Moringa Ingredients Market: Sales Value (in Million US$), 2015 & 2020
Figure 37: Canada: Moringa Ingredients Market Forecast: Sales Value (in Million US$), 2021-2026
Figure 38: Asia-Pacific: Moringa Ingredients Market: Sales Value (in Million US$), 2015 & 2020
Figure 39: Asia-Pacific: Moringa Ingredients Market Forecast: Sales Value (in Million US$), 2021-2026
Figure 40: China: Moringa Ingredients Market: Sales Value (in Million US$), 2015 & 2020
Figure 41: China: Moringa Ingredients Market Forecast: Sales Value (in Million US$), 2021-2026
Figure 42: Japan: Moringa Ingredients Market: Sales Value (in Million US$), 2015 & 2020
Figure 43: Japan: Moringa Ingredients Market Forecast: Sales Value (in Million US$), 2021-2026
Figure 44: India: Moringa Ingredients Market: Sales Value (in Million US$), 2015 & 2020
Figure 45: India: Moringa Ingredients Market Forecast: Sales Value (in Million US$), 2021-2026
Figure 46: South Korea: Moringa Ingredients Market: Sales Value (in Million US$), 2015 & 2020
Figure 47: South Korea: Moringa Ingredients Market Forecast: Sales Value (in Million US$), 2021-2026
Figure 48: Australia: Moringa Ingredients Market: Sales Value (in Million US$), 2015 & 2020
Figure 49: Australia: Moringa Ingredients Market Forecast: Sales Value (in Million US$), 2021-2026
Figure 50: Indonesia: Moringa Ingredients Market: Sales Value (in Million US$), 2015 & 2020
Figure 51: Indonesia: Moringa Ingredients Market Forecast: Sales Value (in Million US$), 2021-2026
Figure 52: Others: Moringa Ingredients Market: Sales Value (in Million US$), 2015 & 2020
Figure 53: Others: Moringa Ingredients Market Forecast: Sales Value (in Million US$), 2021-2026
Figure 54: Europe: Moringa Ingredients Market: Sales Value (in Million US$), 2015 & 2020
Figure 55: Europe: Moringa Ingredients Market Forecast: Sales Value (in Million US$), 2021-2026
Figure 56: Germany: Moringa Ingredients Market: Sales Value (in Million US$), 2015 & 2020
Figure 57: Germany: Moringa Ingredients Market Forecast: Sales Value (in Million US$), 2021-2026
Figure 58: France: Moringa Ingredients Market: Sales Value (in Million US$), 2015 & 2020
Figure 59: France: Moringa Ingredients Market Forecast: Sales Value (in Million US$), 2021-2026
Figure 60: United Kingdom: Moringa Ingredients Market: Sales Value (in Million US$), 2015 & 2020
Figure 61: United Kingdom: Moringa Ingredients Market Forecast: Sales Value (in Million US$), 2021-2026
Figure 62: Italy: Moringa Ingredients Market: Sales Value (in Million US$), 2015 & 2020
Figure 63: Italy: Moringa Ingredients Market Forecast: Sales Value (in Million US$), 2021-2026
Figure 64: Spain: Moringa Ingredients Market: Sales Value (in Million US$), 2015 & 2020
Figure 65: Spain: Moringa Ingredients Market Forecast: Sales Value (in Million US$), 2021-2026
Figure 66: Russia: Moringa Ingredients Market: Sales Value (in Million US$), 2015 & 2020
Figure 67: Russia: Moringa Ingredients Market Forecast: Sales Value (in Million US$), 2021-2026
Figure 68: Others: Moringa Ingredients Market: Sales Value (in Million US$), 2015 & 2020
Figure 69: Others: Moringa Ingredients Market Forecast: Sales Value (in Million US$), 2021-2026
Figure 70: Latin America: Moringa Ingredients Market: Sales Value (in Million US$), 2015 & 2020
Figure 71: Latin America: Moringa Ingredients Market Forecast: Sales Value (in Million US$), 2021-2026
Figure 72: Brazil: Moringa Ingredients Market: Sales Value (in Million US$), 2015 & 2020
Figure 73: Brazil: Moringa Ingredients Market Forecast: Sales Value (in Million US$), 2021-2026
Figure 74: Mexico: Moringa Ingredients Market: Sales Value (in Million US$), 2015 & 2020
Figure 75: Mexico: Moringa Ingredients Market Forecast: Sales Value (in Million US$), 2021-2026
Figure 76: Others: Moringa Ingredients Market: Sales Value (in Million US$), 2015 & 2020
Figure 77: Others: Moringa Ingredients Market Forecast: Sales Value (in Million US$), 2021-2026
Figure 78: Middle East and Africa: Moringa Ingredients Market: Sales Value (in Million US$), 2015 & 2020
Figure 79: Middle East and Africa: Moringa Ingredients Market: Breakup by Country (in %), 2020
Figure 80: Middle East and Africa: Moringa Ingredients Market Forecast: Sales Value (in Million US$), 2021-2026
Figure 81: Global: Moringa Ingredients Industry: SWOT Analysis
Figure 82: Global: Moringa Ingredients Industry: Value Chain Analysis
Figure 83: Global: Moringa Ingredients Industry: Porter's Five Forces Analysis
List of Tables
Table 1: Global: Moringa Ingredients Market: Key Industry Highlights, 2020 and 2026
Table 2: Global: Moringa Ingredients Market Forecast: Breakup by Sources (in Million US$), 2021-2026
Table 3: Global: Moringa Ingredients Market Forecast: Breakup by Application (in Million US$), 2021-2026
Table 4: Global: Moringa Ingredients Market Forecast: Breakup by Distribution Channel (in Million US$), 2021-2026
Table 5: Global: Moringa Ingredients Market Forecast: Breakup by Region (in Million US$), 2021-2026
Table 6: Global: Moringa Ingredients Market: Competitive Structure
Table 7: Global: Moringa Ingredients Market: Key Players