
Natural Rubber Prices, Trend, Chart, Demand, Market Analysis, News, Historical and Forecast Data Report 2026 Edition
Natural Rubber Prices, Index, Trend, Historcial and Forecast
Track real-time and historical natural rubber prices across global regions. Updated monthly with market insights, drivers, and forecasts.
Natural Rubber Prices – Latest Update (May 2026)
As of May 2026, global natural rubber prices are trading steadily at around USD 2.28–2.38 per Kg. The price of natural rubber in May 2026 was mainly influenced by seasonal tapping conditions, weather-related disruptions, and supply availability in major producing countries. Latex output remained sensitive to rainfall, plantation yields, and labor availability, which affected short-term supply movement. Lower or delayed production in some regions supported firmer pricing, whereas steady arrivals helped limit sharper gains. Feedstock, energy, and processing costs also shaped overall price levels, especially through fuel, transportation, and factory operating expenses.
Besides, demand from tire manufacturing and automobile production continued to guide price movement during the month. Stable consumption from downstream industries supported baseline buying, though uneven manufacturing activity across regions restricted stronger upward momentum. Importing markets remained affected by freight costs, port availability, and landed price adjustments. Currency movement in exporting countries also influenced trade competitiveness and buyer sentiment. Inventory levels among producers, traders, and downstream users played an important role in short-term price stability.
Latest Key Prices Snapshot ( Table )
| Metric | Latest Value |
|---|---|
| Global Benchmark Price | USD 2.33/Kg |
| Global Average Price Range in May 26 | USD 2.28 – 2.38 per Kg |
| Africa | USD 1.68/Kg |
| Northeast Asia | USD 2.66/Kg |
| Europe | USD 1.97/Kg |
| Indonesia | USD 2.21/Kg |
| Malaysia | USD 2.74/Kg |
| Southeast Asia | USD 2.28/Kg |
| Thailand | USD 2.37/Kg |
| North America | USD 2.26/Kg |
| Monthly Change % | 6.1% to 6.5% |
| YoY Change % | 3.4% |
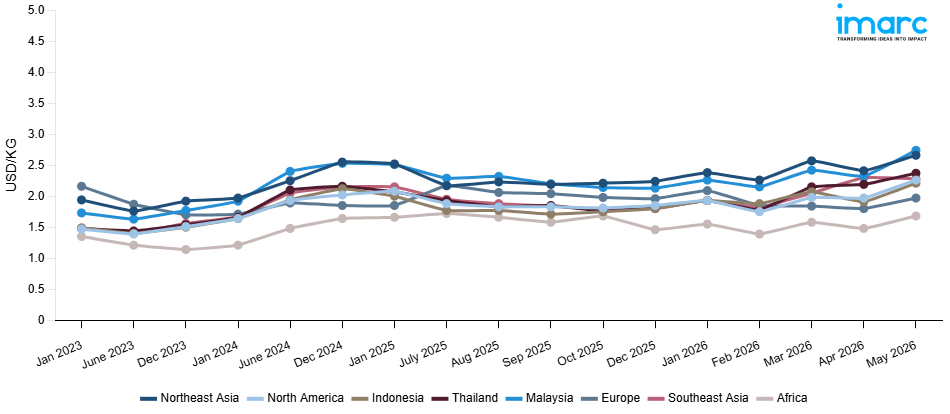
Natural Rubber Price Index (USD/KG):
The chart below highlights monthly natural rubber prices across different regions.
Get Access to Monthly/Quarterly/Yearly Prices, Request Sample
Q4 25 VS Q1 2026
Between Q4 2025 and Q1 2026, the natural rubber market showed a largely upward pricing trend across most regions, supported by firmer procurement activity, tighter supply availability, and higher replacement costs. Africa increased by 8.2%, rising from USD 1.46/Kg to USD 1.58/Kg, while Northeast Asia recorded a stronger 14.7% gain, moving from USD 2.24/Kg to USD 2.57/Kg. Indonesia rose by 15.0%, with prices increasing from USD 1.80/Kg to USD 2.07/Kg. Malaysia also moved upward by 13.6%, from USD 2.13/Kg to USD 2.42/Kg. Southeast Asia increased by 13.9%, rising from USD 1.80/Kg to USD 2.05/Kg, while Thailand recorded the sharpest growth at 18.1%, moving from USD 1.82/Kg to USD 2.15/Kg. North America rose by 7.0%, from USD 1.85/Kg to USD 1.98/Kg.
Europe was the only region showing a decline, with prices falling by 6.1% from USD 1.96/Kg to USD 1.84/Kg. The downward movement suggests softer regional buying, controlled inventories, and limited upward cost pressure compared with other markets. In contrast, the broader upward trend across producing and consuming regions reflected steady demand from tire, automobile, and industrial rubber sectors. Supply-side factors, including latex availability, tapping conditions, plantation output, and export flow adjustments, supported stronger pricing in key producing markets. Higher freight, port handling, domestic logistics, and currency-linked landed costs also contributed to firmer Q1 2026 price levels. Overall, the market shifted toward firmer pricing in Q1 2026, with regional differences driven by supply availability, downstream demand, and import cost pressure.
Key Factors Influencing Natural Rubber Prices:
Several factors influence natural rubber price movements globally
- Weather and Supply: Production levels in the main producing nations have a significant impact on natural rubber prices. Plantation yields and latex tapping are impacted by weather patterns including drought and heavy rainfall. Global availability and pricing patterns are directly impacted by seasonal harvesting cycles and possible supply disruptions.
- Automotive and Tire Industry Demand: The tire manufacturing sector is the largest consumer of natural rubber. Changes in vehicle production, replacement tire demand, and overall automotive industry performance significantly influence consumption patterns and determine price direction in global markets.
- Energy, Freight, and Logistics Costs: Fuel prices, transportation expenses, and shipping availability affect export competitiveness and landed costs. Fluctuations in freight rates and supply chain efficiency can either increase overall procurement costs or ease pricing pressure in importing regions.
- Currency Movements and Trade Policies: Exchange rate fluctuations in major exporting countries impact global trade flows and pricing competitiveness. Export taxes, government policies, and trade regulations also influence supply dynamics and can create volatility in international natural rubber markets.
Natural Rubber Prices Overview by Region – May 2026
Africa: In May 2026, natural rubber prices in Africa reached USD 1.68/Kg, with an upward movement of 13.5%. Export-oriented African suppliers benefited from growing attention toward the region as buyers looked beyond traditional Southeast Asian origins. At the same time, African price levels were still affected by domestic logistics, inland transportation, port handling charges, freight availability, and currency movement against the US dollar. Export competitiveness also depended on shipment reliability and the ability to meet buyer documentation requirements.
Northeast Asia: In May 2026, natural rubber prices in Northeast Asia increased by 10.4% to USD 2.66/Kg. The region held one of the highest price positions, supported by import dependence, tire sector demand, and procurement from automotive-linked manufacturers. Regional landed costs were influenced by ocean freight, customs handling, exchange rates, and supplier competition from Thailand, Indonesia, Malaysia, and other producing origins. Currency movement also played an important role in trade flows because many natural rubber transactions are dollar-linked, while buyers settle downstream costs in local currencies. Trade friction between the US and China added caution to procurement planning, which encouraged buyers to manage inventories carefully rather than overcommit to long-term cargoes.
Europe: Europe witnessed a significant 9.4% hike in May 2026, with prices increasing to USD 1.97/Kg. The rise was driven by import reliance, higher landed costs, and steady consumption from tire and industrial rubber sectors. Freight charges, port handling, customs expenses, warehousing, and domestic distribution costs influenced delivered prices. Buyers continued need based procurement to maintain production schedules, though they avoided excessive stockbuilding amid elevated costs. Compliance documentation, traceability requirements, and supplier verification also added to procurement expenses for regulated supply chains. Currency movement affected import parity and purchasing decisions.
Indonesia: Indonesia recorded a 15.7% increase in May 2026, with prices settling at USD 2.21/Kg. The rise was linked to firm export demand, tighter raw material availability, and steady downstream consumption. Latex supply remained influenced by tapping activity, plantation output, and weather-related production conditions. Buyers continued securing material for tire and industrial rubber manufacturing, which helped support market sentiment. Freight costs, port charges, domestic logistics, and currency movement affected export values and buyer cost calculations. Sellers held firm offers as supply remained controlled, while buyers avoided aggressive stockbuilding. The market moved upward due to steady export interest, limited availability, and stronger replacement cost pressure.
Malaysia: In May 2026, Malaysia experienced an 18.1% increase, with prices reaching USD 2.74/Kg. The strong rise was supported by firm demand for higher grade rubber and tighter supply availability. Limited raw material flow, cautious seller offers, and steady procurement from tire and industrial rubber manufacturers strengthened price sentiment. Processing costs, labor availability, domestic logistics, and freight expenses also influenced final market values. Buyers continued need based procurement to meet production requirements, but limited supply flexibility kept replacement costs elevated. Currency movement also affected export competitiveness and buyer margins.
Southeast Asia: Southeast Asia recorded a 0.9% decline in May 2026, with prices settling at USD 2.28/Kg. The slight decrease was linked to balanced supply availability and cautious buying activity. Steady latex output and regular export flows helped reduce urgency among buyers. Demand from tire manufacturers remained present, but it was not strong enough to generate higher price momentum across the region. Adequate inventories, competitive offers, and controlled procurement weighed on market sentiment. Freight costs, domestic logistics, and currency movement still influenced delivered values, but supply availability helped limit upward pressure. The market showed a mild downward correction as buyers maintained need-based purchases.
Thailand: Thailand recorded an 8.2% increase, with prices reaching USD 2.37/Kg in May 2026. The upward movement was supported by steady export demand and firm buyer interest. Latex output remained sensitive to tapping conditions, plantation productivity, and weather-related supply changes, which affected short-term availability. Buyers continued procurement for tire-grade and industrial rubber material, supporting price sentiment. Freight costs, port handling, domestic transportation, and currency movement also shaped export values. Sellers maintained firm offers due to supply caution, while buyers focused on securing reliable volumes without building excessive stocks.
North America: North America recorded a 14.7% increase, with prices rising to USD 2.26/Kg in May 2026. The increase was driven by import dependence, higher landed costs, and steady demand from tire manufacturers. Freight charges, customs expenses, warehousing, domestic logistics, and currency movement influenced final delivered prices. Buyers managed inventories carefully but continued procurement to support production needs. Supply reliance on overseas producers kept the market sensitive to shipment timing, freight availability, and raw material replacement costs. Stable industrial rubber demand also supported baseline consumption. The market remained firm as higher import costs, steady downstream demand, and cautious supply availability pushed prices upward.
.webp)
Natural Rubber Price Forecast
Short-Term Trend (Next 3 Months)
Natural rubber prices are expected to remain firm, with mild upward pressure likely to continue. Supply availability may remain limited because latex tapping can be affected by rainfall, plantation yield variation, labor availability, and aging tree stocks. Any disruption in raw material collection could tighten spot supply and support seller offers. Demand from tire manufacturing, automotive production, and industrial rubber applications is expected to remain stable, which should sustain baseline consumption. However, stronger gains may be restrained by cautious procurement, adequate inventories among some buyers, and resistance to higher replacement costs. Import dependent markets may continue to face elevated landed costs due to freight charges, port handling, customs, domestic logistics, fuel prices, and currency fluctuations.
Mid-Term Trend (2026–2027)
During 2026–2027, natural rubber prices are expected to follow a cautiously firm trajectory, supported by structural demand growth from the automotive and electric vehicle (EV) sectors. Expanding tire replacement cycles and infrastructure development in emerging economies are likely to sustain steady consumption. Additionally, sustainability initiatives and tighter environmental regulations may influence plantation practices, potentially affecting long-term supply growth. On the supply side, production expansion in Southeast Asia and Africa could maintain overall availability, though weather-related disruptions and seasonal wintering periods may periodically tighten output. Overall, the mid-term outlook suggests gradual stabilization with moderate upward bias, characterized by cyclical fluctuations rather than extreme volatility, as global supply-demand fundamentals move toward balanced conditions.
Natural Rubber Price History (2022–2026) – Table / Para format
| Year | Market Movement | Key Event |
|---|---|---|
| 2021-2022 | Sharp Rally | Post-pandemic automotive recovery, supply tightness from Southeast Asia, and weather-related disruptions |
| 2023-2024 | Market Correction | Improved tapping conditions, normalized export flows, and softer global tire demand |
| 2025 | Volatile Adjustment | Fluctuating EV demand, currency movements in producing countries, and shifting trade flows |
| 2026 | Consolidation Phase | Balanced global supply, cautious inventory management by tire manufacturers, and stable plantation output |
This historical trend shows recurring cycles tied to macroeconomic and agricultural supply factors.
Natural Rubber Market Outlook
The global natural rubber market is projected to witness steady but moderate growth over the coming years, supported primarily by demand from the tire and automotive sectors. Expansion in electric vehicle (EV) production, infrastructure development, and replacement tire demand are expected to sustain long-term consumption. Emerging economies in the Asia Pacific are likely to remain the key demand centers due to rising vehicle ownership and industrialization.
Natural Rubber Industry Analysis
The global natural rubber industry size reached USD 20.4 Billion in 2025. By 2034, IMARC Group expects the market to reach USD 30.8 Billion, at a projected CAGR of 4.53% during 2026-2034. Growth is driven by rising automotive tire demand, expanding industrial applications, and increasing consumption across emerging economies, with sustainability initiatives and supply chain optimization further shaping long-term market dynamics.
Latest Developments in the Natural Rubber Industry
- May 2025: Kerala Rubber Limited, a public sector enterprise of the state, is planning to create an industrial complex and integrated facility to support industries related to natural rubber and its derivatives. Key goals of the plan involve enhancing price realization for rubber farmers and promoting the value addition of natural rubber.
- March 2025: Olam Agri, a prominent agri-business specializing in food, feed, and fibre, has joined forces with Deutsche Gesellschaft für Internationale Zusammenarbeit (GIZ) GmbH to implement the Sustainable Natural Rubber Initiative in Indonesia's Lampung Province. This initiative seeks to improve the competitiveness, sustainability, and market integration of small-scale rubber farmers while striving for rubber cultivation that is free from deforestation. It is a component of the Sustainable Agriculture for Forest Ecosystems (SAFE) initiative, co-financed by the European Union, the German Federal Ministry for Economic Cooperation and Development (BMZ), and the Dutch Ministry of Foreign Affairs.
- January 2025: More than 1.25 lakh hectares of rubber cultivation have been established in Northeast and West Bengal through a project involving four major tyre producers in the nation. Within the framework of the INROAD project (Indian Natural Rubber Operations for Assisted Development), the Automotive Tyre Manufacturers' Association (ATMA) aimed to establish two lakh hectares of rubber plantations across Assam, Arunachal Pradesh, Manipur, Meghalaya, Mizoram, Nagaland, Tripura, and West Bengal, with an investment of Rs 1,100 crore over a period of five years.
Product Description
Natural rubber is an elastomer obtained primarily from the latex of the Hevea brasiliensis tree. Chemically composed of cis-1,4-polyisoprene, it exhibits high elasticity, resilience, and tensile strength. Its unique mechanical properties make it indispensable in the manufacturing of tires, industrial belts, footwear, medical supplies, adhesives, and a range of molded goods. Natural rubber also possesses strong abrasion resistance and flexibility across varying temperatures, enhancing its suitability for dynamic load-bearing applications. It is harvested mainly in tropical regions, with Southeast Asia being the leading producer. Its broad range of industrial uses and renewable nature highlight its importance in global supply chains.
Key Supplier List
The key suppliers of natural rubber are
- Halcyon Agri Corporation Limited
- Sinochem Group
- Southland Rubber Company Limited
- Sri Trang Agro-Industry Plc
- Thai Rubber Latex Group Public Company Limited
- Von Bundit Co. Ltd.
Report Coverage
| Key Attributes | Details |
|---|---|
| Product Name | Natural Rubber |
| Report Features | Exploration of Historical Trends and Market Outlook, Industry Demand, Industry Supply, Gap Analysis, Challenges, Natural rubber Price Analysis, and Segment-Wise Assessment. |
| Currency/Units | US$ (Data can also be provided in local currency) or Metric Tons |
| Region/Countries Covered | The current coverage includes analysis at the global and regional levels only. Based on your requirements, we can also customize the report and provide specific information for the following countries: Asia Pacific: China, India, Indonesia, Pakistan, Bangladesh, Japan, Philippines, Vietnam, Thailand, South Korea, Malaysia, Nepal, Taiwan, Sri Lanka, Hongkong, Singapore, Australia, New Zealand Europe: Germany, France, United Kingdom, Italy, Spain, Russia, Turkey, Netherlands, Poland, Sweden, Belgium, Austria, Ireland, Switzerland, Norway, Denmark, Romania, Finland, Czech Republic, Portugal, Greece North America: United States and Canada Latin America: Brazil, Mexico, Argentina, Columbia, Chile, Ecuador, Peru Middle East & Africa: Saudi Arabia, UAE, Israel, Iran, South Africa, Nigeria, Oman, Kuwait, Qatar, Iraq, Egypt, Algeria, Morocco The list of countries presented is not exhaustive. Information on additional countries can be provided if required by the client. |
| Information Covered for Key Suppliers |
|
| Customization Scope | The report can be customized as per the requirements of the customer |
| Report Price and Purchase Option |
Plan A: Monthly Updates - Annual Subscription
Plan B: Quarterly Updates - Annual Subscription
Plan C: Biannually Updates - Annual Subscription
|
| Post-Sale Analyst Support | 360-degree analyst support after report delivery |
| Delivery Format | PDF and Excel through email (We can also provide the editable version of the report in PPT/Word format on special request) |
Key Benefits for Stakeholders:
- IMARC’s report presents a detailed analysis of natural rubber pricing, covering global and regional trends, spot prices at key ports, and a breakdown of FOB and CIF prices.
- The study examines factors affecting natural rubber price trend, including input costs, supply-demand shifts, and geopolitical impacts, offering insights for informed decision-making.
- The competitive landscape review equips stakeholders with crucial insights into the latest market news, regulatory changes, and technological advancements, ensuring a well-rounded, strategic overview for forecasting and planning.
- IMARC offers various subscription options, including monthly, quarterly, and biannual updates, allowing clients to stay informed with the latest market trends, ongoing developments, and comprehensive market insights. The natural rubber price charts ensure our clients remain at the forefront of the industry.
Frequently Asked Questions About the Natural Rubber Price Index Report
Natural rubber prices in May 2026 are averaging between USD 2.28/Kg–2.38/Kg, depending on region and grade. Northeast Asia markets are currently trading above global averages due to stronger regional procurement from tire manufacturers.
The natural rubber price trend in 2026 is characterized primarily by market stabilization and moderate softness across major regions, reflecting a combination of supply improvement and cautious downstream demand.
The natural rubber price index aggregates pricing data from major producing and consuming regions, reflecting changes in supply, demand, trade flows, and benchmark futures pricing.
The natural rubber price forecast suggests annual growth of approx. 4%-5% through 2030, supported by expanding global automotive production, particularly in electric vehicles (EVs), which require higher-performance tires.
Natural rubber price history data can be accessed through detailed quarterly and annual pricing reports, including regional benchmarks and historical trend analysis.
Need more help?
- Speak to our experienced analysts for insights on the current market scenarios.
- Include additional segments and countries to customize the report as per your requirement.
- Gain an unparalleled competitive advantage in your domain by understanding how to utilize the report and positively impacting your operations and revenue.
- For further assistance, please connect with our analysts.
 Request Customization
 Inquire Before Buying
 Speak to an Analyst
 Request Brochure
Benefits of Customization
- Personalize this research
- Triangulate with your data
- Get data as per your format and definition
- Gain a deeper dive into a specific application, geography, customer, or competitor
- Any level of personalization
Get in Touch With Us
UNITED STATES
Phone: +1-201-971-6302
INDIA
Phone: +91-120-433-0800
UNITED KINGDOM
Phone: +44-753-714-6104
Email: [email protected]
Client Testimonials


.webp)


Related Reports
Why Choose Us
IMARC offers trustworthy, data-centric insights into commodity pricing and evolving market trends, enabling businesses to make well-informed decisions in areas such as procurement, strategic planning, and investments. With in-depth knowledge spanning more than 1000 commodities and a vast global presence in over 150 countries, we provide tailored, actionable intelligence designed to meet the specific needs of diverse industries and markets.
1000
+Commodities
150
+Countries Covered
3000
+Clients
20
+Industry
Robust Methodologies & Extensive Resources
IMARC delivers precise commodity pricing insights using proven methodologies and a wealth of data to support strategic decision-making.
Subscription-Based Databases
Our extensive databases provide detailed commodity pricing, import-export trade statistics, and shipment-level tracking for comprehensive market analysis.
Primary Research-Driven Insights
Through direct supplier surveys and expert interviews, we gather real-time market data to enhance pricing accuracy and trend forecasting.
Extensive Secondary Research
We analyze industry reports, trade publications, and market studies to offer tailored intelligence and actionable commodity market insights.
Trusted by 3000+ industry leaders worldwide to drive data-backed decisions. From global manufacturers to government agencies, our clients rely on us for accurate pricing, deep market intelligence, and forward-looking insights.