
Needle Coke Market Size, Share, Trends and Forecast by Type, Grade, Application, End Use Industry, and Region, 2026-2034
Needle Coke Market Size and Share:
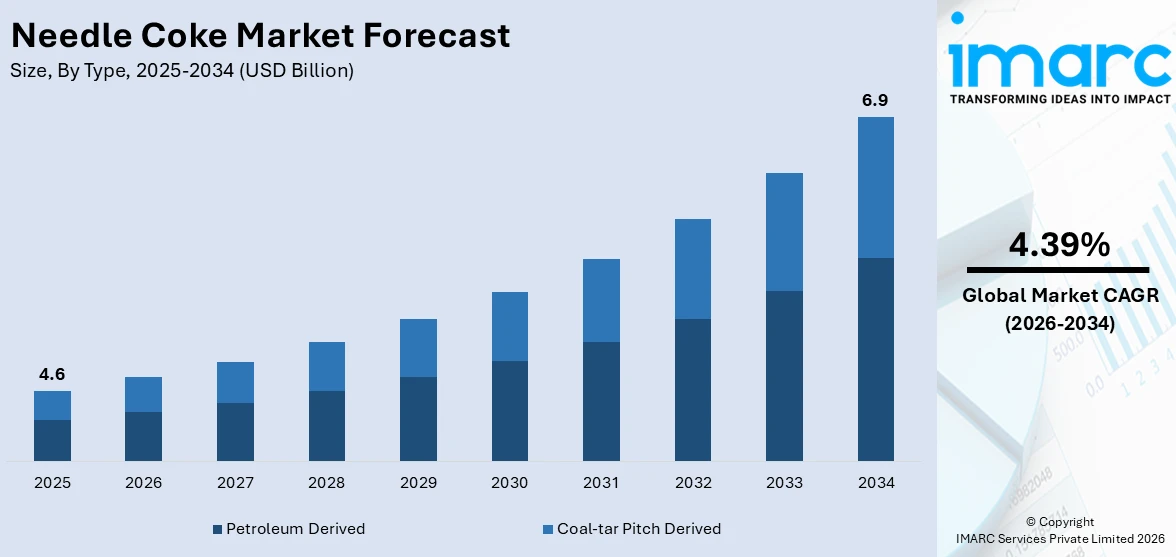
The global needle coke market size was valued at USD 4.6 Billion in 2025. Looking forward, IMARC Group estimates the market to reach USD 6.9 Billion by 2034, exhibiting a CAGR of 4.39% from 2026-2034. Asia Pacific currently dominates the market with 81.8% of the total market share. This is due to increasing demand for high-performance materials in lithium-ion batteries, expanding steel production, ongoing technological advancements, rising electric vehicle (EV) adoption, and the exploration of unconventional oil and gas resources are some of the key factors influencing market growth.
|
Report Attribute
|
Key Statistics
|
|---|---|
|
Base Year
|
2025
|
|
Forecast Years
|
2026-2034
|
|
Historical Years
|
2020-2025
|
|
Market Size in 2025
|
USD 4.6 Billion |
|
Market Forecast in 2034
|
USD 6.9 Billion |
| Market Growth Rate (2026-2034) | 4.39% |
One major driver of the needle coke market is the growing demand for high-performance lithium-ion batteries, primarily driven by the rapid expansion of EVs and renewable energy storage systems. Needle coke is a critical raw material for manufacturing graphite anodes used in these batteries due to its superior thermal and electrical conductivity. The global push toward decarbonization and sustainable energy solutions has led to significant investments in EV production and energy storage technologies, creating a robust demand for needle coke. This trend is further supported by government incentives and policies promoting the adoption of electric vehicles and clean energy initiatives.The United States plays a pivotal role in the needle coke market, with 89.10% of the market share.
To get more information on this market Request Sample
Its growth is driven by its advanced manufacturing capabilities and robust demand from the EVs and steel industries. The U.S. is a significant producer and consumer of needle coke, leveraging its strong petrochemical infrastructure to produce high-quality petroleum needle coke. Additionally, the growing EV market in the country, supported by government incentives and sustainability initiatives, has increased the demand for graphite anodes, boosting needle coke consumption. The steel industry's reliance on electric arc furnaces (EAFs), which utilize graphite electrodes made from needle coke, further bolsters the U.S. market's growth.
Needle Coke Market Trends:
Increasing demand for lithium-ion batteries
One of the primary factors propelling the global needle coke market is the soaring demand for lithium-ion batteries. Needle coke is a crucial raw material in the production of anodes for lithium-ion batteries, which are widely used in EVs, consumer electronics, and energy storage systems. According to the IEA, global sales of electric cars nearly hit 14 Million in 2023, marking a 35% increase compared to 2022. As a result, the total number of electric vehicles worldwide reached 40 Million by the end of the year. As the world transitions towards a more sustainable and eco-friendly energy landscape, there is a surging demand for EVs. Consequently, this has led to an increased need for high-performance lithium-ion batteries, which, in turn, is bolstering the demand for needle coke. Furthermore, the unique properties of needle coke, such as high thermal conductivity and resistance to thermal shock, making it an ideal choice for manufacturing high-quality anodes that enhance the overall efficiency and performance of lithium-ion batteries is impelling the market growth.
Growing steel industry and the importance of UHP graphite electrodes
The robust growth of the steel industry is contributing to market growth, as needle coke is a key ingredient in the production of ultra-high-power (UHP) graphite electrodes, which have extensive applications in EAF for steel production. The global steel market size was valued at USD 974.4 Billion in 2024. Needle coke's unique physical and chemical properties, such as low coefficient of thermal expansion and high electrical conductivity, make it an indispensable material for the manufacturing of UHP graphite electrodes. As a result, the steel industry's expansion, driven by urbanization, infrastructure development, and industrialization in emerging economies, has significantly increased the demand for UHP graphite electrodes, thereby bolstering the growth of the needle coke market.
Advancements in the oil and gas sector
The oil and gas sector plays a pivotal role in the needle coke market for the production of high-quality graphite electrodes used in the refining of crude oil. Needle coke's ability to withstand extreme temperatures and harsh chemical environments makes it an essential material for the production of graphite electrodes used in oil refining processes. A 2023 survey by Rystad Energy estimates that approximately 1.6 Trillion Barrels of recoverable oil are still available. Consequently, the flourishing expansion of the oil and gas industry is fueling the demand for needle coke. Apart from this, the increasing exploration and extraction of unconventional oil and gas resources, such as shale oil and gas, are heightening the demand for needle coke in various applications within the industry.
Expanding aerospace and automotive sectors
The increasing use of needle coke in the production of specialty carbon materials, including carbon fibers and composites, which find extensive applications in the aerospace and automotive industries is acting as another significant growth-inducing factor. These materials contribute to the lightweight of vehicles and aircraft, thereby enhancing fuel efficiency and overall performance. The UK aerospace and defense market size reached USD 24.7 Billion in 2023. Concurrent with this, the bolstering growth of the aerospace and automotive sectors, driven by technological innovations, increasing air travel, and rising consumer demand for advanced and fuel-efficient vehicles are presenting lucrative opportunities for market expansion. Apart from this, the rising focus on meeting stringent environmental regulations among manufacturers and improving the energy efficiency of their products is propelling the market forward.
Needle Coke Industry Segmentation:
IMARC Group provides an analysis of the key trends in each segment of the global needle coke market, along with forecast at the global, regional, and country levels from 2026-2034. The market has been categorized based on type, grade, application, and end use industry.
Analysis by Type:
- Coal-tar Pitch Derived
- Petroleum Derived
Petroleum derived stands as the largest component in 2025, with 66.8% of the market share owing to its superior quality and widespread availability. The purity and consistency of petroleum coke make it suitable for applications that demand high performance, like graphite electrode production. It is a byproduct of the oil refining industry and can be further processed into needle coke, hence it is less expensive than other sources. The increasing demand from industries like steel production, automotive (for EV batteries), and energy storage systems drives the dominance of petroleum-derived needle coke, which supports the market leadership of petroleum-derived needle coke.
Analysis by Grade:
- Intermediate
- Premium
- Super Premium
Super premium leads the market with 44.6% of the market share due to its exceptional purity, high thermal conductivity, and strength, making it ideal for high-performance applications. This grade is primarily used for producing graphite electrodes for EAFs in the production of steel. Here precision and efficiency of use are absolutely necessary. Super premium needle coke's low impurity levels ensure superior performance in extreme temperatures, which is essential for industries requiring reliable and durable materials. Besides this, its suitability for lithium-ion battery anodes, especially in EVs), further boosts its demand. With growing industries like EV manufacturing and steel production, the demand for super premium needle coke continues to increase, solidifying its market leadership.
Analysis by Application:
Access the comprehensive market breakdown Request Sample
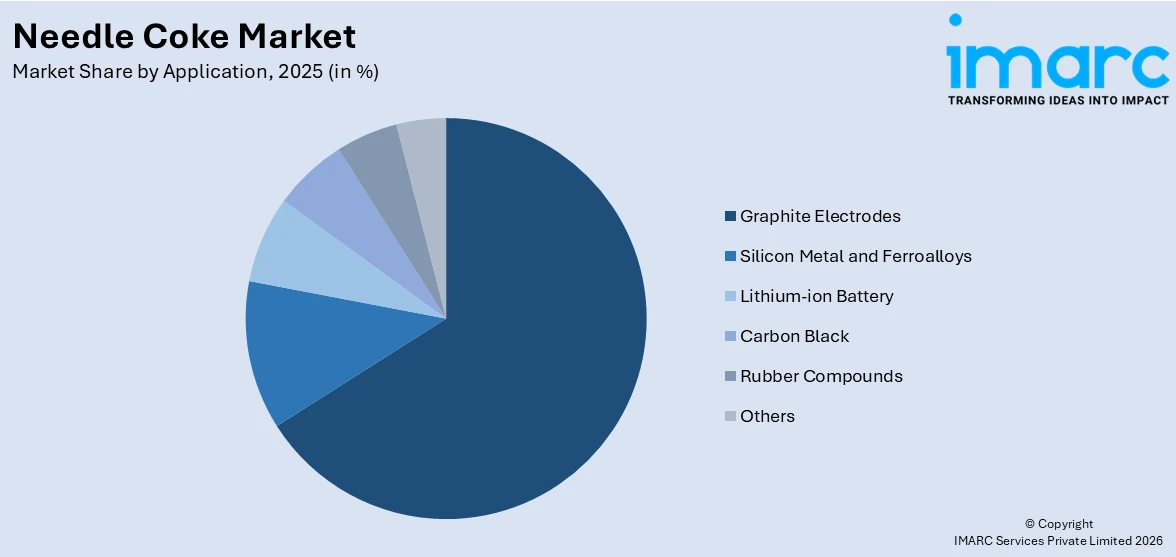
- Graphite Electrodes
- Silicon Metal and Ferroalloys
- Lithium-ion Battery
- Carbon Black
- Rubber Compounds
- Others
In 2025, graphite electrodes account for the majority of the market with 66.5% of the market share, driven by their essential role in steel production through EAFs. The transition globally toward green and energy-efficient steelmaking has increased the usage of EAFs, thereby increasing the demand for good-quality graphite electrodes. The higher thermal and electrical conductivity along with very low levels of impurities makes needle coke a raw material of significance in the manufacturing process of these electrodes. Also, the increased rate of infrastructure development and industrialization in Asia Pacific and North America has further increased steel production, continuing to drive demand. The ongoing advancements in EAF technology and the growing emphasis on cleaner production methods continue to reinforce graphite electrodes' dominance in the market.
Analysis by End Use Industry:
- Aluminum and Steel
- Automotive
- Semiconductor
- Others
The aluminum and steel represent the biggest end-user industry with 59.8% of the market share due to their reliance on graphite electrodes for EAF. This segment is bolstered by rising global steel production and the shift toward eco-friendly manufacturing practices. Additionally, the automotive industry plays a significant role, fueled by the increasing adoption of electric vehicles (EVs). Needle coke, a critical component for lithium-ion battery anodes, is integral to the growth of the EV sector. Meanwhile, the semiconductor industry utilizes needle coke for advanced thermal management applications, leveraging its superior thermal and electrical conductivity. However, the other industries, including aerospace and energy storage, contribute to market growth as they increasingly adopt high-performance materials for specialized applications, further diversifying demand for needle coke.
Regional Analysis:
To get more information on the regional analysis of this market Request Sample
- North America
- United States
- Canada
- Europe
- Germany
- France
- United Kingdom
- Italy
- Spain
- Russia
- Others
- Asia Pacific
- China
- Japan
- India
- South Korea
- Australia
- Indonesia
- Others
- Latin America
- Brazil
- Mexico
- Others
- Middle East and Africa
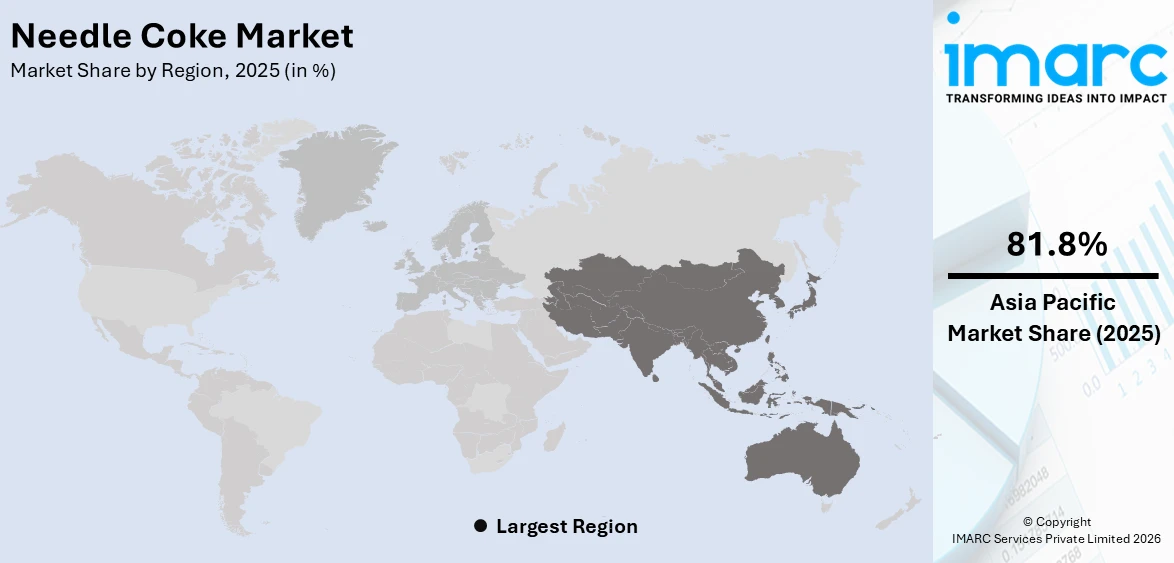
In 2025, Asia Pacific accounted for the largest market share at 81.8% driven by rapid industrialization, urbanization, and the booming EV sector. The region’s dominance is fueled by high steel production using EAFs, which require graphite electrodes made from needle coke. Countries like China and India are leading in steel output, further boosting demand. Furthermore, Asia Pacific's expanding EV market, supported by government incentives and significant investments in battery manufacturing, has increased the need for needle coke in lithium-ion battery anodes. Favorable economic conditions, a robust manufacturing base, and increasing adoption of renewable energy storage systems solidify Asia Pacific's leadership in the global needle coke market.
Key Regional Takeaways:
North America Needle Coke Market Analysis
Strong demand from the EVs and steel industries is driving the North America needle coke market. Advanced industrial infrastructure and emphasis on innovation contribute to significant needle coke production in the region, mainly from petroleum-derived sources. Increasing adoption of EVs, with government incentives and a move toward sustainable energy solutions, has helped increase the demand for graphite anodes in lithium-ion batteries, a primary application of needle coke. Apart from this, with the growing percentage of EAFs in steel production, more demand for graphite electrodes made out of needle coke is witnessed; hence, such factors support growth within the market. Environmental regulations pertaining to cleaner productions encourage manufacturers toward sustainable practices. Fluctuation in raw material prices and the arrival of alternative raw materials pose problems but also prompt innovation within the sector. The North American needle coke market is likely to continue growing steadily in the following years, with the trend of technological advancements and increased investment in EV and renewable energy projects.
United States Needle Coke Market Analysis
Increasing demand for graphite electrodes in EAF steel production supports the growth of the needle coke market in the US, as the country is likely to be more investing in sustainable and efficient industrial processes. Among others, the growing sector with rapidly increasing EV counts is highly contributing to the market's growth, as needle coke is a key raw material for anodes of lithium-ion batteries. According to industry reports, there are approximately 3.3 Million electric cars on U.S. roads, reflecting the surge in EV adoption and the corresponding need for advanced battery technologies. Government incentives promoting clean energy and substantial investments in EV manufacturing and battery technology further support this trend. The U.S. also benefits from its expanding domestic oil refining capabilities, ensuring a steady supply of high-quality needle coke for critical applications. While challenges such as supply chain disruptions and raw material cost fluctuations persist, advancements in technology and strategic collaborations among key stakeholders are mitigating these impacts. With its focus on innovation, sustainability, and carbon-neutral initiatives, the U.S. continues to be a pivotal player in the global needle coke market, fostering steady growth across steel and battery industries.
Europe Needle Coke Market Analysis
The needle coke market in Europe is driven by the growing shift toward sustainable industrial practices and green technologies. The region’s emphasis on EAF steel production, which requires graphite electrodes made from needle coke, is a significant driver. The growing EV market also increases the demand for lithium-ion batteries, which is one of the major applications of needle coke. In 2023, new electric car registrations in Europe reached nearly 3.2 Million, with a growth of almost 20% compared to 2022. Of these, 2.4 Million sales were recorded in the European Union, with similar growth rates. This surge underscores the region’s transition to cleaner energy and transportation solutions. European Union regulations promoting carbon neutrality and energy efficiency further bolster market demand for advanced battery materials. Investments in battery technology innovation, supported by government funding and private partnerships, are creating opportunities for needle coke applications in battery production. Despite challenges such as supply chain constraints and geopolitical risks, Europe’s focus on fostering a circular economy and advancing battery recycling technologies ensures the market’s steady growth. These initiatives position Europe as a leader in sustainable industrial development and a key player in the global needle coke industry.
Asia Pacific Needle Coke Market Analysis
Robust growth in the Asia-Pacific needle coke market has been driven by rapid industrialization and urbanization, especially in China and India. The World Bank reported that East Asia and the Pacific is the world's most rapidly urbanizing region, with an average annual urbanization rate of 3%. This accelerating urbanization drives demand for steel, produced predominantly using EAF technology, which relies on graphite electrodes made from needle coke. Apart from this, the region's dominance in the EV market, coupled with increasing investments in lithium-ion battery production facilities, boosts demand for needle coke. Government initiatives to promote sustainable industrial practices and available cheap resources further add to the region's competitive advantage.
Latin America Needle Coke Market Analysis
The needle coke market in Latin America is supported by the region’s significant urbanization and industrial development. According to BBVA Research, urbanization in Latin American countries is now around 80%, higher than in most other regions. A higher rate of urbanization will necessitate steel demands in infrastructural and construction fields, particularly with EAF technology, which employs graphite electrodes comprising needle coke. In parallel with this, a rise in the use of EVs and other alternative sources of renewable energies is expanding demands for lithium-ion batteries. An encouraging policy towards industrial and energy sectors and direct foreign investment encourages market growth.
Middle East and Africa Needle Coke Market Analysis
The Middle East and Africa needle coke market is mainly driven by rising investments in industrial infrastructure and an increasing production of steel. Saudi Arabia's steel market was USD 8.7 Billion in 2024, based on strong demand for the region's steel, particularly steel produced with EAF technology, that uses graphite electrodes based on needle coke. Moreover, increased emphasis on renewable energy projects and a step-by-step adoption of EVs finds congruence with global sustainability trends, and this in turn raises demand for lithium-ion batteries. The government policies are also benevolent, and foreign investments provide further catalysts for industrial development and growth in the market of the region.
Competitive Landscape:
The competitive landscape of the needle coke market is marked by innovation, capacity expansion, and strategic partnerships as the key players try to gain more significant positions in the market. Heavy investment is made by the manufacturers in research and development for quality enhancement in needle coke and to make the production process more efficient thus, manufacturers have a bright prospect for future sales. The market also sees competition driven by pricing strategies and regional availability of raw materials, as feedstock prices and supply fluctuations can impact production costs. Besides this, environmental regulations are encouraging producers to adopt sustainable practices, further influencing competitive dynamics. The emergence of alternative materials and technologies adds complexity, pushing participants to remain agile and responsive to evolving market trends.
The report provides a comprehensive analysis of the competitive landscape in the needle coke market with detailed profiles of all major companies, including:
- Asbury Carbons Inc.
- GrafTech International Ltd.
- Graphite India Limited
- Mitsubishi Chemical Holdings Corporation
- Nippon Steel Chemical & Material Co., Ltd.
- Phillips 66 Company
- Sojitz Corporation
- Sumitomo Corporation
Latest News and Developments:
- In November 2024, GrafTech International Ltd. secured a financing agreement to raise USD 175 Million in new debt and extend existing maturities. The company will also exchange senior notes for second lien notes and launch a consent solicitation to remove most covenants. A new USD 225 Million revolving credit facility will replace existing commitments. This restructuring aims to increase liquidity to USD 529 Million by September 2024, supporting GrafTech’s needle coke operations. Advisors include Kirkland & Ellis LLP, Evercore, and Simpson Thacher & Bartlett LLP.
- In July 2024, Russian needle coke producer Gazprom Neft announced plans to produce 5,000 Tonnes of PET needle coke between mid-July and August. The company has also signed an offtake agreement to supply PET needle coke to a Russian producer of downstream graphite products, including graphite electrodes.
- In December 2023, Mott Corporation announced a new eight-figure agreement with South Korean refinery S-OIL. Mott and its Korean partner DL E&C are teaming up to provide critical filtration technology for S-OIL’s groundbreaking Shaheen project in Ulsan, South Korea.
- In November 2023, Nippon Steel Corporation announced its indirect acquisition of 20% interest in Elk Valley Resources (EVR JV), which is the steelmaking coal business partnership sold by Teck Resources Limited (Teck),
- In May 2023, Chevron Lummus Global LLC (CLG) was awarded a contract by TAQAT Development Company to develop a 75,000 TPA needle coke and synthetic graphite facility in Rabigh, Saudi Arabia. CLG's responsibilities include pilot plant testing, licensing, basic design, and engineering support, with feedstock provided by Rabigh Refining & Petrochemical Company (Petro Rabigh).
Needle Coke Market Report Scope:
| Report Features | Details |
|---|---|
| Base Year of the Analysis | 2025 |
| Historical Period | 2020-2025 |
| Forecast Period | 2026-2034 |
| Units | Billion USD |
| Scope of the Report | Exploration of Historical Trends and Market Outlook, Industry Catalysts and Challenges, Segment-Wise Historical and Future Market Assessment:
|
| Types Covered | Coal-tar Pitch Derived, Petroleum Derived |
| Grades Covered | Intermediate, Premium, Super Premium |
| Applications Covered | Graphite Electrodes, Silicon Metal and Ferroalloys, Lithium-ion Battery, Carbon Black, Rubber Compounds, Others |
| End Use Industries Covered | Aluminum and Steel, Automotive, Semiconductor, Others |
| Regions Covered | Asia Pacific, Europe, North America, Latin America, Middle East and Africa |
| Countries Covered | United States, Canada, Germany, France, United Kingdom, Italy, Spain, China, Japan, India, South Korea, Australia, Indonesia, Brazil, Mexico |
| Companies Covered | Asbury Carbons Inc., GrafTech International Ltd., Graphite India Limited, Mitsubishi Chemical Holdings Corporation, Nippon Steel Chemical & Material Co., Ltd., Phillips 66 Company, Sojitz Corporation, Sumitomo Corporation, etc. |
| Customization Scope | 10% Free Customization |
| Post-Sale Analyst Support | 10-12 Weeks |
| Delivery Format | PDF and Excel through Email (We can also provide the editable version of the report in PPT/Word format on special request) |
Key Benefits for Stakeholders:
- IMARC’s report offers a comprehensive quantitative analysis of various market segments, historical and current market trends, market forecasts, and dynamics of the needle coke market from 2020-2034.
- The research study provides the latest information on the market drivers, challenges, and opportunities in the global needle coke market.
- The study maps the leading, as well as the fastest-growing, regional markets. It further enables stakeholders to identify the key country-level markets within each region.
- Porter's Five Forces analysis assists stakeholders in assessing the impact of new entrants, competitive rivalry, supplier power, buyer power, and the threat of substitution. It helps stakeholders to analyze the level of competition within the needle coke industry and its attractiveness.
- Competitive landscape allows stakeholders to understand their competitive environment and provides an insight into the current positions of key players in the market.
Frequently Asked Questions About the Needle Coke Market Report
The needle coke market was valued at USD 4.6 Billion in 2025.
IMARC estimates the needle coke market to exhibit a CAGR of 4.39% during 2026-2034, reaching a value of USD 6.9 Billion by 2034.
The key factors driving the needle coke market include the increasing demand for high-performance lithium-ion batteries for EVs and renewable energy systems, the growing steel production driven by electric arc furnaces (EAFs), advancements in oil and gas exploration, and expanding aerospace and automotive sectors.
Asia Pacific currently dominates the needle coke market, accounting for a share exceeding 81.8%. This dominance is fueled by rapid industrialization, urbanization, the booming EV sector, and high steel production in countries like China and India.
Some of the major players in the needle coke market include Asbury Carbons Inc., GrafTech International Ltd., Graphite India Limited, Mitsubishi Chemical Holdings Corporation, Nippon Steel Chemical & Material Co., Ltd., Phillips 66 Company, Sojitz Corporation, and Sumitomo Corporation, among others.
Need more help?
- Speak to our experienced analysts for insights on the current market scenarios.
- Include additional segments and countries to customize the report as per your requirement.
- Gain an unparalleled competitive advantage in your domain by understanding how to utilize the report and positively impacting your operations and revenue.
- For further assistance, please connect with our analysts.
 Request Customization
 Speak to an Analyst
 Request Brochure
 Inquire Before Buying
Benefits of Customization
- Personalize this research
- Triangulate with your data
- Get data as per your format and definition
- Gain a deeper dive into a specific application, geography, customer, or competitor
- Any level of personalization
Get in Touch With Us
UNITED STATES
Phone: +1-201-971-6302
INDIA
Phone: +91-120-433-0800
UNITED KINGDOM
Phone: +44-753-714-6104
Email: [email protected]
Client Testimonials


.webp)


