
Neodymium Prices, Trend, Chart, Demand, Market Analysis, News, Historical and Forecast Data Report 2026 Edition
Neodymium Price Trend, Index and Forecast
Track real-time and historical neodymium prices across global regions. Updated monthly with market insights, drivers, and forecasts.
Neodymium Prices June 2026
| Region | Price (USD/Kg) | Latest Movement |
|---|---|---|
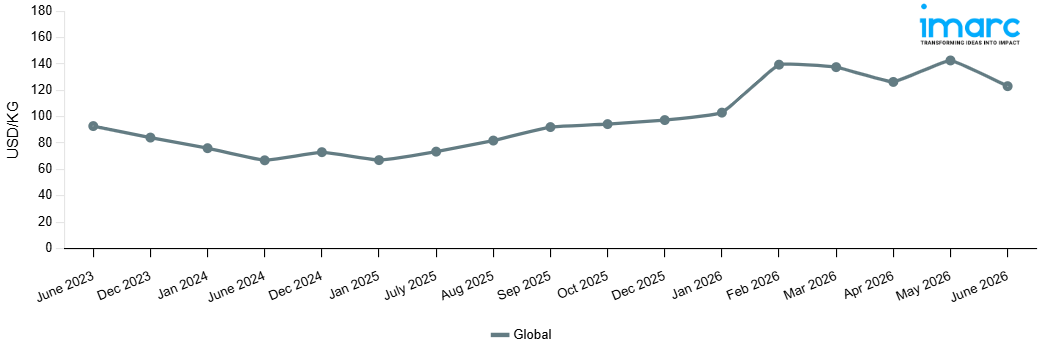
| Global | 123.12 | -13.7% ↓ Down |
Neodymium Price Index (USD/KG):
The chart below highlights monthly neodymium prices across different regions.
Get Access to Monthly/Quarterly/Yearly Prices, Request Sample
Market Overview Q1 Ending March 2026
Global: The neodymium prices in the global market reached 137.56 USD/KG in March 2026. The upward pricing movement registered between December and March 2026 was 41.2%. The unusually large price appreciation was primarily driven by significantly tightened global supply dynamics, resulting from strengthened production quota enforcement and stringent oversight of the world’s top rare earth mining and separation facilities, which significantly impacted the supply of refined neodymium products across major global production hubs. The continued demand from permanent magnet manufacturing activities further intensified purchasing pressure, fueled by accelerating production timetables for electric motors for electric vehicles, wind turbine installation programs, and the expanding adoption of industrial automation and robotics systems globally. The rising costs of rare earth ore extraction and solvent extraction further increased global refining costs. In addition, the increased demand from consumer electronics, medical imaging, and defense technology segments continued to provide strong offtake demand fundamentals. The intensified stockpiling activities of downstream sintered magnet producers, which anticipated prolonged supply chain disruptions amidst the changing export control environment and nationalization risks, further increased the purchasing pressure.
Market Overview Q4 Ending December 2025
Global: The neodymium prices in the global market reached 97.39 USD/KG in December 2025. The upward pricing movement registered between September and December 2025 was 5.8%. Global markets experienced notable price strengthening as demand from permanent magnet manufacturers accelerated throughout the quarter, driven primarily by robust production schedules in the electric vehicle and renewable energy sectors. Procurement activity intensified as automotive manufacturers ramped up EV motor production to meet year-end delivery targets and capitalize on regulatory incentives in major markets. Wind turbine installations likewise maintained strong momentum, with project developers securing neodymium-iron-boron magnet supplies for ongoing installation schedules. Chinese producers, who dominate global output, maintained disciplined production levels that prevented market oversaturation while meeting increasing consumption, thereby maintaining relatively controlled supply conditions. End users' strategic hoarding in anticipation of potential supply chain disruptions increased demand pressure, especially for businesses seeking to acquire essential commodities before anticipated regulatory changes.
Market Overview Q3 Ending September 2025
Global: In the global market, neodymium prices rose sharply this quarter as strong demand from the renewable energy and electronics industries supported upward momentum. The neodymium price index reflected robust procurement for permanent magnets used in wind turbines and electric vehicles, while supply constraints from key producing regions contributed to higher costs. Increased demand from high-tech applications, including smartphones and consumer electronics, further tightened availability. Despite stable mining output, higher processing costs and limited inventories amplified bullish sentiment, resulting in significant price gains.
Neodymium Price Trend, Market Analysis, and News
IMARC's latest publication, “Neodymium Prices, Trend, Chart, Demand, Market Analysis, News, Historical and Forecast Data Report 2026 Edition,” presents a detailed examination of the neodymium market, providing insights into both global and regional trends that are shaping prices. This report delves into the spot price of neodymium at major ports and analyzes the composition of prices, including FOB and CIF terms. It also presents detailed neodymium prices trend analysis by region, covering North America, Europe, Asia Pacific, Latin America, and Middle East and Africa. The factors affecting neodymium pricing, such as the dynamics of supply and demand, geopolitical influences, and sector-specific developments, are thoroughly explored. This comprehensive report helps stakeholders stay informed with the latest market news, regulatory updates, and technological progress, facilitating informed strategic decision-making and forecasting.
.webp)
Neodymium Industry Analysis
The global neodymium industry size reached 41.5 Thousand Tons in 2025. By 2034, IMARC Group expects the market to reach 60.2 Thousand Tons, at a projected CAGR of 4.11% during 2026-2034. Growth is fueled by rising demand for permanent magnets in electric vehicles and renewable energy systems, along with expanding applications in electronics, defense, and advanced manufacturing. Increasing adoption of green technologies underscores neodymium’s critical role in global industrial transformation.
Latest developments in the Neodymium Industry:
- September 2025: Canadian specialty materials firm Neo Performance Materials inaugurated Europe’s first large-scale neodymium-iron-boron (NdFeB) magnet production plant in Estonia. The move supports Europe’s drive to reduce dependence on Chinese-dominated rare earth supply chains.
- July 2025: Japanese firm Proterial announced the development of heavy-rare-earth-free neodymium sintered magnets (branded NMX-F1SH-HF and NMX-G1NH-HF), offering high residual magnetic flux density and coercive force without using heavy rare earths—an innovation that could alleviate pressure on neodymium supply chains.
- April 2025: Solvay expanded its La Rochelle facility to boost neodymium processing, targeting demand for EVs and wind turbines. The move followed China’s export restrictions on rare earths, spurring Europe to strengthen regional supply chains.
- January 2025: MP Materials commenced commercial production of neodymium-praseodymium (NdPr) metal and initiated trial production of automotive-grade, sintered neodymium-iron-boron (NdFeB) magnets at its Independence facility in Fort Worth, Texas. This marks a significant step toward restoring a domestic supply chain for neodymium in the United States.
Product Description
Neodymium is a rare earth element belonging to the lanthanide series, recognized for its bright silvery appearance and strong magnetic properties. While relatively soft and malleable in pure form, it is most commonly alloyed with iron and boron to create neodymium-iron-boron (NdFeB) magnets, among the strongest permanent magnets known. These magnets are essential for high-performance applications, including electric motors, wind turbines, computer hard drives, and advanced medical imaging equipment. Beyond magnets, neodymium is also used in specialized glass coloring, lasers, and protective lenses. Its critical importance in clean energy and modern electronics makes it one of the most strategically valuable rare earth elements.
Report Coverage
| Key Attributes | Details |
|---|---|
| Product Name | Neodymium |
| Report Features | Exploration of Historical Trends and Market Outlook, Industry Demand, Industry Supply, Gap Analysis, Challenges, Neodymium Price Analysis, and Segment-Wise Assessment. |
| Currency/Units | US$ (Data can also be provided in local currency) or Metric Tons |
| Region/Countries Covered | The current coverage includes analysis at the global and regional levels only. Based on your requirements, we can also customize the report and provide specific information for the following countries: Asia Pacific: China, India, Indonesia, Pakistan, Bangladesh, Japan, Philippines, Vietnam, Thailand, South Korea, Malaysia, Nepal, Taiwan, Sri Lanka, Hongkong, Singapore, Australia, and New Zealand Europe: Germany, France, United Kingdom, Italy, Spain, Russia, Turkey, Netherlands, Poland, Sweden, Belgium, Austria, Ireland, Switzerland, Norway, Denmark, Romania, Finland, Czech Republic, Portugal and Greece North America: United States and Canada Latin America: Brazil, Mexico, Argentina, Columbia, Chile, Ecuador, and Peru Middle East & Africa: Saudi Arabia, UAE, Israel, Iran, South Africa, Nigeria, Oman, Kuwait, Qatar, Iraq, Egypt, Algeria, and Morocco The list of countries presented is not exhaustive. Information on additional countries can be provided if required by the client. |
| Information Covered for Key Suppliers |
|
| Customization Scope | The report can be customized as per the requirements of the customer |
| Report Price and Purchase Option |
Plan A: Monthly Updates - Annual Subscription
Plan B: Quarterly Updates - Annual Subscription
Plan C: Biannually Updates - Annual Subscription
|
| Post-Sale Analyst Support | 360-degree analyst support after report delivery |
| Delivery Format | PDF and Excel through email (We can also provide the editable version of the report in PPT/Word format on special request) |
Key Benefits for Stakeholders:
- IMARC’s report presents a detailed analysis of neodymium pricing, covering global and regional trends, spot prices at key ports, and a breakdown of ex-works, FOB, and CIF prices.
- The study examines factors affecting neodymium price trend, including supply-demand shifts and geopolitical impacts, offering insights for informed decision-making.
- The competitive landscape review equips stakeholders with crucial insights into the latest market news, regulatory changes, and technological advancements, ensuring a well-rounded, strategic overview for forecasting and planning.
- IMARC offers various subscription options, including monthly, quarterly, and biannual updates, allowing clients to stay informed with the latest market trends, ongoing developments, and comprehensive market insights. The neodymium price charts ensure our clients remain at the forefront of the industry.
Frequently Asked Questions About the Neodymium Price Trend Report
The neodymium price in June 2026 was 123.12 USD/KG in the global market.
The neodymium pricing data is updated on a monthly basis.
We provide the pricing data primarily in the form of an Excel sheet and a PDF.
Yes, our report includes a forecast for neodymium prices.
The regions covered include North America, Europe, Asia Pacific, Middle East, and Latin America. Countries can be customized based on the request (additional charges may be applicable).
Yes, we provide both FOB and CIF prices in our report.
Need more help?
- Speak to our experienced analysts for insights on the current market scenarios.
- Include additional segments and countries to customize the report as per your requirement.
- Gain an unparalleled competitive advantage in your domain by understanding how to utilize the report and positively impacting your operations and revenue.
- For further assistance, please connect with our analysts.
 Request Customization
 Inquire Before Buying
 Speak to an Analyst
 Request Brochure
Benefits of Customization
- Personalize this research
- Triangulate with your data
- Get data as per your format and definition
- Gain a deeper dive into a specific application, geography, customer, or competitor
- Any level of personalization
Get in Touch With Us
UNITED STATES
Phone: +1-201-971-6302
INDIA
Phone: +91-120-433-0800
UNITED KINGDOM
Phone: +44-753-714-6104
Email: [email protected]
Client Testimonials


.webp)


Why Choose Us
IMARC offers trustworthy, data-centric insights into commodity pricing and evolving market trends, enabling businesses to make well-informed decisions in areas such as procurement, strategic planning, and investments. With in-depth knowledge spanning more than 1000 commodities and a vast global presence in over 150 countries, we provide tailored, actionable intelligence designed to meet the specific needs of diverse industries and markets.
1000
+Commodities
150
+Countries Covered
3000
+Clients
20
+Industry
Robust Methodologies & Extensive Resources
IMARC delivers precise commodity pricing insights using proven methodologies and a wealth of data to support strategic decision-making.
Subscription-Based Databases
Our extensive databases provide detailed commodity pricing, import-export trade statistics, and shipment-level tracking for comprehensive market analysis.
Primary Research-Driven Insights
Through direct supplier surveys and expert interviews, we gather real-time market data to enhance pricing accuracy and trend forecasting.
Extensive Secondary Research
We analyze industry reports, trade publications, and market studies to offer tailored intelligence and actionable commodity market insights.
Trusted by 3000+ industry leaders worldwide to drive data-backed decisions. From global manufacturers to government agencies, our clients rely on us for accurate pricing, deep market intelligence, and forward-looking insights.