
Netherlands Children’s Entertainment Centers Market Size, Share, Trends and Forecast by Visitor Demographics, Facility Size, Revenue Source, Activity Area, and Region, 2026-2034
Netherlands Children’s Entertainment Centers Market Overview:
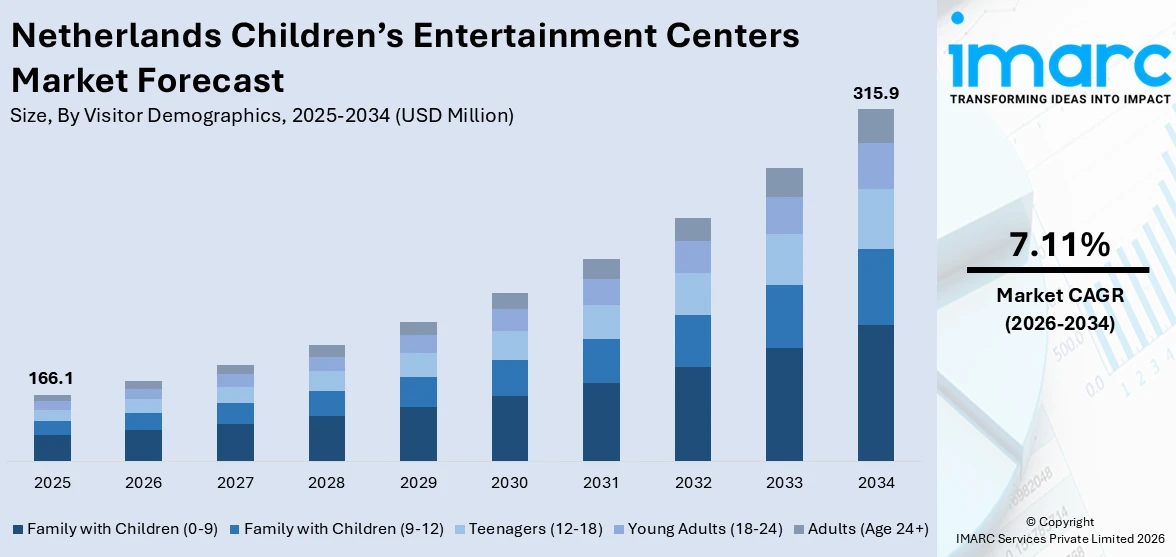
The Netherlands children’s entertainment centers market size reached USD 166.1 Million in 2025. Looking forward, IMARC Group expects the market to reach USD 315.9 Million by 2034, exhibiting a growth rate (CAGR) of 7.11% during 2026-2034. Rising disposable income, increasing demand for family leisure activities, urban population growth, themed indoor play areas, and growing focus on child development through play are some of the factors contributing to the Netherlands children’s entertainment centers market share. Seasonal tourism and school holiday traffic also boost market growth.
|
Report Attribute
|
Key Statistics
|
|---|---|
|
Base Year
|
2025
|
|
Forecast Years
|
2026-2034
|
|
Historical Years
|
2020-2025
|
| Market Size in 2025 | USD 166.1 Million |
| Market Forecast in 2034 | USD 315.9 Million |
| Market Growth Rate 2026-2034 | 7.11% |
Netherlands Children’s Entertainment Centers Market Trends:
Shift toward Educational Entertainment
Children’s entertainment centers in the Netherlands are increasingly adopting education-based themes. Operators are blending learning with play, not just to meet the expectations of parents but also to align with national initiatives that support informal learning environments. Centers now feature STEM zones, language learning corners, and historical simulations. These aren’t just decorative elements; they’re designed to keep children engaged for longer durations while supporting school curricula indirectly. There’s a strong local emphasis on cognitive and emotional development, especially among preschoolers and early primary school children. Municipalities and school boards are sometimes involved in these ventures, with co-funding or marketing partnerships in place. This trend also aligns with the broader Dutch focus on child-centric urban planning, where play and learning are embedded in daily routines. Centers that previously focused solely on physical activities like trampolines or soft-play zones are now diversifying into storytelling corners, puzzle-based missions, and arts workshops. The success of such models in cities like Utrecht and Eindhoven is prompting smaller towns to explore similar adaptations. These factors are intensifying the Netherlands children’s entertainment centers market growth.
To get more information on this market, Request Sample
Rise of Digital Integration and Gamification
A very different trend sweeping through children’s entertainment centers in the Netherlands is the heavy use of digital platforms. These aren't basic arcade machines or virtual rides; venues are investing in interactive floors, motion-sensor gaming zones, and app-based scavenger hunts synced with in-house content. RFID wristbands are being used to track participation and offer rewards, creating a hybrid between gaming and physical activity. Operators are responding to kids’ growing comfort with smartphones, tablets, and online multiplayer games. They’re trying to replicate that engagement in a group setting. Virtual leaderboards, augmented reality zones, and team missions are designed to foster competition and cooperation. Some venues now offer digital “party hosts” through touchscreens and voice assistants. A few even let parents customize the day’s activities via apps before arriving. Tech-focused centers tend to be newer or recently overhauled, often located in urban or suburban regions with high-income families. The investment cost is high, but so is the return, thanks to dynamic pricing, digital merchandising, and longer visit durations. This gamification trend is moving fast and is pulling the market in a direction that favors tech-savvy brands.
Netherlands Children’s Entertainment Centers Market Segmentation:
IMARC Group provides an analysis of the key trends in each segment of the market, along with forecasts at the country and regional levels for 2026-2034. Our report has categorized the market based on visitor demographics, facility size, revenue source, and activity area.
Visitor Demographics Insights:
- Family with Children (0-9)
- Family with Children (9-12)
- Teenagers (12-18)
- Young Adults (18-24)
- Adults (Age 24+)
The report has provided a detailed breakup and analysis of the market based on the visitor demographics. This includes family with children (0-9), family with children (9-12), teenagers (12-18), young adults (18-24), and adults (age 24+).
Facility Size Insights:
Access the comprehensive market breakdown Request Sample
- Up to 5,000 Sq. Ft.
- 5,001 to 10,000 Sq. Ft.
- 10,001 to 20,000 Sq. Ft.
- 20,001 to 40,000 Sq. Ft.
- 1 to 10 Acres
- 11 to 30 Acres
- Over 30 Acres
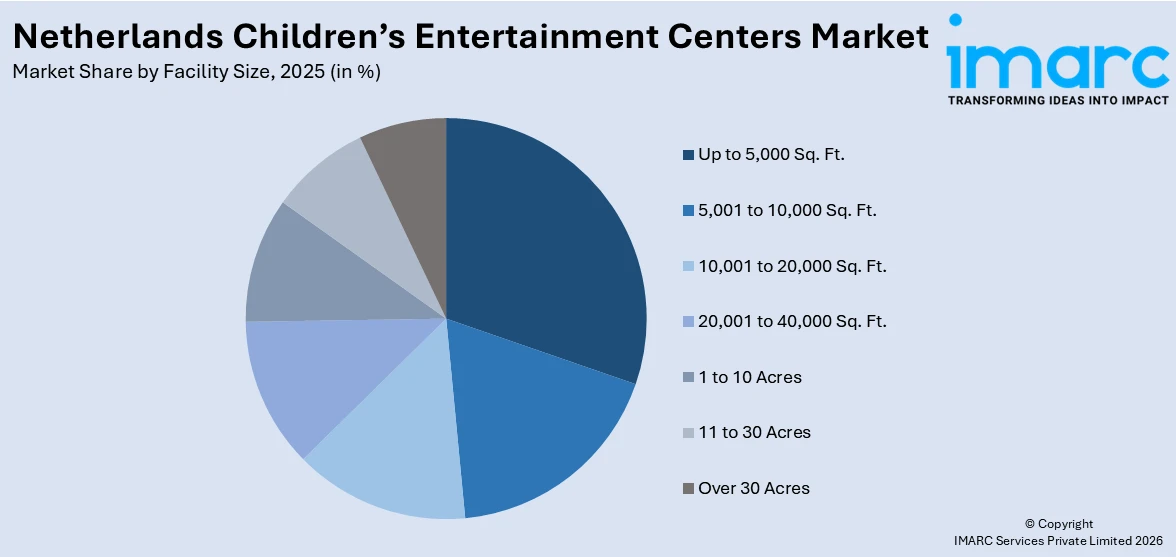
The report has provided a detailed breakup and analysis of the market based on the facility size. This includes up to 5,000 sq. ft., 5,001 to 10,000 sq. ft., 10,001 to 20,000 sq. ft., 20,001 to 40,000 sq. ft., 1 to 10 acres, 11 to 30 acres, and over 30 acres.
Revenue Source Insights:
- Entry Fees and Ticket Sales
- Food and Beverages
- Merchandising
- Advertising
- Others
The report has provided a detailed breakup and analysis of the market based on the revenue source. This includes entry fees and ticket sales, food and beverages, merchandising, advertising, and others.
Activity Area Insights:
- Arcade Studios
- AR and VR Gaming Zone
- Physical Play Activities
- Skill/Competition Games
- Others
A detailed breakup and analysis of the market based on the activity area have also been provided in the report. This includes arcade studios, AR and VR gaming zone, physical play activities, skill/competition games, and others.
Regional Insights:
- Noord-Holland
- Zuid-Holland
- Noord-Brabant
- Gelderland
- Utrecht
- Others
The report has also provided a comprehensive analysis of all the major regional markets, which include Noord-Holland, Zuid-Holland, Noord-Brabant, Gelderland, Utrecht, and others.
Competitive Landscape:
The market research report has also provided a comprehensive analysis of the competitive landscape. Competitive analysis such as market structure, key player positioning, top winning strategies, competitive dashboard, and company evaluation quadrant has been covered in the report. Also, detailed profiles of all major companies have been provided.
Netherlands Children’s Entertainment Centers Market News:
- In September 2024, at IAAPA Expo Europe in Amsterdam, Bommelwereld, a new 9,000 sqm indoor theme park themed around Olivier B. Bommel, was revealed. The park will open in Groenlo in October 2025 and feature over 20 attractions set within Castle Bommelstein. A virtual tour and floor plan were showcased at Jora Vision’s booth, offering a preview of what’s set to become a major regional draw for children’s entertainment in the Netherlands.
Netherlands Children’s Entertainment Centers Market Report Coverage:
| Report Features | Details |
|---|---|
| Base Year of the Analysis | 2025 |
| Historical Period | 2020-2025 |
| Forecast Period | 2026-2034 |
| Units | Million USD |
| Scope of the Report |
Exploration of Historical Trends and Market Outlook, Industry Catalysts and Challenges, Segment-Wise Historical and Future Market Assessment:
|
| Visitor Demographics Covered | Family with Children (0-9), Family with Children (9-12), Teenagers (12-18), Young Adults (18-24), Adults (Age 24+) |
| Facility Sizes Covered | Up to 5,000 Sq. Ft., 5,001 to 10,000 Sq. Ft., 10,001 to 20,000 Sq. Ft., 20,001 to 40,000 Sq. Ft., 1 to 10 Acres, 11 to 30 Acres, Over 30 Acres |
| Revenue Sources Covered | Entry Fees and Ticket Sales, Food and Beverages, Merchandising, Advertising, Others |
| Activity Areas Covered | Arcade Studios, AR and VR Gaming Zone, Physical Play Activities, Skill/Competition Games, Others |
| Regions Covered | Noord-Holland, Zuid-Holland, Noord-Brabant, Gelderland, Utrecht, Others |
| Customization Scope | 10% Free Customization |
| Post-Sale Analyst Support | 10-12 Weeks |
| Delivery Format | PDF and Excel through Email (We can also provide the editable version of the report in PPT/Word format on special request) |
Key Questions Answered in This Report:
- How has the Netherlands children’s entertainment centers market performed so far and how will it perform in the coming years?
- What is the breakup of the Netherlands children’s entertainment centers market on the basis of visitor demographics?
- What is the breakup of the Netherlands children’s entertainment centers market on the basis of facility size?
- What is the breakup of the Netherlands children’s entertainment centers market on the basis of revenue source?
- What is the breakup of the Netherlands children’s entertainment centers market on the basis of activity area?
- What is the breakup of the Netherlands children’s entertainment centers market on the basis of region?
- What are the various stages in the value chain of the Netherlands children’s entertainment centers market?
- What are the key driving factors and challenges in the Netherlands children’s entertainment centers market?
- What is the structure of the Netherlands children’s entertainment centers market and who are the key players?
- What is the degree of competition in the Netherlands children’s entertainment centers market?
Key Benefits for Stakeholders:
- IMARC’s industry report offers a comprehensive quantitative analysis of various market segments, historical and current market trends, market forecasts, and dynamics of the Netherlands children’s entertainment centers market from 2020-2034.
- The research report provides the latest information on the market drivers, challenges, and opportunities in the Netherlands children’s entertainment centers market.
- Porter's five forces analysis assist stakeholders in assessing the impact of new entrants, competitive rivalry, supplier power, buyer power, and the threat of substitution. It helps stakeholders to analyze the level of competition within the Netherlands children’s entertainment centers industry and its attractiveness.
- Competitive landscape allows stakeholders to understand their competitive environment and provides an insight into the current positions of key players in the market.
Need more help?
- Speak to our experienced analysts for insights on the current market scenarios.
- Include additional segments and countries to customize the report as per your requirement.
- Gain an unparalleled competitive advantage in your domain by understanding how to utilize the report and positively impacting your operations and revenue.
- For further assistance, please connect with our analysts.
 Request Customization
 Speak to an Analyst
 Request Brochure
 Inquire Before Buying
Benefits of Customization
- Personalize this research
- Triangulate with your data
- Get data as per your format and definition
- Gain a deeper dive into a specific application, geography, customer, or competitor
- Any level of personalization
Get in Touch With Us
UNITED STATES
Phone: +1-201-971-6302
INDIA
Phone: +91-120-433-0800
UNITED KINGDOM
Phone: +44-753-714-6104
Email: [email protected]
Client Testimonials


.webp)


