Boric Acid Price Update: Sustained Growth Across Key Markets in Q2 2026
21-Sep-2026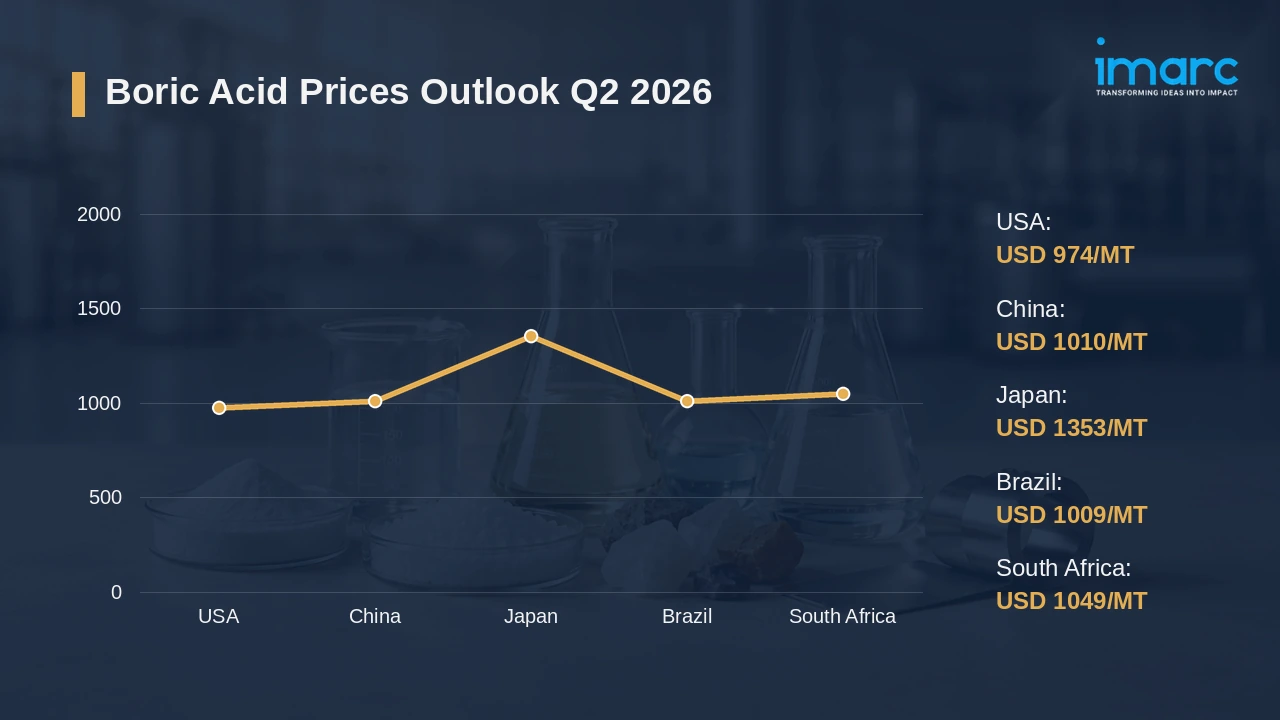
Boric acid is a white, odorless crystalline solid that behaves as a weak acid in aqueous systems and offers notable thermal stability alongside flame retardant behavior. Spanning borosilicate glass, fiberglass, ceramics, detergents, and fertilizers, end uses remain broad. Across producing regions, boric acid prices respond to upstream borate ore economics, refining energy expenditure, ocean freight movements, and agricultural procurement cycles in key consuming markets.
Global Market Overview:
Globally, the boric acid industry reached a volume of 1,046.82 Thousand Tons in 2025. Market projections indicate steady growth, with the industry expected to reach a volume of 1,569.50 Thousand Tons by 2034, with a compound annual growth rate (CAGR) of 4.60% during 2026-2034. Photovoltaic glass capacity additions anchor demand growth. Adding to this, fiberglass insulation programs and agricultural micronutrient uptake shape the boric acid price trend across consuming regions.
Boric Acid Price Trend Q2 2026:
Regional prices (USD per MT) and QoQ changes Q2 2026 vs Q1 2026:
| Region | Price (USD/MT) | QoQ Change | Direction |
|---|---|---|---|
| USA | 974 | +6.32% | ↑ |
| China | 1,010 | +5.56% | ↑ |
| Japan | 1,353 | +30.31% | ↑ |
| Brazil | 1,009 | +3.12% | ↑ |
| South Africa | 1,049 | +4.67% | ↑ |
To access real-time prices Request Sample
What Moved Prices
USA:
- In Q2 2026, boric acid prices in the USA climbed to USD 974/MT, supported by consistent offtake from glass, pharmaceutical, agricultural, and specialty chemical users during the opening months. Distributors maintained inventory coverage against firm replacement costs. Late in the quarter, softer sodium tetraborate costs widened supplier quoting flexibility even as domestic output stayed stable.
- Fiberglass insulation and construction linked consumption softened toward June, trimming the urgency behind spot purchases. Once seasonal application windows closed, agricultural buying eased, leaving comfortable warehouse positions across Gulf Coast terminals and the inland distribution network. Sellers consequently lost some leverage in late-quarter negotiations.
China:
- During Q2 2026, boric acid prices in China advanced to USD 1,010/MT as imported supply tightened and replacement costs climbed steadily through much of the trading period. Fewer arrivals from Turkey reduced port inventories. With borax valuations higher, sellers gained confidence across domestic and imported offer levels.
- Lengthening lead times on inbound routes pushed import dependent buyers to secure cargoes earlier than usual, and photovoltaic glass producers kept absorbing higher purity grades despite uneven ceramics offtake. Demand from ordinary glass makers stayed patchy. Through the quarter, the boric acid price chart tracked a steady climb.
Japan:
- During Q2 2026, boric acid prices in Japan surged to USD 1,353/MT as heavy import dependence exposed buyers to tighter overseas availability and sharply elevated replacement costs. Shipment delays limited prompt cargo options for distributors. With the yen weaker, landed costs rose further on material purchased in foreign currency.
- Maintenance activity affecting overseas supply narrowed sourcing flexibility for Japanese distributors, who retained limited room to defer purchases while electronics, specialty glass, and pharmaceutical users held high purity requirements. For most buyers, delivery risk outweighed price sensitivity. Procurement teams therefore accepted higher assessed values across contract and spot channels.
Brazil:
- In the second quarter of 2026, boric acid prices in Brazil rose to USD 1,009/MT as continued import dependence exposed buyers to firmer replacement costs on international supply routes. Steady agricultural demand kept procurement schedules active. Alongside this, boron based micronutrient formulations sustained distributor offtake, while glass and ceramics orders added baseline volume.
- Ocean freight and inland distribution charges continued shaping replacement economics for importers drawing material from both international and regional suppliers during the quarter, adding to delivered cost pressure. Beyond freight, currency movements shaped purchasing timing decisions. Because cargoes were commonly invoiced in foreign currency, industrial chemical and glass applications still absorbed available volumes.
South Africa:
- During Q2 2026, boric acid prices in South Africa advanced to USD 1,049/MT as heavy reliance on imported material left buyers sensitive to freight, currency, and delivery conditions. Agricultural micronutrient demand stayed supportive across the quarter. Across several crop applications, boron based products remained necessary, while glass consumption held baseline procurement steady.
- Beyond agriculture, mining related processing added volume to regional order books. Careful inventory management became necessary for importers because uncertain delivery schedules could tighten prompt availability at short notice, particularly for buyers without contracted coverage during the quarter. With the rand softer, elevated inland logistics charges lifted landed costs above prior quarter levels.
Drivers Influencing the Market:
Several factors continue to shape boric acid pricing and market behavior:
- Glass, Fiberglass, and Ceramics Demand: Borosilicate glass, fiberglass insulation, and ceramic glaze production absorb the largest share of global boric acid volumes. Across Asian manufacturing clusters, photovoltaic glass capacity expansion has added a newer consumption stream, while construction linked insulation demand moves with regional building activity cycles. Beyond industrial uses, agricultural micronutrient consumption broadens the base. Seasonal furnace maintenance at glass plants introduces periodic swings into the boric acid price index across consuming regions.
- Upstream Borate Ore Availability and Cost: Boric acid output depends on borate minerals including colemanite, ulexite, kernite, and tincal, leaving producers exposed to concentrated mine supply across a small group of countries. Per the USGS, Turkish refined borate production fell to 1,500 Thousand Metric Tons in 2025, down from 1,800 Thousand Metric Tons recorded in 2024. Sodium tetraborate costs move in parallel. Where the dominant supplier contracts, feedstock availability tightens and replacement costs climb downstream.
- Energy Expenditure in Refining and Calcination: Converting borate ore into refined boric acid requires sustained thermal input across dissolution, crystallization, and drying stages. Per the EIA, US industrial natural gas consumption averaged a record 23.6 Billion cubic feet per day in 2025, with the chemicals subsector remaining the largest industrial user. Once utility contracts reset, producer cost baselines shift again. Regional tariff gaps shape competitive positioning between North American, Turkish, and Chinese plants.
- Ocean Freight and Logistics Economics: Across import dependent markets in Japan, Brazil, and South Africa, freight cost enters delivered valuations directly. Container spot rates on Asia to Europe and Transpacific corridors set the pace for landed economics, and carriers adjust capacity through blank sailings when demand softens. Beyond base rates, surcharge announcements add a further layer. Landed costs consequently outpaced ex-works price movements through the quarter.
- Environmental and Regulatory Compliance: Across borate mining and refining operations, inspection regimes cover effluent discharge, dust control, and worker exposure limits. Reproductive toxicity classification of boric acid under several chemical safety frameworks adds labeling, registration, and handling obligations for distributors and downstream formulators. As a result, compliance investment raises fixed operating costs. Producers meeting stricter standards often command firmer contract terms.
- Trade Policy and Currency Dynamics: Tariff schedules on boric acid imports, alongside export licensing in producing countries, redirect trade flows between consuming regions. Where currencies depreciate in import reliant markets such as Japan, Brazil, and South Africa, delivered cost rises even when reference quotations hold steady across the quarter. For most procurement teams, hedging decisions increasingly determine realized margins.
Recent Highlights & Strategic Developments:
Recent strategic moves within the industry further illustrate evolving dynamics:
- In October 2025, 5E Advanced Materials, Inc. shipped 20 Tons of boric acid produced at its Fort Cady site in Southern California. The company also signaled plans to dispatch a further 1,000 pounds toward domestic boron carbide production.
Outlook & Strategic Takeaways:
Looking ahead, the boric acid market is expected to expand steadily through 2034, carried by borosilicate glass output, fiberglass insulation programs, and agricultural micronutrient consumption across emerging economies. Borate ore availability from concentrated mining jurisdictions will remain the pivotal variable shaping the boric acid price forecast, with freight and currency swings adding shorter cycle volatility.
To navigate this complex landscape, stakeholders should:
- Monitor Regional Price Differentials: Track quarterly spreads across the USA, China, Japan, Brazil, and South Africa to time purchasing windows. Establish benchmarking protocols that compare landed costs against prevailing contract rates before volumes are committed.
- Secure Borate Feedstock Visibility: Map supplier exposure to concentrated borate mining jurisdictions and identify qualified alternate sources. Build contractual clauses that address ore availability disruptions before they translate into delivered cost escalation.
- Assess Freight Market Developments: Monitor container spot indices on Asia to Europe and Transpacific corridors ahead of contract renewals. Negotiate logistics agreements with adjustment mechanisms so boric acid price per MT stays predictable.
- Evaluate Downstream Demand Indicators: Track glass furnace utilization, fiberglass insulation orders, and agricultural application calendars across principal consuming regions. Correlate those signals with inventory positioning to avoid overstocking during seasonal demand troughs.
- Strengthen Currency Exposure Management: Implement hedging for procurement denominated in yen, real, and rand to stabilize landed cost projections. Coordinate treasury and sourcing teams so coverage aligns with anticipated import payment timelines.
- Review Regulatory Compliance Expenditures: Audit handling, labeling, and storage obligations arising from chemical safety classification of boric acid. Identify operational efficiencies that reduce administrative burden without weakening documented safety controls.
Subscription Plans & Customization:
IMARC offers flexible subscription models to suit varying needs:
- Monthly Updates: 12 deliverables/year
- Quarterly Updates: 4 deliverables/year
- Biannual Updates: 2 deliverables/year
Each includes detailed datasets (Excel + PDF) and post-report analyst support.
Get in Touch With Us
UNITED STATES
Phone: +1-201-971-6302
INDIA
Phone: +91-120-433-0800
UNITED KINGDOM
Phone: +44-753-714-6104
Email: [email protected]
Client Testimonials




.webp)




.webp)












