Home Pricing Intelligence

Pricing Intelligence and Cost Analysis that Drives Procurement Decisions

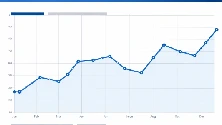
Monitor real-time commodity prices, uncover true supplier costs, and anticipate market shifts with confidence

Commodity Price Database - June 2026

Latest commodity prices with month-on-change, unit of measure, and region
Product M-o-M Price UOM Region
Sulphur 14% 0.98 USD/Kg Northeast Asia
Helium -10.3% 56.33 USD/Kg North America
Green Hydrogen -4.6% 6.9 USD/Kg Europe
Titanium -11.2% 6.34 USD/Kg North America
Ammonia -22.6% 0.65 USD/Kg Africa
banner-after

300+ Commodities Tracked​

banner-after

Global Price Coverage Across Key Markets​

banner-after

Monthly, Quarterly, Annual & Forecast Data​

banner-after

Analyze Prices Across INCOTERMS​

Your Pricing Intelligence Stack

pricing-stack

Price Tracking & Benchmarking

Monitor price movements across regions, benchmarks, and key trade routes to identify volatility, seasonality, and pricing cycles.

pricing-stack

Cost Structure Analysis

Analyze raw materials, energy, labor, and logistics to uncover cost drivers and optimize total cost of ownership.

pricing-stack

Price Forecasting

Anticipate future price movements using demand-supply dynamics, macroeconomic indicators, and market signals.

pricing-stack

Trade Flow & Import-Export Analysis​

Monitor import-export trends, key supplying countries, and trade routes to understand supply chain dynamics.

pricing-stack

Competitive Analysis

Track key competitor pricing strategies, market shares, and product portfolios to spot competitive advantages and benchmark your position.

pricing-stack

Supplier Cost Intelligence

Gain visibility into supplier margins, input costs, and pricing strategies to strengthen sourcing and contract negotiations.

pricing-stack

Regional Market Insights

Evaluate regional price differences, trade flows, and market conditions to identify cost advantages and sourcing opportunities.

pricing-stack

Demand Supply Gap

Analyze production, consumption, capacity, and inventory levels to uncover shortages, surpluses, and future price pressures.

pricing-stack

Price Drivers Analysis

Assess the impact of geopolitical events, regulations, feedstock prices, and demand shifts on commodity pricing.

pricing-stack

Cost Projections & Scenario Planning

Simulate cost changes based on raw material fluctuations, energy prices, and market disruptions.

How It Works

how-works

Data Collection

Global supplier data, trade flows, market inputs

how-works

Validation & Benchmarking

Multi-source verification

how-works

Analysis & Modeling

Cost breakdown + forecasting models

how-works

Delivery

Reports, dashboards, datasets

What You Receive

chart
Price Trend & Benchmark Reports

Detailed comprehensive historical and real-time price data across regions, including benchmarks, volatility analysis, and key market shifts.
chart
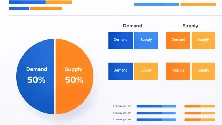
Demand - Supply Analysis

Evaluate production, consumption, capacity, and inventory levels to identify shortages, surpluses, and future price pressures.
chart
Price Forecasts with Market-Driven Insights

Forward-looking price projections based on demand-supply dynamics, macroeconomic trends, and industry-specific drivers.
chart
Excel Data, Excel Models & Custom Dashboards

Interactive data, Excel models, and customizable dashboards. Access structured datasets, cost models, and dashboards for deeper analysis and internal reporting.
chart
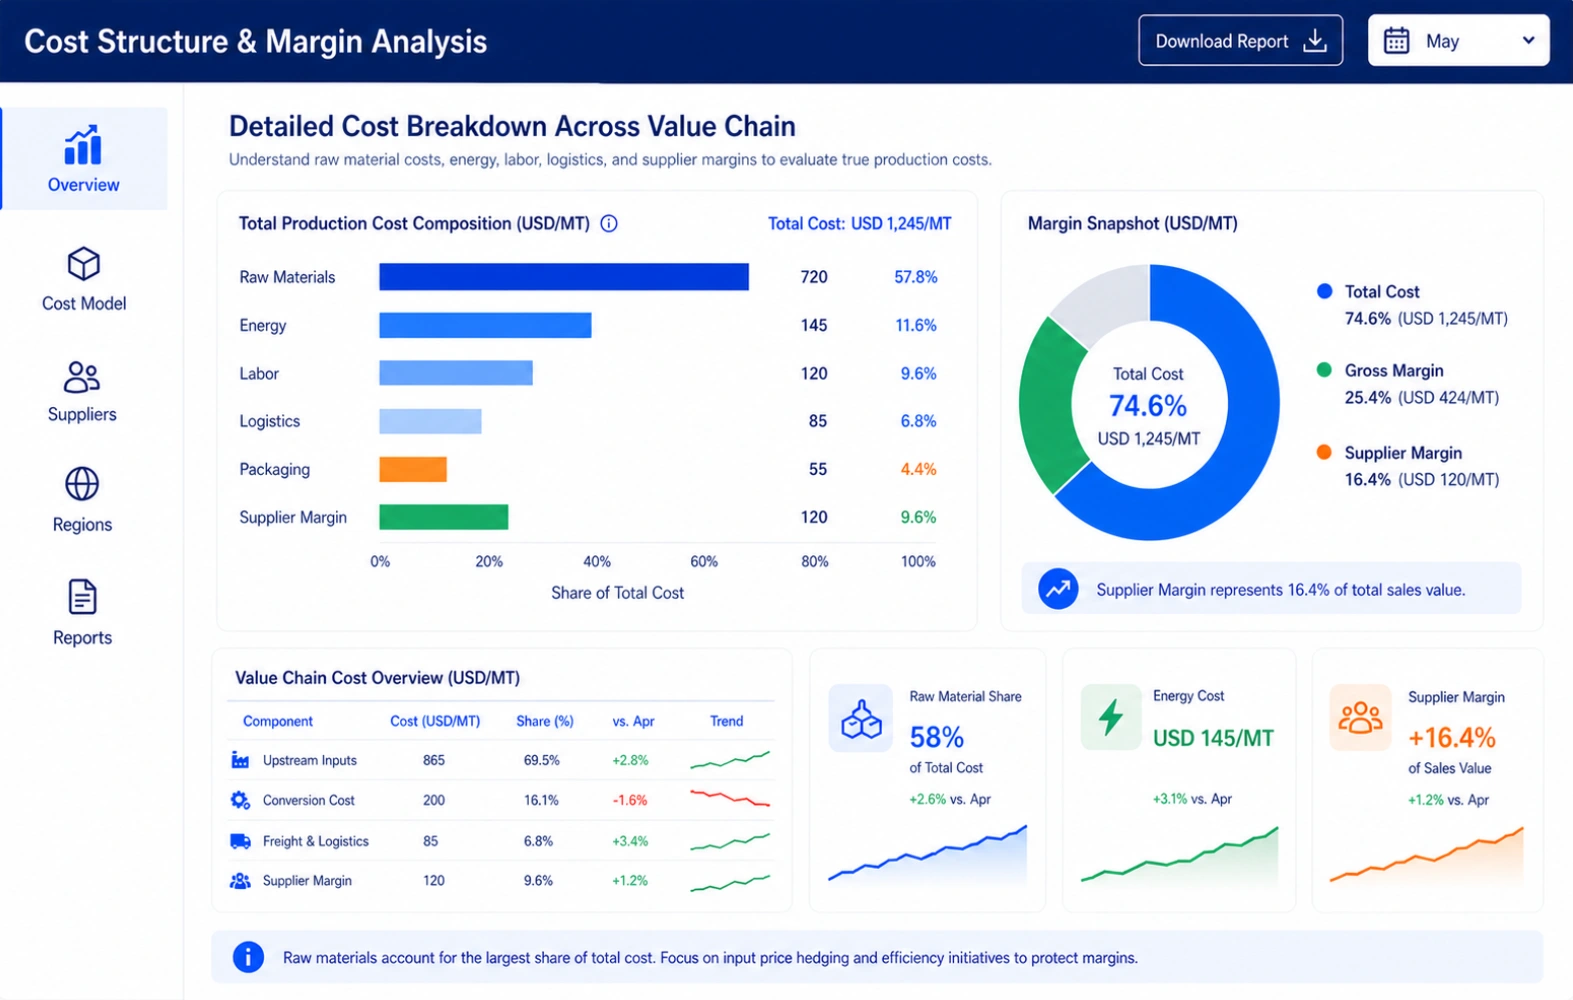
Cost Structure & Margin Analysis

Understand raw material costs, energy, labor, logistics, and supplier margins to evaluate true production costs.
chart
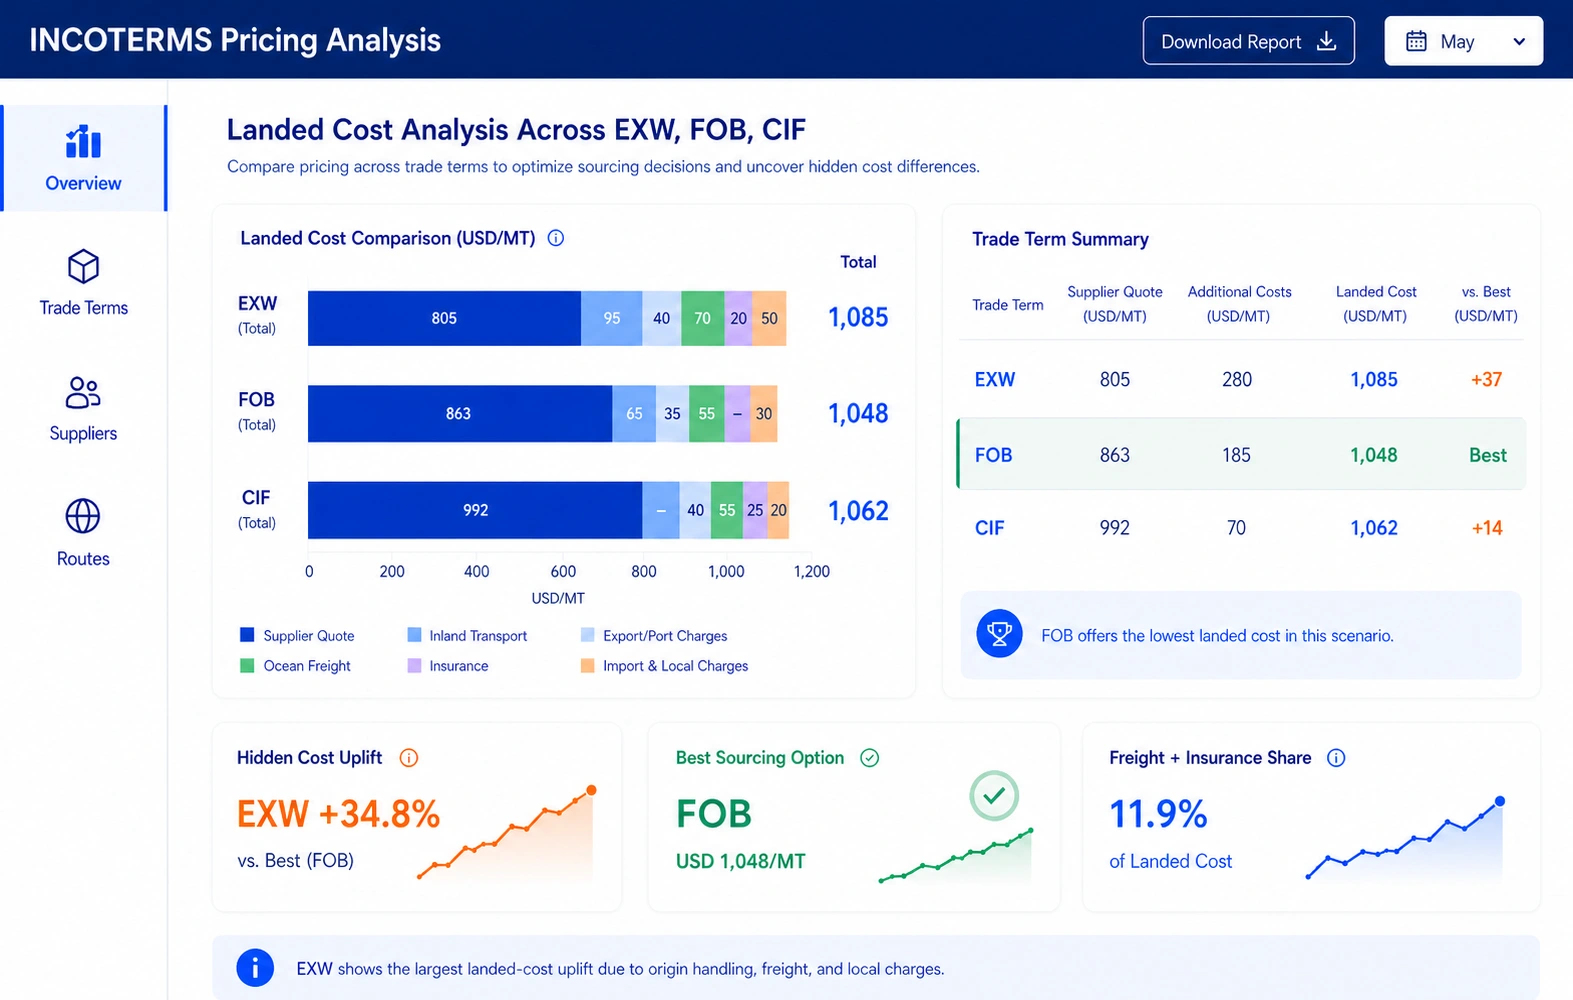
INCOTERMS Pricing Analysis

Compare pricing across trade terms to optimize sourcing decisions and uncover hidden cost differences.
chart
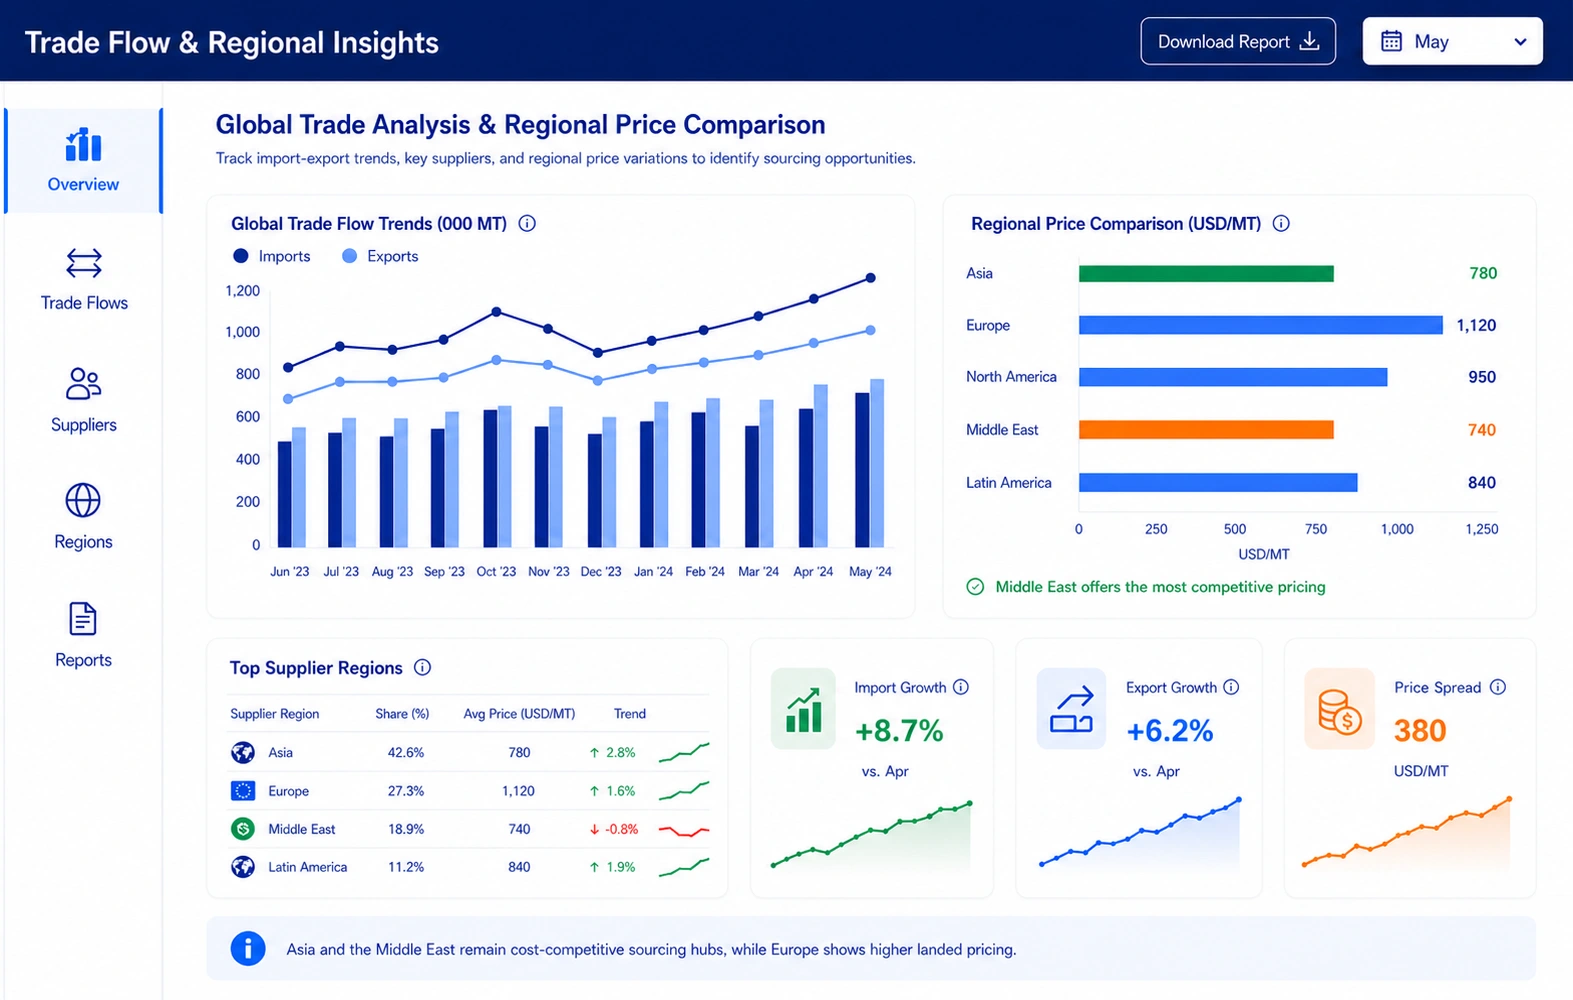
Trade Flow & Regional Insights

Track import-export trends, key suppliers, and regional price variations to identify sourcing opportunities.

Built for Decision Makers

Procurement & Sourcing Teams

Slash raw material costs, time purchases perfectly, and dominate supplier negotiations with accurate monthly price trends.

Strategy & Risk Management

Anticipate price shifts, crush volatility risks, and build winning strategies using deep demand-supply insights and forecasts.

Manufacturing & Operations

Lock in healthy profit margins by mastering real-time input cost movements and optimizing production planning.

Finance & Budgeting Teams

Dramatically improve cost forecasting accuracy, strengthen budgets, and protect margins with reliable price and driver analysis.

Investors & Commodity Traders

Capitalize on market cycles, predict price swings accurately, and make high-conviction investment decisions across regions.
THE IMARC ADVANTAGE

Why Businesses Choose IMARC

Get Pricing Intelligence built around your product, region and decision cycle.

why-us

Global and Local Coverage

Get precise price trends at global, regional, and country level for 300+ commodities.

From global benchmarks to country-specific insights.
why-us

Customized Reporting

Tailored reports with your specific commodities, formats, and frequency requirements.

Built around your commodity, use case, and workflow.
why-us

Expert Network Access

Direct access to our industry experts and analyst support for deeper insights.

Real-world inputs. Sharper insights.
why-us

Comprehensive Support

Ongoing analyst support, query resolution, and consultation throughout your subscription.

Your questions don't stop when the report is delivered.
why-us

Flexible Subscription Plans

Choose monthly, quarterly, or yearly plans that fit your budget and business needs.

Stay ahead with options that fit your business.

TRUSTED BY PROCUREMENT AND STRATEGY TEAMS WORLDWIDE

clients clients clients clients clients clients clients clients

Frequently Asked Questions

The Monthly/Quarterly/Yearly Price Trends service offered by us covers detailed historical information about prices, current price range (maximum, minimum, average), weekly/monthly price changes, forward-looking forecasts with rolling estimates, breakdown of prices by different FOB, CIF and Ex-Works levels, and analysis of factors driving prices such as raw material prices, energy prices, freight costs, supply-demand imbalances, and other significant developments in the markets. We cover various regions that include China, India, South Korea, Taiwan, USA, Mexico, Gulf Cooperation Council countries, and other areas.

Price trend analysis is very important because it helps businesses make smart choices about buying, setting prices, and investing. Companies can make the most of their buying cycles, save money, and avoid buying at peak prices by knowing how prices change over time. It also helps with budgeting and forecasting, which makes financial planning more accurate. Businesses can also figure out when the market is going to go up or down and plan ahead to deal with shortages or surpluses. Tracking price trends is important for industries that rely on raw materials, like manufacturing or FMCG, because it keeps them competitive and protects their margins in markets that are always changing.

There are many things that affect price trends, such as the balance of supply and demand, the availability of raw materials, production costs, and global trade conditions. Inflation, currency exchange rates, and interest rates are also important macroeconomic indicators. Prices can change a lot because of things like tariffs, government policies, geopolitical events, and environmental factors like bad weather. Fluctuations are also caused by industry-specific factors like new technologies, changes in consumer demand, and seasonal patterns. A full price trend analysis looks at all of these things to give you useful and correct information.

Price trends enable businesses to optimize procurement strategies by identifying the best time to purchase raw materials or products. By analyzing historical data, companies can anticipate price peaks and troughs, allowing them to buy at lower costs. This reduces procurement expenses and improves profit margins. Additionally, trend analysis helps in negotiating better supplier contracts and planning inventory levels efficiently. It also minimizes risks associated with price volatility and ensures a stable supply chain.

Price trend analysis is done by using primary research, secondary data collection, and advanced analytical models. Data is collected from industry participants, suppliers, distributors, and validated databases. Analysts then use statistical tools, demand-supply modeling, and economic indicators to figure out what the price patterns mean. They also think about things like the cost of raw materials, shipping, political events, and seasonal demand. This multi-layered method makes sure that the information is correct, dependable, and useful for businesses that want to know about both current prices and future trends.

Yes, IMARC provides customize price trend reports for certain areas or countries based on the needs of your business. Reports can be tailored to give you information about one country, several regions, or the whole world. Regional reports include pricing data for specific areas, how the market works, trade flows, and rules that affect prices. This helps companies that do business in more than one market make decisions that are right for each area, improve their supply chains, and better manage pricing risks across different areas.

Our reports provide detailed analysis of price trends, supply-demand situation, and trade patterns in major manufacturing centers and consuming areas. These include China, Taiwan, South Korea, India (Far East/South Asia), GCC nations, Non-GCC West Asia, Africa, Southeast Asia, Central Asia, North America, Europe, Latin America, and other countries. You will get an opportunity to compare prices (FOB basis) from different manufacturing centers in each region and learn about regional differences in price trends and supply-demand situations.

Every report includes a dedicated qualitative and quantitative analysis of key price drivers and restraints. It takes into account the cost of raw materials, changes in the cost of energy, transportation costs, changes in demand from various downstream industries, disruptions in supply, expansion in capacities, and macroeconomic conditions. It also highlight market news, supplier announcements, and events that impact pricing. This helps clients anticipate changes and make proactive decisions.

Yes, our reports are highly customizable to suit specific commodities and geographic regions based on your business needs. Clients can choose particular products, define preferred pricing benchmarks such as FOB, CIF, farmgate, wholesale, or retail, and select relevant regions or countries. Additionally, the reporting frequency can be adjusted to monthly, quarterly, or yearly formats. Beyond standard pricing data, we offer the flexibility to include advanced insights such as competitive landscape analysis, detailed trade flow mapping, and in-depth demand-supply gap assessments. This ensures that the final report delivers precise, actionable intelligence aligned with your strategic, procurement, and investment decision-making requirements.

Pricing data is updated based on the selected report frequency—monthly, quarterly, or yearly. Monthly reports provide the most frequent updates, capturing short-term price fluctuations and immediate market changes. Quarterly updates offer a broader view of seasonal trends and macroeconomic influences, while yearly reports consolidate long-term price movements and forecasts. Regular updates ensure that businesses always have access to the most recent market intelligence, helping them respond quickly to changing conditions and maintain a competitive edge in procurement and pricing strategies.