Chromium Price Increases 4.5% in Brazil, 2.9% in Japan — Q4 2025 Update
13-Aug-2025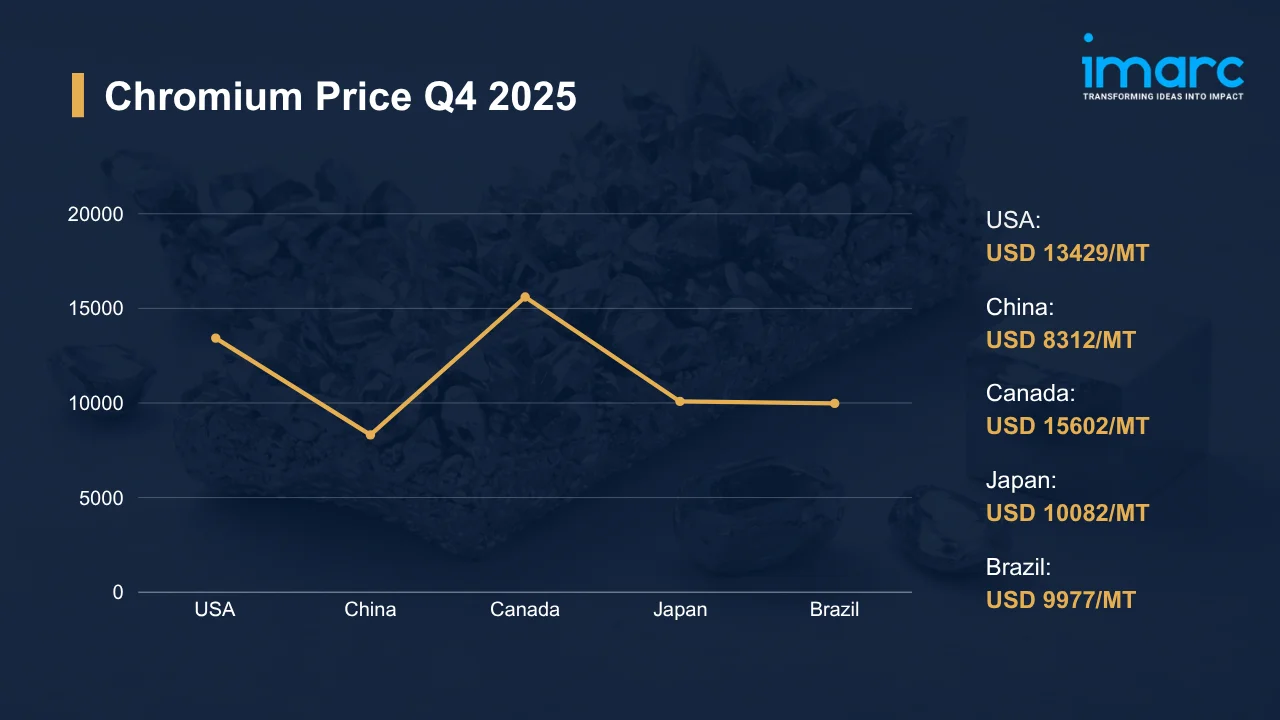
Summary:
All five tracked chromium markets posted quarter-on-quarter gains through the final months of 2025, lifted by firm stainless steel procurement and tightening feedstock supply. Constrained import availability and rising logistics costs drove chromium prices across tracked markets, which advanced between 2.0% and 4.5% QoQ. Supply discipline across producing hubs held firm throughout the period. The ongoing Israel–Iran–USA conflict has added a further layer of cost pressure. According to Al Jazeera, as of March 8, 2026, global oil prices surged more than 25% since hostilities erupted, directly lifting energy costs for chromium smelters and alloy processors worldwide.
Chromium Price Q4 2025:
Regional prices (USD per MT) and QoQ changes Q4 vs Q3 2025:
| Region | Price (USD/MT) | QoQ Change | Direction |
|---|---|---|---|
| USA | 13429 | +2.1% | ↑ Growth |
| China | 8312 | +2.0% | ↑ Growth |
| Canada | 15602 | +2.1% | ↑ Growth |
| Japan | 10082 | +2.9% | ↑ Growth |
| Brazil | 9977 | +4.5% | ↑ Growth |
To access real-time prices Request Sample
Kindly note: IMARC’s pricing database tracks chromium price movements across major global markets.
What Moved Prices:
USA:
- During Q4 2025, at USD 13429/MT, the USA chromium prices reached their highest level of the year. Stainless steel producers and aerospace manufacturers held procurement schedules firm through the quarter, preventing any softening even as spot volume remained thin. Constrained availability of high-grade imported units proved the decisive factor: with import flows from South African and Kazakh suppliers stretched by freight delays, domestic spot market liquidity tightened quickly, keeping sellers firmly in control of offer terms. The chromium price chart showed a clear, consistent upward line from October through December.
- Traders responded to export opportunity, diverting available spot tonnage away from the domestic market and reinforcing the tightness that buyers were already experiencing. Inland logistics costs added to the pressure. Aerospace and automotive converter activity drove consistent material absorption without triggering restocking cycles, a procurement pattern that kept buyers exposed to any incremental supply shortfall rather than protected against one.
China:
- In Q4 2025, chromium prices in China climbed to USD 8312/MT, their second consecutive quarterly gain. Stricter environmental compliance inspections limited output growth at chromite mining and processing operations through the quarter, cutting domestic replenishment rates just as stainless steel mills were restocking aggressively to support improving construction and infrastructure sector throughput. Inventory tightened faster than buyers anticipated.
- Export inquiries from regional buyers across Southeast Asia added upward pull to Chinese supplier offers. Producers who might otherwise have held spot prices flat chose to test higher levels as order flow from overseas improved their negotiating position. CNY exchange rate dynamics remained broadly stable, removing a potential offset to rising prices and allowing the supply-side tightness to pass through to transaction values without currency-related dilution.
Canada:
- In the fourth quarter of 2025, chromium prices in Canada settled at USD 15602/MT, reflecting some of the tightest procurement conditions seen across the five tracked markets. Heavy machinery manufacturers and alloy steel producers maintained steady consumption, and with domestic production capacity covering only a fraction of requirements, the market remained structurally dependent on imports. Those import shipments arrived weeks behind schedule. Logistical delays at receiving ports and higher CIF freight charges from origin suppliers fed directly into offer prices, and distributors holding controlled inventories had little incentive to discount.
- Buyer negotiating power was minimal throughout the quarter. Supply chain constraints at distribution hubs left little buffer for procurement teams working against project schedules. Those delays kept market fundamentals tight through December, supporting prices at levels sellers had tested tentatively in Q3 and could then hold with confidence.
Japan:
- During Q4 2025, chromium prices in Japan reached USD 10082/MT, driven primarily by import scheduling disruptions that reduced spot availability across high-purity and specialty-grade material. Automotive manufacturers and electronics producers, the two anchor segments of Japanese chromium demand, maintained steady procurement schedules through the quarter. Import scheduling delays cut into spot volumes more severely than seasonal patterns would suggest, amplifying the upward price impulse beyond what underlying demand alone could explain.
- Finished steel export performance held up well for Japanese producers, sustaining downstream chromium requirements at levels consistent with full-capacity operating schedules. Limited domestic chromium processing capacity kept Japan structurally reliant on offshore supply, meaning that any disruption to arrival timing translated immediately into spot tightness and offer price increases rather than being absorbed by local production flexibility.
Brazil:
- In Q4 2025, at USD 9977/MT, Brazil recorded the strongest QoQ gain across all five tracked markets, up 4.5%. Infrastructure project activity accelerated through the quarter, lifting stainless steel consumption and pulling chromium procurement volumes higher than Q3 buying patterns had implied. Domestic mining operations ran into periodic logistical interruptions, restricting raw material movement and reducing the volume reaching fabricators on schedule.
- Export opportunities to regional trade partners redirected a portion of domestic production away from the local market, compounding the supply side tightness that infrastructure demand was already creating. Port handling costs and inland transportation expenses both climbed through the period, adding a cost-push layer to what had begun as a demand-driven price move. Buyers had little room to push back.
Chromium Price Outlook After the Israel–Iran–USA Conflict:
Rising Energy Costs and Chromium Smelting Pressures: Chromium smelters and ferrochrome producers are direct casualties of an energy price shock of this scale. As of March 13, 2026, Brent crude prices reached USD 101.12 per barrel after the Strait of Hormuz was closed, lifting thermal electricity and industrial fuel costs for processing facilities across South Africa, Kazakhstan, and China. Higher smelting costs will either compress producer margins or pass through to buyers as offer price increases.
Regional Demand Uncertainty and Chromium Price Volatility: Prolonged geopolitical disruption reshapes buyer behavior well before physical supply is affected. The chromium price trend into 2026 might reflect that uncertainty: procurement teams at stainless steel mills across Japan, Canada, and Brazil are already reassessing contract schedules against a backdrop of unpredictable energy cost trajectories. Where industrial output contracts in response to elevated input costs, chromium demand growth stalls, yet constrained supply might keep prices elevated regardless.
Immediate Market Reaction:
The chromium market responds to conflict-driven energy disruption primarily through the feedstock and logistics channels rather than through direct production exposure. South African and Kazakh producers, the dominant sources of global chromite ore, rely on fuel-intensive open-cut mining and ore processing operations. As diesel and electricity costs climb, production cost floors rise, compressing the downside on offer prices even where demand softens. Import-dependent markets, Japan and Canada in particular, face elevated CIF costs as vessel rerouting and war risk insurance surcharges inflate landed prices beyond what forward contracts had assumed. The chromium price index reflects these compounding pressures, with energy cost volatility and freight escalation feeding simultaneously into both supply economics and landed purchase costs.
Impact on Chromium Prices:
The conflict might trigger several key changes in the chromium market:
- Energy Cost Pass-Through at the Smelter Level: Ferrochrome production in South Africa and Kazakhstan depends on sustained, affordable power supply for arc furnace operations. Oil price escalation raises both diesel costs at mine sites and electricity tariffs where power generation relies on thermal fuel inputs. Producers facing a significant surge in operating costs will push higher offer prices to restore margin, and stainless steel mills absorbing those increases will reassess their chromium procurement volumes and timing accordingly.
- War Risk Surcharges on Import Freight Routes: Shipping companies serving chromium ore and ferrochrome trade lanes out of the Middle East and Indian Ocean corridors are applying high war risk surcharges on affected routes. For Canada and Japan, where virtually all chromium requirements move by sea, these surcharges translate directly into higher landed costs that buyers cannot simply absorb through hedging or contract rebasing on short notice.
- Demand Reorientation in Steel-Consuming Sectors: Elevated energy costs crimp industrial output margins across construction and heavy manufacturing, the primary stainless steel end-use sectors. Procurement teams at mills will trim forward buying if order books soften. Conversely, defense spending acceleration across multiple economies will increase demand for specialty alloys and high-performance steel grades that use chromium intensively, creating a partial offset that might keep the demand floor higher than energy cost pressure alone would imply.
Taken together, these three pressures will keep chromium markets volatile through 2026. Margin compression at the smelter level, rising landed costs in import-dependent markets, and uncertain demand trajectories across end-use sectors will make forward pricing difficult. Procurement teams that rely on static contract structures might face the sharpest exposure when any of these channels escalates further.
Supply Chain Disruptions:
Iran’s southern ports, from which chrome ore and ferrochrome shipments normally depart towards China and Asia Pacific markets, sit directly in the conflict zone. Most Iranian chromium ore and ferrochrome exports are typically loaded at coastal terminals near the Strait of Hormuz, placing those volumes at immediate logistical risk. As of March 2026, shipping traffic through the Strait fell at least 80%, and with major carriers suspending Gulf bookings, import-dependent chromium markets face acute supply lead-time extension and elevated CIF costs that current procurement plans did not assume.
Alternative routing via the Cape of Good Hope adds 10 to 14 days to vessel transit times and meaningfully raises bunker and charter costs on South African ore shipments. Producers in South Africa and Kazakhstan are evaluating those routing options now, though the cost premium might force smaller exporters to defer spot offers rather than ship at a loss. Oman’s ferrochrome capacity faces separate logistical exposure as regional port operations remain disrupted. Buyers counting on Omani volumes will need to source from further afield and accept longer lead times until routing normalizes.
Global Market Overview:
Globally, the chromium market reached a volume of 42,208.0 Thousand Tons in 2025. Market projections indicate steady growth, with the market expected to reach 47,879.6 Thousand Tons by 2034, at a compound annual growth rate (CAGR) of 1.41% during 2026–2034. Stainless steel production expansion, growing specialty alloy requirements in aerospace and defense, and rising demand for corrosion-resistant coatings in industrial manufacturing collectively drive long-term consumption. Stricter environmental standards, advances in alloy processing technology, and infrastructure investment in emerging markets broaden the global chromium demand base.
Recent Highlights & Strategic Developments:
Recent strategic moves within the industry further illustrate evolving dynamics:
- In October 2025, a systematic review of randomized controlled trial data found that chromium supplementation offered meaningful metabolic benefits for women with polycystic ovary syndrome, covering insulin sensitivity, lipid profiles, inflammatory markers, and ovulation regularity. The analysis found chromium picolinate performance comparable to metformin for insulin resistance reduction, with a potentially lower side-effect burden, broadening the market interest in pharmaceutical-grade chromium compounds.
Chromium Price Forecast (2026):
Near-term chromium prices will reflect the interplay between energy cost pass-through from conflict-driven oil price escalation and downstream demand signals out of stainless steel and specialty alloy production. Procurement caution might persist through the first half of 2026 as buyers await clearer visibility on logistics costs and supply route stability. Any resolution of the Hormuz disruption might restore contract offer levels quickly.
Should hostilities intensify, chromium prices will face compounding upward pressure through rising smelter energy costs, extended maritime lead times, and war risk surcharges that buyers in Japan and Canada cannot absorb indefinitely. Supply from Iranian chromium ore export terminals might contract further, tightening global spot availability. Conversely, a diplomatic resolution might ease freight premiums and restore import flow normalcy in both import-dependent markets, with prices trending toward pre-conflict levels and setting a more stable foundation for the chromium price forecast through the year ahead.
Strategic Takeaways:
Looking ahead, the chromium market is expected to sustain measured volume growth through 2034, supported by stainless steel production expansion, increasing specialty alloy demand in aerospace and defense, and broader industrial use in surface treatment applications. Geopolitical volatility, energy cost escalation, and freight disruption will require stakeholders to adopt increasingly adaptive procurement and risk management frameworks.
To navigate this complex landscape, stakeholders should:
- Track Regional Price Differentials: Monitor quarterly chromium pricing across key producing and consuming markets to identify optimal procurement windows. Comparing chromium price per MT against regional contract rates and landed CIF costs will reveal cost-saving sourcing opportunities and flag when spot offers are diverging from trend.
- Diversify Supply Chain Routes: Evaluate alternative sourcing geographies and shipping corridors to reduce dependence on conflict-exposed trade lanes. Secondary supplier agreements and contingency freight arrangements will provide critical resilience and maintain supply continuity if primary routes face prolonged disruption.
- Adjust Procurement Strategy for Conflict Conditions: Adopt flexible contract structures with price reopener clauses and force majeure provisions to protect against geopolitical price spikes. Precautionary inventory buffers covering four to six weeks of consumption might meaningfully reduce exposure if supply tightens abruptly during further escalation.
- Monitor Upstream Energy and Smelting Costs: Track electricity tariff and diesel fuel cost movements in South Africa and Kazakhstan, the dominant ferrochrome production hubs. Rising smelting economics signal forward price increases and provide procurement teams with a lead indicator for offer escalation before it reaches spot markets.
- Evaluate Regulatory and ESG Developments: Track evolving chromium handling regulations, emissions compliance requirements, and sustainability disclosure mandates across major producing regions. Tightening regulatory frameworks might constrain smelter capacity, raise compliance costs, and alter the competitive dynamics between low-cost and higher-standard suppliers globally.
Subscription Plans & Customization:
IMARC offers flexible subscription models to suit varying needs:
- Monthly Updates — 12 deliverables/year
- Quarterly Updates — 4 deliverables/year
- Biannual Updates — 2 deliverables/year
Each includes detailed datasets (Excel + PDF) and post-report analyst support.
Get in Touch With Us
UNITED STATES
Phone: +1-201-971-6302
INDIA
Phone: +91-120-433-0800
UNITED KINGDOM
Phone: +44-753-714-6104
Email: [email protected]
Client Testimonials


.webp)


