Latest Sodium Gluconate Prices Reveal Regional Trends and Real-Time Market Intelligence
04-Aug-2026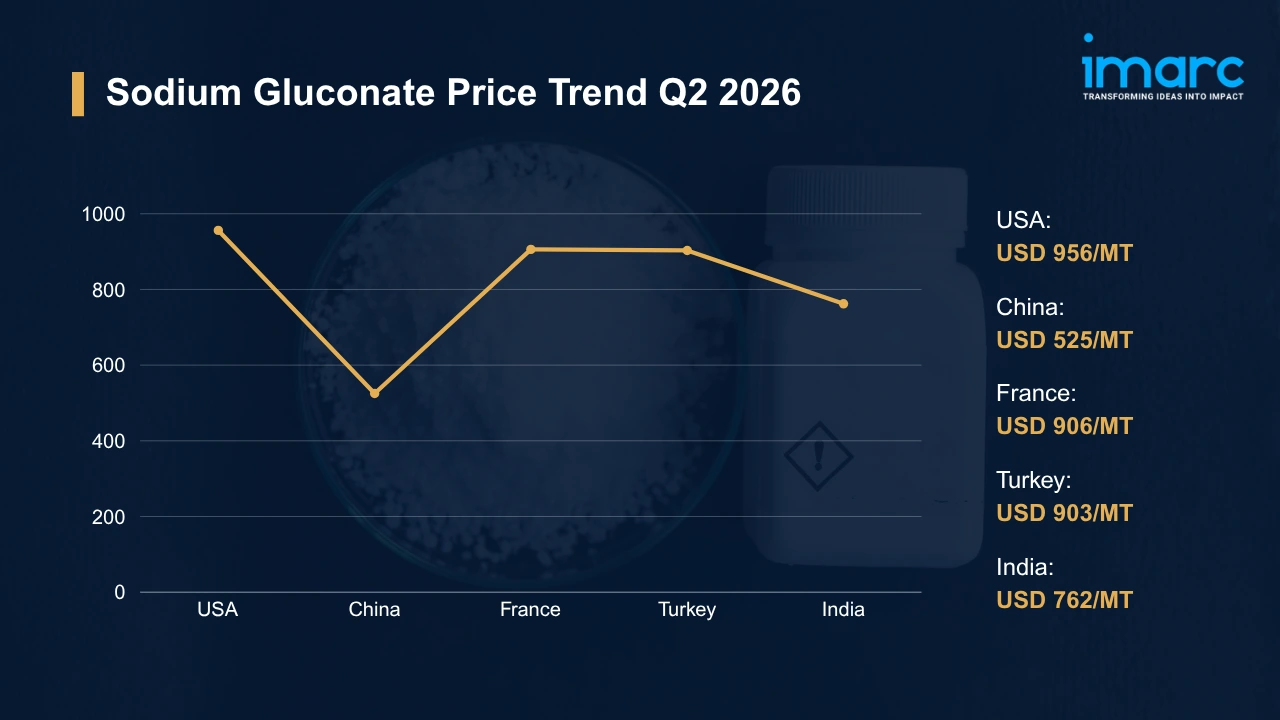
Produced through the fermentation of glucose, sodium gluconate forms a white crystalline powder that dissolves readily in water. The compound chelates calcium and iron strongly. Across concrete admixtures, industrial cleaning formulations, water treatment, textile processing, and metal surface preparation, demand stays broad, and sodium gluconate prices track glucose feedstock economics alongside fermentation energy loads, freight rates, and construction demand cycles.
Global Market Overview:
Globally, the sodium gluconate industry was valued at USD 671.1 Million in 2025. Market projections indicate steady growth, with the industry expected to reach USD 902.0 Million by 2034, with a compound annual growth rate (CAGR) of 3.34% during 2026-2034. Across the chemicals sector, regulatory momentum favors biodegradable chelating agents over phosphonates. That shift, alongside infrastructure spending in emerging economies, sustains the sodium gluconate price trend across admixture and cleaning segments.
Sodium Gluconate Price Trend Q2 2026:
Regional prices (USD per MT) and QoQ changes Q2 2026 vs Q1 2026:
| Region | Price (USD/MT) | QoQ Change | Direction |
|---|---|---|---|
| USA | 956 | +1.09% | ↑ |
| China | 525 | +2.22% | ↑ |
| France | 906 | +2.56% | ↑ |
| Turkey | 903 | +3.11% | ↑ |
| India | 762 | +3.34% | ↑ |
To access real-time prices Request Sample
What Moved Prices:
USA:
- In Q2 2026, sodium gluconate prices in the USA climbed to USD 956/MT, a 1.09% QoQ gain, as concrete admixture formulators and industrial cleaning manufacturers lifted order volumes ahead of the summer paving season. Producers held operating rates deliberately disciplined. Across Gulf Coast distribution hubs, inventories offered little cushion against incremental spot enquiries.
- Priced at wider spreads than in the prior quarter, Chinese-origin offers drew limited buying interest from domestic formulators seeking security of supply and shorter lead times. Inland freight surcharges added to delivered costs. Through June, the sodium gluconate price chart tracked a steady upward slope, reinforced by glucose feedstock economics.
China:
- During Q2 2026, sodium gluconate prices in China advanced to USD 525/MT, a 2.22% QoQ increase, as export enquiries from Southeast Asia and the Middle East absorbed available tonnage. Domestic construction chemical demand recovered modestly through the period. At coastal fermentation plants, spot availability narrowed.
- Corn-based glucose costs across northern provinces stayed firm through the quarter, limiting how far coastal producers were willing to discount in pursuit of incremental export volume. Meanwhile, renminbi movements against the dollar shaped export netbacks. Filling quickly on outbound Asia lanes, container slots pushed sellers toward contracted shipments.
France:
- In Q2 2026, sodium gluconate prices in France rose to USD 906/MT, up 2.56% QoQ, as ready-mix concrete producers and municipal water treatment operators sustained steady offtake. Import arrivals stayed measured throughout the quarter. Facing higher replacement costs, distributors adjusted contract renewals upward.
- Elevated industrial power tariffs across the eurozone kept blending and packaging costs from easing, even where raw material inflows were comfortable and lead times predictable. Buyers accepted modest increases rather than delay projects. Across the north, seasonal roadworks scheduling concentrated admixture draw into April and May.
Turkey:
- During Q2 2026, sodium gluconate prices in Turkey reached USD 903/MT, a 3.11% QoQ gain, driven by detergent formulators and construction additive blenders competing for a largely imported supply base. Local production covers only part of consumption. With lira depreciation persisting, landed costs on dollar-denominated cargoes rose.
- Port handling charges at Mersin and Izmir moved higher during the quarter, and importers built forward cover ahead of anticipated summer infrastructure tenders across the southern provinces. Through May, distributors across the interior reported firmer resale quotations. Restocking ahead of the tender cycle tightened prompt availability.
India:
- In Q2 2026, sodium gluconate prices in India advanced to USD 762/MT, a 3.34% QoQ rise, as construction chemical blenders and textile processing units in Gujarat lifted procurement. Pre-monsoon project activity concentrated demand into the quarter. Meanwhile, domestic fermentation output held steady without meaningful expansion.
- Corn starch costs at Indian glucose plants edged higher, and producers passed part of that increase into quotations rather than compress already thin processing margins any further. Meanwhile, export enquiries from Gulf buyers stayed active. At Mundra, port congestion lengthened dispatch cycles modestly.
Drivers Influencing the Market:
Several factors continue to shape sodium gluconate pricing and market behavior:
- Construction and Concrete Admixture Demand: Concrete admixture consumption anchors baseline demand, since the compound functions as a set retarder and water reducer in ready-mix formulations that require controlled setting times on site. According to the US Census Bureau, public highway and street construction ran at USD 150.6 Billion in seasonally adjusted annual terms during May 2026. Pipelines of that scale translate into predictable admixture offtake.
- Upstream Glucose and Corn Feedstock Costs: Glucose derived from corn starch forms the primary fermentation substrate, so grain market movements feed into production economics. Fermentation yield determines how much substrate each ton requires. Across producing regions, tighter crop supply shapes the sodium gluconate price index.
- Energy Expenditure in Fermentation and Drying: Fermentation, filtration, and spray drying consume substantial thermal and electrical energy across the production cycle. Because utility tariffs vary widely, low-cost Chinese and Indian producers separate from European plants carrying higher power bills, and that gap shows up plainly in regional price spreads. Meanwhile, efficiency retrofits offer only partial relief.
- Ocean Freight and Logistics Economics: Freight rates on Asia to Europe and Asia to North America corridors determine how competitively Chinese material lands in Western markets, where domestic capacity remains limited. Adding to that, bunker surcharges and port dwell times compound the effect. When structuring quarterly contracts, buyers weigh those variables against domestic supplier quotations.
- Environmental and Regulatory Compliance: Under chemical safety frameworks, registration obligations impose testing and documentation costs on producers selling into regulated markets. Wastewater discharge limits at fermentation facilities require treatment investment that smaller operators struggle to fund, and enforcement intensity varies considerably across the European Union and Asia. In time, compliance spending reaches the buyer.
- Trade Policy and Currency Dynamics: Antidumping investigations, tariff schedules, and import licensing rules redirect trade flows between producing and consuming regions. Compounding that, currency volatility complicates matters, since importers in Turkey and India settle in dollars while selling into local currencies whose depreciation steadily erodes resale margin. Across the region, hedging coverage remains uneven.
Recent Highlights & Strategic Developments:
Recent strategic moves within the industry further illustrate evolving dynamics:
- In May 2025, researchers reported a route to improved fluidity control in alkali-activated slag by pairing polycarboxylate ether with sodium gluconate. The work showed that the additive slows early hydration and alters dispersion behavior, preserving workability across a longer window.
Outlook & Strategic Takeaways:
Looking ahead, the sodium gluconate market is expected to expand steadily through 2034, carried by infrastructure spending, biodegradable chelant substitution, and widening water treatment applications across emerging economies. Corn-derived glucose cost trajectories will remain the decisive variable behind the sodium gluconate price forecast.
To navigate this complex landscape, stakeholders should:
- Monitor Regional Price Differentials: Track quarterly spreads between Chinese, European, and Indian supply points to locate favorable procurement windows. Benchmark landed costs against prevailing contract rates before committing to annual volume.
- Assess Freight Market Developments: Monitor container rates on Asia to Europe and Asia to North America corridors. Build rate adjustment clauses into logistics agreements so delivered costs stay predictable across the contract period.
- Evaluate Downstream Demand Indicators: Track construction permit issuance and ready-mix output across principal consumption markets. Align inventory positioning with observed order book momentum rather than with historical seasonal averages alone.
- Review Regulatory Compliance Expenditures: Audit registration, wastewater treatment, and documentation costs across each operating jurisdiction. Weigh sodium gluconate price per MT against those recurring outlays when evaluating supplier switching decisions.
- Strengthen Currency Exposure Management: Implement forward cover for procurement settled in dollars against depreciating local currencies. Coordinate treasury and sourcing calendars so hedge tenors match anticipated import payment timelines through the year.
- Explore Emerging Application Segments: Investigate demand potential in personal care, pharmaceutical excipients, and specialty metal cleaning. Engage formulation partners early to test commercial viability before competitors establish supply relationships.
Subscription Plans & Customization:
IMARC offers flexible subscription models to suit varying needs:
- Monthly Updates: 12 deliverables/year
- Quarterly Updates: 4 deliverables/year
- Biannual Updates: 2 deliverables/year
Each includes detailed datasets (Excel + PDF) and post-report analyst support.
Get in Touch With Us
UNITED STATES
Phone: +1-201-971-6302
INDIA
Phone: +91-120-433-0800
UNITED KINGDOM
Phone: +44-753-714-6104
Email: [email protected]
Client Testimonials




.webp)




.webp)












