
Next Generation Sequencing Market Size, Share, Trends and Forecast by Sequencing Type, Product Type, Technology, Application, End-User, and Region, 2026-2034
Next Generation Sequencing Market Size and Share:
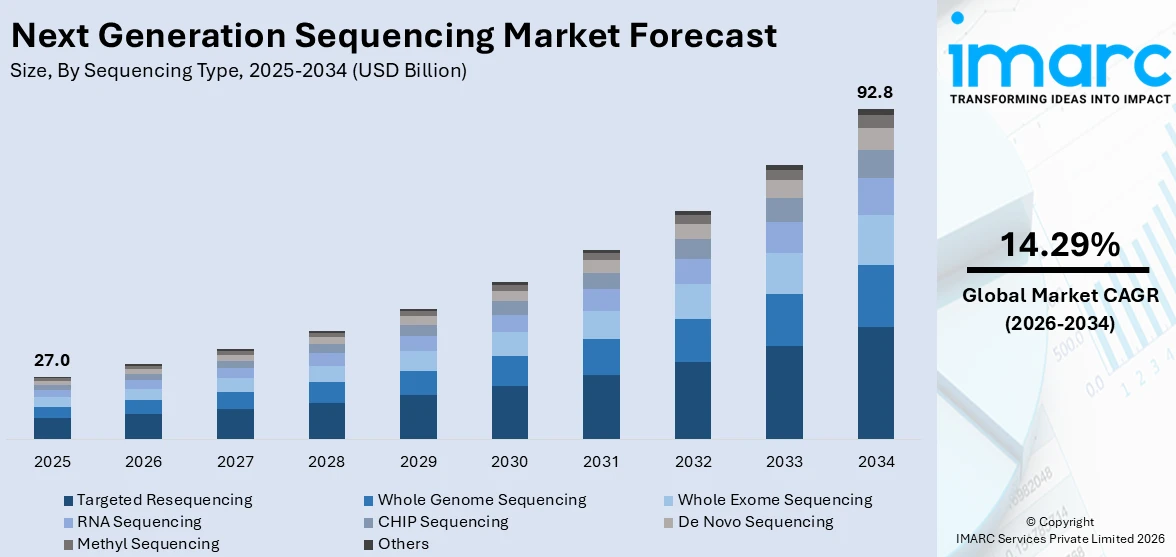
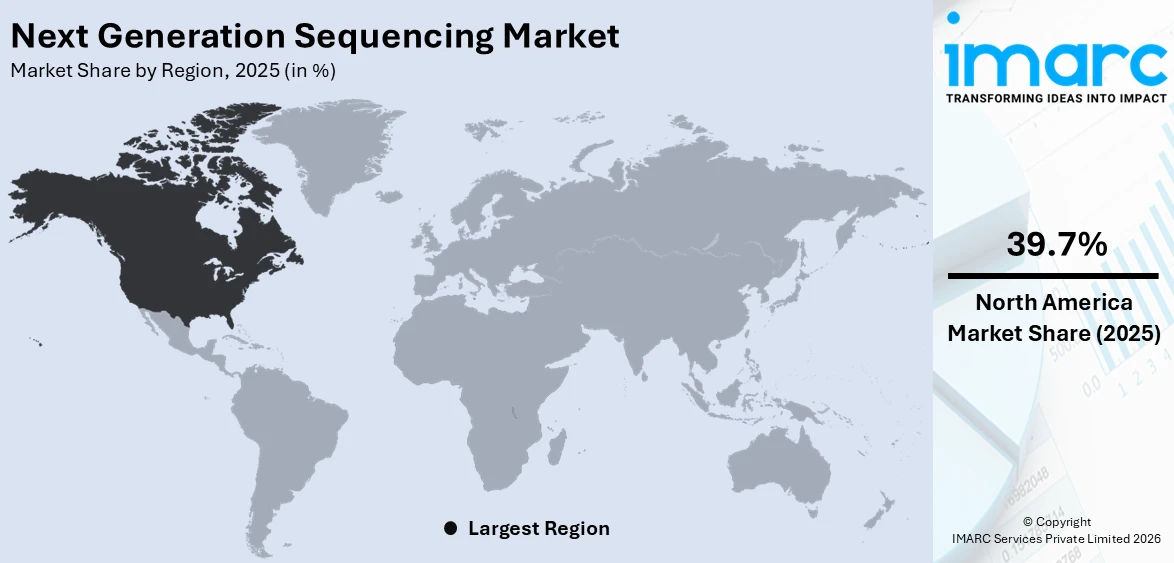
The global next generation sequencing market size was valued at USD 27.0 Billion in 2025. Looking forward, IMARC Group estimates the market to reach USD 92.8 Billion by 2034, exhibiting a CAGR of 14.29% from 2026-2034. North America currently dominates the market, holding a market share of over 39.7% in 2025. The market for NGS is expanding rapidly due to ongoing technological advancements, increasing use in clinical applications, escalating demand for bioinformatics tools and data analysis solutions, a rising focus on precision medicine, as well as enhanced research and development efforts.
|
Report Attribute
|
Key Statistics
|
|---|---|
|
Base Year
|
2025
|
|
Forecast Years
|
2026-2034
|
|
Historical Years
|
2020-2025
|
|
Market Size in 2025
|
USD 27.0 Billion |
|
Market Forecast in 2034
|
USD 92.8 Billion |
| Market Growth Rate (2026-2034) | 14.29% |
The next generation sequencing market is growing vigorously on the grounds of advancement in genomic technology and rising personalized medicine demand. Its higher throughput along with cost-effective sequencing has totally changed the application for diagnosis, drug discovery, and precision agriculture. Increased spending in genomics and governmental support towards research initiatives is also expected to add fuel to adoption in academic and clinical space. Along with this, innovations like long-read sequencing and advancements in data analysis tools to augment both accuracy and efficacy of NGS. Moreover, the trend of application towards noninvasive prenatal testing and cancer diagnosis through NGS will further define its growing role in bringing health solutions to new frontiers.
To get more information on this market Request Sample
The NGS market in the United States is seeing a significant increase, primarily as a function of extensive government support and a focus on precision medicine. An advanced healthcare infrastructure, combined with the use of genomic technologies in research and clinical practice, is further enhancing the market’ presence in the country. In addition, the adoption of next-generation sequencing (NGS) applications in cancer management, increasingly in the areas of tumor profiling and liquid biopsy, is spurring demand for their significant impact on patient outcome improvement. For instance, in September 2024, NeoGenomics, a U.S. based oncology testing service company, unveiled three studies at ESMO Congress 2024 in Barcelona, focusing on the role of ctDNA analysis and NGS in improving early cancer detection and personalized treatment approaches. Furthermore, the U.S. market is benefiting from favorable regulatory policies that support the adoption of NGS-based diagnostic solutions.
Next Generation Sequencing Market Trends:
Increasing Adoption of NGS in Clinical Applications
The utilization of next generation sequencing (NGS) in clinical applications is fast increasing, altering many aspects of healthcare. From diagnoses to personalized treatment strategies, NGS is revolutionizing clinical practice by providing unprecedented insights into disease genetics. Industry data reveals that 75% of U.S. consumers are eager for healthcare experiences that cater more to their individual needs. In diagnostic testing, NGS offers rapid and complete analysis of genomic variations, enabling the exact diagnosis of rare genetic disorders, cancer mutations, and infectious pathogens. Its function includes prenatal screening, pharmacogenomics, and uncommon illness diagnosis, giving clinicians critical genetic information for personalized patient management. For instance, OmniSeq and LabCorp, the U.S.-based life science company, introduced OmniSeq INSIGHTsm, a next-generation sequencing test designed to advance precision oncology. Additionally, NGS-based genomic profiling is propelling precision medicine initiatives, guiding targeted therapy selection, and hastening the identification of novel medications in clinical trials. As NGS technology improves and becomes more affordable, its integration into clinical workflows. For instance, the U.S.-based company Agilent Technologies Inc. introduced Agilent Sure Select Cancer CGP Assay, based on NGS, for advancing precision oncology. Thus, the increasing focus of industry participants on NGS for precision oncology is expected to boost the next generation sequencing market demand.
Technological Advancements in NGS Technology
Advances in the technology of NGS have moved the field forward, changing the nature of genomic research and its applications across several sectors. In 2023, the size of the genomics market stood at USD 33.9 Billion. Such developments include upgrading of sequencing platforms, chemistry, and ways of data processing. Enhanced sequencing platforms have increased throughput, enabling the capture of larger volumes of sequencing data in less time and at a lower cost. This is positively influencing the next generation sequencing market statistics. Additionally, advancements in sequencing chemistry have made it possible to increase the accuracy of sequencing and the length of reads, thus enabling more complete coverage of the genome and improved detection of genomic variations. Furthermore, recent developments in data analytic techniques and computational methodology have simplified the processing, analysis, and interpretation of NGS data, allowing researchers to extract relevant insights from large genomic datasets more efficiently. Overall, technical advancements in NGS continue to propel the industry forward and increase its applications. For instance, Ultima Genomics and Nvidia partnered to leverage artificial intelligence (AI) across multiple DNA sequencing and analysis stages. Moreover, Ultima's instrument utilizes the Nvidia Clara AI computing platform along with Nvidia A30 GPUs to provide highly accurate secondary and primary analysis to those customers who need to run genomic analyses at scale. Thus, adopting AI and cloud computing is expected to bring novel products and services across the industry.
Growing Demand for Bioinformatics Tools and Data Analysis Solutions
NGS data is maximized with the help of bioinformatics tools and data analysis solutions. The large volumes of genomic data produced by NGS technology are processed, analyzed, and understood with the help of computational resources. Bioinformatics tools cover a wide range of methodologies and software applications that are used in tasks such as read alignment, variant calling, de novo assembly, differential gene expression analysis, and pathway enrichment. The global bioinformatics market size reached USD 12.3 Billion in 2023. Furthermore, data analysis tools provide user-friendly interfaces and integrated procedures that make NGS data processing easier for researchers and clinicians who require advanced computer abilities. Bioinformatics tools and data processing solutions must be constantly created and updated to optimize the insights gained from NGS studies and advance our understanding of genomics, transcriptomics, and epigenomics. For instance, My Intelligent Machines (MIMs) launched its software for drug development in oncology. In another instance, ARUP launched Rio, which is a bioinformatics analytics platform that helps generate faster results for next-generation sequencing tests.
Transformative Approach with Single-Cell Sequencing
Single-cell sequencing is a significant advancement in the area of next generation sequencing (NGS), giving new insights into cellular heterogeneity and functional genomics at the single-cell level. NGS methods, which extract and sequence individual cells, enable detailed investigations into gene expression, DNA mutations, epigenetic changes, and spatial transcriptomics, among other genomic characteristics. This precise understanding of cellular diversity and dynamics has far-reaching consequences in cancer research, immunology, developmental biology, and neurology. According to the NCI, the United States is home to 72 NCI-Designated Cancer Centers across 36 states and the District of Columbia. Single-cell sequencing within the NGS framework has enabled groundbreaking discoveries such as the identification of rare cell populations, the interpretation of cellular pathways throughout development, and a knowledge of the intricacy of the tumor microenvironment. As NGS improvements occur and single-cell sequencing technologies become increasingly widespread, the possibilities they're opening up for understanding the complexity of cellular biology are massive. For instance, Oxford Nanopore Technologies PLC announced a collaboration with 10x Genomics, aimed at streamlining the workflow to enable the sequencing of full-length transcripts in single reads on Oxford Nanopore devices. This collaboration will facilitate single-cell sequencing accessible to any laboratory, thereby increasing efficiency and cost reduction benefits.
Next Generation Sequencing Industry Segmentation:
IMARC Group provides an analysis of the key trends in each segment of the global next generation sequencing market, along with forecast at the global, regional, and country levels from 2026-2034. The market has been categorized based on sequencing type, product type, technology, application, and end-user.
Analysis by Sequencing Type:
- Whole Genome Sequencing
- Targeted Resequencing
- Whole Exome Sequencing
- RNA Sequencing
- CHIP Sequencing
- De Novo Sequencing
- Methyl Sequencing
- Others
Targeted resequencing leads the market with around 57.6% of market share in 2025. Targeted resequencing is a prominent part of the next generation sequencing (NGS) industry, driven by its use in diverse academic and therapeutic contexts. Targeted resequencing includes sequencing particular sections of interest within the genome, such as exons, regulatory regions, or disease-associated genes, allowing researchers to concentrate their sequencing efforts on important genomic regions. This technique has various advantages, including enhanced sequencing depth, lower sequencing costs, and more sensitivity for finding genetic variations. Targeted resequencing has also grown in favor of clinical diagnostics due to its capacity to rapidly and accurately assess clinically important genomic areas. Targeted resequencing assays are used by clinical laboratories and healthcare practitioners to diagnose diseases, predict prognoses, and choose treatments, especially in cancer and genetic testing. Another reason for the prominence of targeted resequencing is the presence of numerous companies in the NGS market offering specialized targeted resequencing services. These companies provide custom target enrichment solutions, library preparation kits, sequencing services, and data analysis pipelines tailored to researchers' specific needs. Their offerings encompass a wide range of applications, including cancer panel sequencing, inherited disease testing, pharmacogenomics, and microbial genomics. For instance, Illumina, Inc. has partnered with Nashville Biosciences to enhance drug development through genomics. This multi-year agreement utilizes a biobank of approximately 250,000 de-identified DNA samples from Vanderbilt University Medical Center. The collaboration aims to identify disease targets and improve therapy development, addressing the 90% failure rate in drug discovery.
Analysis by Product Type:
Access the comprehensive market breakdown Request Sample
- Instruments
- Reagents and Consumables
- Software and Services
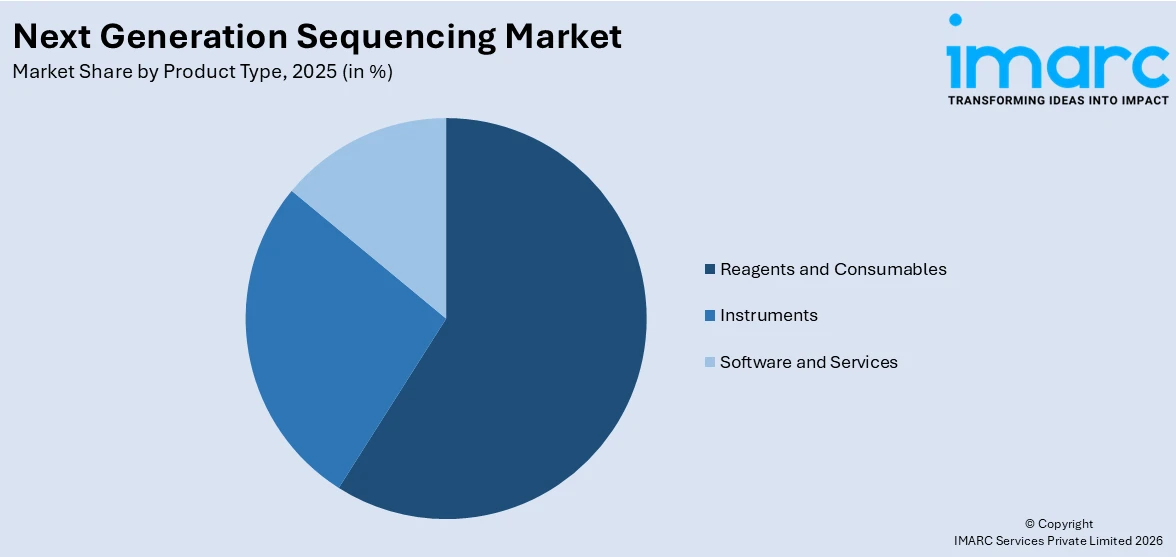
Reagents and consumables lead the market with around 59.7% of market share in 2025. Reagents and consumables are the most often used goods in next-generation sequencing (NGS) workflows, and they play an important role in all stages of the sequencing process, from sample preparation to data analytics. These tools help with several elements of NGS, such as sample collection, DNA or RNA extraction, library preparation, target enrichment, sequencing, and quality control. They make it easier to extract nucleic acids (DNA or RNA) from a variety of sources, including blood, tissues, cells, and environmental materials. Furthermore, most sample preparation kits include chemicals for cell lysis, protein digestion, nucleic acid extraction, and purification. For instance, Lexogen, a transcriptomics, and next-generation sequencing company, introduced the new CORALL RNA-Seq V2 whole transcriptome library prep kit. Whole transcriptome analysis with RNA sequencing (RNA-Seq), as one of the most sophisticated applications of NGS techniques, represents the determination of RNA molecules in a sample while collecting. Additionally, the strategic initiatives taken by the market players also augment the growth of the market. For instance, Merck acquired AmpTec to strengthen Merck's capabilities to develop and manufacture mRNA for its customers for use in vaccines, treatments, and diagnostics applicable to COVID-19 and many other diseases.
Analysis by Technology:
- Sequencing by Synthesis
- Ion Semiconductor Sequencing
- Single-Molecule Real-Time Sequencing
- Nanopore Sequencing
- Others
Sequencing by synthesis leads the market with around 75.7% of market share in 2025. Sequencing by synthesis has a wide range of applications owing to its high precision, scalability, and interoperability with multiple sequencing technologies. SBS is based on the sequential addition of fluorescently tagged nucleotides to a DNA template strand, followed by imaging to identify the integrated nucleotides. This technique has various advantages, which lead to its widespread use and rising popularity in NGS instrumentation. Furthermore, the SBS technique often provides excellent sequencing accuracy while minimizing error rates per base pair. The use of reversible terminators and error-correction algorithms reduces sequencing mistakes, resulting in trustworthy and precise sequencing findings. Furthermore, SBS is extremely scalable, enabling the sequencing of Millions to Billions of DNA fragments in a single run. This scalability makes SBS ideal for applications requiring high-throughput sequencing, such as whole-genome sequencing, transcriptomics, metagenomics, and population-scale studies. For instance, miR-451 has been identified as a potential prognostic factor in head and neck squamous cell carcinomas (HNSCCs) through miRNA profiling. The clusters of miR-375 and miR-106b-25 are implicated in the development and progression of HNSCCs. Furthermore, miRNAs have shown promise in forensic medicine due to their stability and specificity, making them useful for degraded samples or complex mixes.
Analysis by Application:
- Biomarker and Cancer
- Drug Discovery and Personalized Medicine
- Genetic Screening
- Diagnostics
- Agriculture and Animal Research
- Others
Biomarker and cancer lead the market with around 31.9% of market share in 2025. Biomarkers and cancer dominate the market due to the increased prevalence of cancer and growing public awareness of the advantages of early detection and individualized therapy. Biomarkers are molecular signs present in tissues, blood, or body fluids that can detect cancer, predict disease progression, and guide therapy decisions. NGS technologies provide complete genomic profiling and biomarker discovery, allowing for the detection of genetic mutations, gene expression patterns, and other molecular fingerprints linked to cancer genesis and progression. Furthermore, the expanding global frequency of cancer, as well as increased illness and death rates, have highlighted the necessity of early detection and tailored therapy in improving patient outcomes. NGS-based cancer diagnostics offer several advantages over traditional methods, including higher sensitivity, specificity, and the ability to detect multiple genetic alterations simultaneously. These advancements enable oncologists to tailor treatment strategies based on the unique genomic profiles of individual patients, leading to more effective therapies, reduced side effects, and improved survival rates. For instance, Vela Diagnostics released new next-generation sequencing (NGS)-based panels to detect RNA and DNA cancer biomarkers from formalin-fixed paraffin-embedded (FFPE) tissue specimens. The panels are focused (60 genes) and comprehensive (525 genes). The OncoKey SL 60 Plus Panel denotes a target-specific pan-cancer gene panel, while OncoKey SL 525 Plus Panel defines a complete panel for pan-cancer genes.
Analysis by End-User:
- Academic Institutes & Research Centers
- Hospitals & Clinics
- Pharmaceutical & Biotechnology Companies
- Others
Academic institutes and research centers lead the market with around 58.3% of market share in 2025. Academic institutes and research centers held the majority of the market due to the increased use of NGS technologies in research initiatives. Furthermore, academic institutions and research centers frequently get considerable financing from government agencies, private foundations, and business partners to support genomic research initiatives. This grant enables academics to invest in NGS technology and services for investigating a wide range of biological topics, from fundamental science to translational and clinical research. Furthermore, these universities usually feature well-equipped core facilities and research infrastructure devoted to genomics, molecular biology, and bioinformatics. These facilities are equipped with cutting-edge NGS instruments, laboratory equipment, and computing resources, enabling researchers to undertake cutting-edge genomic investigations and data analysis. Furthermore, the increasing collaboration among interdisciplinary research groups is enabling scientists from diverse backgrounds to collaborate on NGS-driven research projects, facilitating knowledge exchange, resource sharing, and interdisciplinary approaches to address complex scientific questions using NGS technologies. For instance, PacBio, in association with GeneDx, announced collaborative research with the University of Washington to investigate long-read whole-genome sequencing for greater diagnostic yield in neonatal care.
Regional Analysis:
To get more information on the regional analysis of this market Request Sample
- North America
- United States
- Canada
- Asia Pacific
- China
- Japan
- India
- South Korea
- Australia
- Indonesia
- Others
- Europe
- Germany
- France
- United Kingdom
- Italy
- Spain
- Russia
- Others
- Latin America
- Brazil
- Mexico
- Others
- Middle East and Africa
In 2025, North America accounted for the largest market share of over 39.7%. North America has a clear market lead due to the availability of a technologically sophisticated healthcare research framework in the area, as well as the broad implementation of NGS technology in several clinical laboratories. Furthermore, North America boasts a cutting-edge healthcare infrastructure, which includes prestigious academic institutions, research hospitals, and biotechnology corporations. These institutions have access to cutting-edge NGS equipment, bioinformatics tools, and research funding, allowing them to conduct groundbreaking genomic research and clinical applications. Furthermore, North America has a considerable number of clinical laboratories and genetic testing facilities that use NGS technology to provide diagnostic testing, screening, and genetic counseling services. These facilities provide a comprehensive range of NGS-based assays for hereditary illnesses, cancer diagnostics, prenatal screening, pharmacogenomics, and infectious diseases, which contribute to the wider use of NGS in clinical practice. However, breast cancer is more common among females, while male breast cancer is very rare. For instance, according to the data provided by Breastcancer.org, an estimated 287,850 new cases of invasive breast cancer are expected to be diagnosed in women in the United States, together with 51,400 new cases of non-invasive (in situ) breast cancer.
Key Regional Takeaways:
United States Next Generation Sequencing Market Analysis
In 2025, United States accounted for 92.80% of the market share in North America. The U.S. next-generation sequencing (NGS) market is significantly influenced by the rising incidence of cancer and genetic disorders, driving the demand for advanced diagnostic tools. According to the American Cancer Society, approximately 1,958,310 new invasive cancer cases are expected in the United States in 2023, equivalent to about 5,370 cases daily. This alarming prevalence underscores the critical need for precise and efficient diagnostic technologies like NGS, which are pivotal in identifying mutations and guiding personalized treatment plans. Government support for precision medicine, robust healthcare infrastructure, and substantial investments in genomic research further fuel market growth. Key players continue to innovate, offering cost-effective and high-throughput sequencing platforms, making NGS more accessible for clinical and research applications. The expanding use of NGS in non-invasive prenatal testing (NIPT), rare disease diagnosis, and infectious disease management contributes significantly to its adoption. Favorable regulatory policies, including FDA approvals for NGS-based tests, and the integration of AI for genomic data analysis enhance market prospects. Moreover, the growing trend of direct-to-consumer genetic testing, supported by increasing consumer awareness, adds momentum. The U.S. NGS market thrives on a convergence of technological advancements, public health needs, and a strong focus on precision healthcare solutions.
Europe Next Generation Sequencing Market Analysis
The next-generation sequencing (NGS) market in Europe is propelled by strong government funding for genomics research and the growing focus on precision medicine. The European Commission estimates that between 27 and 36 Million people in Europe are affected by rare diseases, highlighting the critical need for advanced diagnostic technologies like NGS. These tools enable early and accurate identification of genetic mutations, facilitating tailored treatment approaches for rare and complex conditions. Countries such as the UK, Germany, and France have launched national genome programs to integrate NGS into healthcare, particularly for oncology, rare diseases, and population health management. The European Union’s Horizon Europe program and other funding initiatives further support cutting-edge genomic research and technological innovation. Additionally, the increasing adoption of NGS in agriculture and microbiology underscores its expanding applications beyond healthcare. With its robust regulatory framework, the region ensures the safety and quality of NGS-based solutions, instilling trust among healthcare providers. Innovations in bioinformatics and AI-driven genomic analysis enhance accessibility and streamline workflows. Collaboration between academic institutions, biotech firms, and pharmaceutical companies, coupled with rising public awareness of genetic testing, positions Europe as a dynamic market for NGS adoption and growth.
Asia Pacific Next Generation Sequencing Market Analysis
The Asia-Pacific next-generation sequencing (NGS) market is driven by increasing healthcare investments and the growing prevalence of non-communicable diseases (NCDs). According to the WHO, 62% of all deaths in the South-East Asia Region are due to NCDs, accounting for approximately 9 Million people annually. This significant burden underscores the need for advanced diagnostic tools like NGS, which play a vital role in detecting genetic predispositions and enabling personalized treatment strategies. Governments across APAC, including China, India, and Japan, are actively supporting genomic initiatives to advance precision medicine and biotechnology. The rising adoption of NGS for non-invasive prenatal testing (NIPT) and infectious disease diagnosis, particularly following recent pandemics, further propels market growth. Additionally, the region benefits from cost-efficient manufacturing, rapid technological advancements by local players, and strategic collaborations with global leaders. Growing public awareness of genetic testing and increasing pharmaceutical R&D expenditure position APAC as a rapidly expanding market for NGS technologies.
Latin America Next Generation Sequencing Market Analysis
The Latin American next-generation sequencing (NGS) market is driven by increasing healthcare investments, rising awareness of genetic testing, and the growing burden of chronic diseases. In Brazil alone, approximately 928,000 deaths annually are attributed to chronic diseases, according to PubMed Central. This significant health challenge underscores the need for advanced diagnostic tools like NGS, which are essential for early detection and personalized treatment strategies. Countries such as Brazil and Mexico are adopting NGS for applications in oncology, rare disease diagnostics, and infectious disease management. Government efforts to modernize healthcare systems and foster research collaborations with international organizations further propel market growth. Additionally, the affordability and accessibility of sequencing technologies have improved, enabling broader adoption in clinical settings. The region is also leveraging NGS in agricultural genomics and biodiversity research, showcasing its potential beyond healthcare and addressing diverse challenges unique to Latin America.
Middle East and Africa Next Generation Sequencing Market Analysis
The Middle East next-generation sequencing (NGS) market is expanding due to rising healthcare investments and the growing burden of chronic diseases. In the UAE, 23% of individuals self-report chronic diseases, with obesity (12.5%), diabetes (4.2%), and asthma/allergies (3.2%) being the most prevalent, according to PubMed Central. These statistics underscore the need for advanced diagnostic tools like NGS to enable early detection and personalized treatment. Countries such as the UAE and Saudi Arabia are adopting NGS for oncology, rare disease diagnostics, and infectious disease management. Government-led genomic initiatives and collaborations with global biotech companies further drive NGS adoption in the region.
Competitive Landscape:
The next generation sequencing (NGS) market is highly competitive and features rapid advances in sequencing technologies and applications. Key players concentrate on innovation in sequencing platforms, data analysis tools, and reagents to maintain market leadership. For instance, in January 2023, QIAGEN Digital Insights introduced a significant upgrade to its QIAGEN CLC Genomics Workbench Premium, enabling ultra-fast next NGS analysis. The new LightSpeed technology allows for the analysis of a whole human genome at 34x coverage in just 25 minutes and a whole exome in 90 seconds. This advancement reduces costs to approximately $1 per genome and mere cents for exomes. This advancement streamlines genomic profiling for research and clinical labs, reducing analysis time and improving efficiency. Strategic collaborations between biopharmaceutical companies and research institutions are common, fostering innovation and expanding application areas in oncology, diagnostics, and drug discovery. Furthermore, the integration of artificial intelligence and cloud computing in NGS workflows further accelerates competition, pushing continuous technological advancements.
The report provides a comprehensive analysis of the competitive landscape in the next generation sequencing market with detailed profiles of all major companies, including:
- 10x Genomics Inc.
- Agilent Technologies, Inc.
- BGI Genomics (BGI Group)
- Bio-Rad Laboratories, Inc.
- Eurofins Scientific SE
- F. Hoffmann-La Roche Ltd. (Roche Holding AG)
- Illumina, Inc.
- Macrogen Inc.
- Novogene Co., Ltd.
- QIAGEN N.V.
- Takara Bio Inc.
- Thermo Fisher Scientific Inc.
Latest News and Developments:
- March 2024: MedGenome, a global genomics company in South Asia, has partnered with the Darshan GIVA Foundation, a non-governmental organization, to pioneer a transformative approach to TB diagnosis and treatment using whole genome sequencing.
- March 2024: seqWell, a global provider of genomic library workflow solutions, announced the launch of their new ExpressPlex HT Library Preparation Kit (ExpressPlex HT). The product would be the first commercially available next-generation sequencing (NGS) library preparation kit containing all the required reagents and indices to enable multiplexing up to 6,144 samples in a pre-plated 384-well format.
- March 2023: SOPHiA GENETICS announced a partnership with Qiagen to integrate QIAseq reagent technology with the DDM platform. This collaboration aims to improve tumor analysis by leveraging the advanced capabilities of next-generation sequencing (NGS).
- January 2023: QIAGEN announced a strategic partnership with California-based population genomics leader Helix to advance next-generation sequencing companion diagnostics in hereditary diseases.
- April 2022: Thermo Fisher Scientific launched the Ion Torrent Genexus Dx Integrated Sequencer, marking a significant advancement in NGS. This automated platform delivers results in as little as one day, enabling both diagnostic testing and clinical research. The company aims to enhance access to precision medicine. The Genexus System was initially introduced in 2019, emphasizing a user-friendly, automated workflow to reduce human error in laboratories.
Next Generation Sequencing Market Report Scope:
| Report Features | Details |
|---|---|
| Base Year of the Analysis | 2025 |
| Historical Period | 2020-2025 |
| Forecast Period | 2026-2034 |
| Units | Billion USD |
| Scope of the Report |
Exploration of Historical Trends and Market Outlook, Industry Catalysts and Challenges, Segment-Wise Historical and Future Market Assessment:
|
| Sequence Types Covered | Whole Genome Sequencing, Targeted Resequencing, Whole Exome Sequencing, RNA Sequencing, CHIP Sequencing, De Novo Sequencing, Methyl Sequencing, Others |
| Product Types Covered | Instruments, Reagents and Consumables, Software and Services |
| Technologies Covered | Sequencing by Synthesis, Ion Semiconductor Sequencing, Single-Molecule Real-Time Sequencing, Nanopore Sequencing, Others |
| Applications Covered | Biomarker and Cancer, Drug Discovery and Personalized Medicine, Genetic Screening, Diagnostics, Agriculture and Animal Research, Others |
| End-Users Covered | Academic Institutes & Research Centers, Hospitals & Clinics, Pharmaceutical & Biotechnology Companies, Others |
| Regions Covered | Asia Pacific, Europe, North America, Latin America, Middle East and Africa |
| Countries Covered | United States, Canada, Germany, France, United Kingdom, Italy, Spain, Russia, China, Japan, India, South Korea, Australia, Indonesia, Brazil, Mexico |
| Companies Covered | 10x Genomics Inc., Agilent Technologies, Inc., BGI Genomics (BGI Group), Bio-Rad Laboratories, Inc., Eurofins Scientific SE, F. Hoffmann-La Roche Ltd. (Roche Holding AG), Illumina, Inc., Macrogen Inc., Novogene Co., Ltd., QIAGEN N.V., Takara Bio Inc., Thermo Fisher Scientific Inc., etc. |
| Customization Scope | 10% Free Customization |
| Post-Sale Analyst Support | 10-12 Weeks |
| Delivery Format | PDF and Excel through Email (We can also provide the editable version of the report in PPT/Word format on special request) |
Key Benefits for Stakeholders:
- IMARC’s report offers a comprehensive quantitative analysis of various market segments, historical and current market trends, market forecasts, and dynamics of the next generation sequencing market from 2020-2034.
- The research study provides the latest information on the market drivers, challenges, and opportunities in the global next generation sequencing market.
- The study maps the leading, as well as the fastest-growing, regional markets. It further enables stakeholders to identify the key country-level markets within each region.
- Porter's Five Forces analysis assists stakeholders in assessing the impact of new entrants, competitive rivalry, supplier power, buyer power, and the threat of substitution. It helps stakeholders to analyze the level of competition within the next generation sequencing industry and its attractiveness.
- Competitive landscape allows stakeholders to understand their competitive environment and provides an insight into the current positions of key players in the market.
Frequently Asked Questions About the Next generation Sequencing Market Report
Next generation sequencing is an advanced DNA sequencing technology enabling rapid, high-throughput analysis of genetic material. It is widely used in genomics, personalized medicine, agriculture, and research, facilitating applications such as disease diagnosis, genetic profiling, and the development of targeted therapies, ensuring more efficient and precise scientific and medical advancements.
The global next generation sequencing market was valued at USD 27.0 Billion in 2025.
IMARC estimates the global next generation sequencing market to exhibit a CAGR of 14.29% during 2026-2034.
The market is driven by advancements in genomics research, rising demand for personalized medicine, and increasing adoption in clinical diagnostics. Factors such as decreasing sequencing costs, technological innovations, and growing applications in oncology, infectious disease testing, and agriculture further propel market growth, supporting precision healthcare and biotechnology developments.
According to the report, targeted resequencing represented the largest segment by sequencing type due to its efficiency in analyzing specific genomic regions of interest. This method minimizes data complexity, reduces costs, and enhances sequencing depth, making it ideal for clinical diagnostics, cancer research, and inherited disease studies. Its precision and scalability support widespread adoption across academic, clinical, and pharmaceutical sectors globally.
According to the report, reagents and consumables represented the largest segment by product type, driven by their recurring demand in sequencing workflows. These products are essential for sample preparation, library construction, and sequencing processes. Their critical role in achieving accurate, high-quality results ensures consistent usage across research institutions, clinical diagnostics, and pharmaceutical applications, contributing significantly to market growth.
According to the report, sequencing by synthesis represented the largest segment by technology. Renowned for its accuracy and scalability, SBS enables high-throughput sequencing with cost efficiency. Its widespread adoption across genomics research, clinical diagnostics, and personalized medicine underscores its reliability and precision, solidifying its position as a cornerstone in modern sequencing technologies.
According to the report, biomarker and cancer represented the largest segment by application. NGS enables precise identification of genetic mutations, facilitating early cancer detection, personalized treatment strategies, and targeted therapy development. Its ability to analyze biomarkers with high accuracy positions NGS as a transformative tool in oncology and precision medicine, driving its widespread adoption in clinical and research settings.
According to the report, academic institutes and research centers represented the largest segment by end user. These institutions utilize NGS for groundbreaking research in genomics, transcriptomics, and epigenetics. Their focus on advancing scientific understanding, identifying disease mechanisms, and developing innovative solutions drives extensive adoption of NGS technology, significantly contributing to its growth and evolution in the global research ecosystem.
On a regional level, the market has been classified into North America, Asia Pacific, Europe, Latin America, and Middle East and Africa, wherein North America currently dominates the global market.
Some of the major players in the global next generation sequencing market include 10x Genomics Inc., Agilent Technologies, Inc., BGI Genomics (BGI Group), Bio-Rad Laboratories, Inc., Eurofins Scientific SE, F. Hoffmann-La Roche Ltd. (Roche Holding AG), Illumina, Inc., Macrogen Inc., Novogene Co., Ltd., QIAGEN N.V., Takara Bio Inc., Thermo Fisher Scientific Inc., etc.
Need more help?
- Speak to our experienced analysts for insights on the current market scenarios.
- Include additional segments and countries to customize the report as per your requirement.
- Gain an unparalleled competitive advantage in your domain by understanding how to utilize the report and positively impacting your operations and revenue.
- For further assistance, please connect with our analysts.
 Request Customization
 Speak to an Analyst
 Request Brochure
 Inquire Before Buying
Benefits of Customization
- Personalize this research
- Triangulate with your data
- Get data as per your format and definition
- Gain a deeper dive into a specific application, geography, customer, or competitor
- Any level of personalization
Get in Touch With Us
UNITED STATES
Phone: +1-201-971-6302
INDIA
Phone: +91-120-433-0800
UNITED KINGDOM
Phone: +44-753-714-6104
Email: [email protected]
Client Testimonials


.webp)


