
Nitric Acid Prices, Trend, Chart, Demand, Market Analysis, News, Historical and Forecast Data Report 2026 Edition
Nitric Acid Prices, Index, Trend, Historcial and Forecast
Track real-time and historical nitric acid prices across global regions. Updated monthly with market insights, drivers, and forecasts.
Nitric Acid Prices – Latest Update (May 2026)
As of May 2026, global nitric acid prices are trading steadily at around USD 0.30 –0.42 per kg. In May 2026, nitric acid prices were influenced by balanced-to-firm demand from the fertilizer, chemical, explosives, and metal processing sectors. Feedstock ammonia remained a major cost driver, as nitric acid production depends heavily on ammonia and energy inputs. Higher natural gas and electricity costs in some markets increased production expenses, while stable feedstock availability helped limit sharper price gains in others. Demand from ammonium nitrate and nitrogen fertilizer production supported baseline consumption, especially where agricultural procurement remained active. Industrial demand from chemical synthesis and mining related applications also contributed to steady offtake. However, buyers remained cautious in several markets, preferring need based procurement due to high input costs and uncertain downstream margins. This kept price movement firm but controlled rather than sharply volatile.
Supply side factors also played an important role in shaping nitric acid pricing during the month. Plant operating rates, maintenance shutdowns, production restarts, and raw material availability influenced regional supply balance. Any disruption in ammonia supply or nitric acid plant operations tightened spot availability and supported higher offers. Import-dependent markets faced additional pressure from freight charges, port handling costs, customs, currency fluctuations, and domestic logistics expenses. Environmental compliance costs, including emissions control and regulatory documentation, also added to production and procurement costs in key producing regions.
Latest Key Prices Snapshot ( Table )
| Metric | Latest Value |
|---|---|
| Global Benchmark Price | USD 0.36/Kg |
| Global Average Price Range in May 26 | USD 0.30 - 0.42 per Kg |
| Northeast Asia | USD 0.23/Kg |
| Europe | USD 0.29/Kg |
| North America | USD 0.43/KgUSD 0.43/Kg |
| Monthly Change % | +1.2% to +2.1% |
| YoY Change % | 4.2% (Slightly higher) |
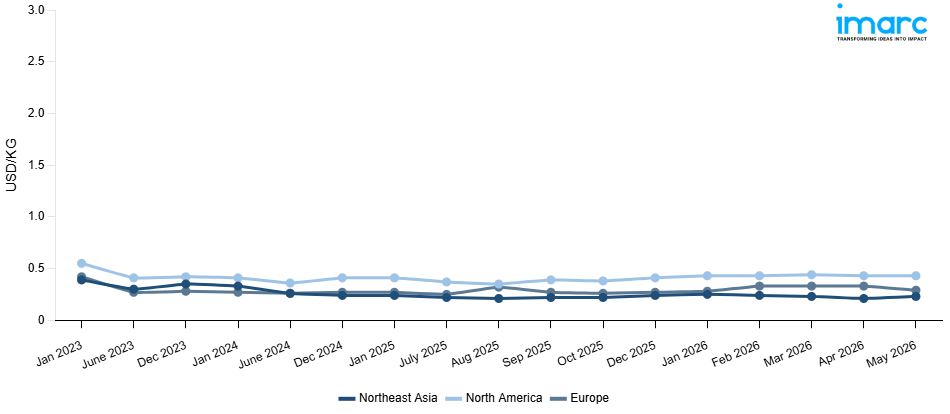
Nitric Acid Price Index (USD/Kg):
The chart below highlights monthly nitric acid prices across different regions.
Get Access to Monthly/Quarterly/Yearly Prices, Request Sample
Q4 25 VS Q1 26
Between Q4 2025 and Q1 2026, the nitric acid market showed a mixed pricing trend across the listed regions. Northeast Asia recorded a decline of 4.2%, with prices falling from USD 0.24/Kg to USD 0.23/Kg. The decrease indicates softer buying activity and adequate supply availability, which limited price support. Moderate demand from downstream fertilizer, nitrate, and chemical intermediate sectors may have reduced procurement urgency. Stable production and sufficient inventories also kept the market under mild pressure.
Europe recorded the strongest upward movement, with prices rising by 22.2% from USD 0.27/Kg to USD 0.33/Kg. The increase suggests firmer demand and higher production cost pressure. Feedstock ammonia costs, energy expenses, plant operating rates, and logistics charges likely supported the upward price movement. Buyers maintained procurement to meet downstream industrial and fertilizer requirements, which strengthened market sentiment. North America also witnessed an upward trend, with prices increasing by 7.3% from USD 0.41/Kg to USD 0.44/Kg. The rise was supported by steady demand from fertilizer, explosives, and chemical manufacturing applications. Higher operating costs and controlled supply availability added further support.
Key Factors Influencing Nitric Acid Prices:
Several factors influence nitric acid price movements globally
- Ammonia Feedstock Costs: Nitric acid production depends heavily on ammonia, making its pricing highly sensitive to ammonia market trends. Fluctuations in natural gas prices, a key input for ammonia production, directly impact manufacturing costs and influence overall nitric acid pricing levels globally.
- Energy and Production Expenses: Nitric acid manufacturing is energy-intensive, requiring significant electricity and fuel inputs. Rising energy tariffs, especially in industrialized regions, increase operational costs, while stable or declining energy prices can moderate price volatility and support competitive market conditions.
- Fertilizer and Industrial Demand: Strong demand from fertilizer producers, particularly for ammonium nitrate, plays a central role in price determination. Additionally, consumption from explosives, mining, and chemical manufacturing sectors influences regional supply-demand balance and pricing direction.
- Supply Availability and Logistics: Plant operating rates, maintenance shutdowns, and capacity utilization affect market supply. Limited availability or temporary outages can support price increases, while smooth logistics, adequate inventories, and stable trade flows help maintain balanced pricing trends.
Nitric Acid Prices Overview by Region – May 2026
Northeast Asia: Northeast Asia recorded a 9.5% increase in May 2026, with nitric acid prices settling at USD 0.23/Kg. The upward movement was supported by improved downstream demand from fertilizer, nitrate, and chemical intermediate sectors. Stable procurement from industrial users helped strengthen market sentiment, while controlled supply availability supported firmer offers. Feedstock ammonia costs, plant operating rates, and domestic logistics also influenced pricing. Buyers continued need-based purchasing, but higher replacement costs encouraged steady procurement. Overall, the market showed a firm trend, supported by better demand conditions and balanced supply.
Europe: Europe recorded a 12.1% decline in May 2026, with nitric acid prices falling to USD 0.29/Kg. The decrease was driven by softer downstream demand and reduced buying activity from fertilizer and industrial chemical sectors. Adequate supply availability and stable production levels eased pressure on spot prices. Lower procurement urgency among buyers further weakened market sentiment. Feedstock and energy costs remained key cost factors, but sufficient inventories limited upward price movement. Overall, the market showed a bearish trend due to weak demand, comfortable supply, and cautious purchasing.
North America: North America recorded stable pricing in May 2026, with nitric acid prices unchanged at USD 0.43/Kg. The flat movement reflected balanced demand and supply conditions across the regional market. Steady consumption from fertilizer, explosives, and chemical manufacturing applications supported baseline procurement. At the same time, sufficient inventories and stable operating rates prevented any major upward pressure. Feedstock ammonia, energy, logistics, and plant production costs continued to influence market values. Overall, the market remained steady, with buyers maintaining controlled procurement and sellers keeping offers largely unchanged.
Nitric Acid Price Forecast
Short-Term Trend (Next 3 Months)
Nitric acid prices are expected to remain mostly steady, with region-wise variation. Northeast Asia may see mild upward pressure if downstream demand from fertilizer, nitrate, and chemical intermediate sectors continues to improve. Europe may remain soft due to cautious procurement, adequate supply, and weaker buying momentum. North America is likely to stay stable, supported by balanced demand from fertilizer, explosives, and chemical manufacturing applications. Feedstock ammonia costs, energy prices, plant operating rates, logistics expenses, and inventory levels will remain key pricing factors. Overall, the market is expected to show a stable to mixed trend, with limited sharp movement unless supply disruptions or feedstock cost changes emerge.
Mid-Term Trend (2026–2027)
With the help of consistent expansion in the fields of agriculture, animal feed preservation, leather manufacturing, and textile applications, nitric acid prices are anticipated to follow a relatively strong trajectory during 2026–2027. It is anticipated that growing demand from emerging economies will progressively reinforce global spending trends. However, supply availability may be balanced by capacity increases in important producing locations, preventing undue price hikes. Important factors influencing pricing will continue to include changes in the price of feedstock methanol, European energy cost patterns, and Asian export competitiveness. Operating expenses may also be impacted by sustainability-focused production methods and environmental restrictions. The market is expected to increase gradually overall, with sporadic oscillations caused by changes in supply and demand rather than excessive volatility.
Nitric Acid Price History (2022–2026) – Table / Para format
| Year | Market Movement | Key Event |
|---|---|---|
| 2021-2022 | Sharp Increase | Supply chain disruptions, constrained transportation networks, and strong demand from explosives |
| 2023-2024 | Market Softening | Improved logistics, normalized trade flows, and reduced procurement from construction sector |
| 2025 | Volatile Recovery | Periodic plant maintenance turnarounds and fluctuating industrial activity |
| 2026 | Balanced Conditions | Stable operating rates, controlled inventory levels, and consistent demand from fertilizers |
This historical trend shows recurring cycles tied to macroeconomic and agricultural supply factors.
Nitric Acid Market Outlook
The global nitric acid market is expected to maintain a stable to moderately firm trajectory over the near to mid-term, supported by consistent demand from fertilizers, explosives, adipic acid, and nitrobenzene production. The agriculture sector will remain a primary consumption driver, particularly in regions with strong crop cultivation and fertilizer application rates. Mining and infrastructure development activities are also anticipated to sustain demand for ammonium nitrate-based explosives.
Nitric Acid Industry Analysis
The global nitric acid industry size reached USD 32.0 Billion in 2025. By 2034, IMARC Group expects the market to reach USD 42.8 Billion, at a projected CAGR of 3.27% during 2026-2034. The market is driven by the rising fertilizer production, expanding demand from the explosives industry, stable consumption in nylon intermediates, and increasing investments in modernized nitric acid facilities to optimize energy efficiency.
Latest Developments in the Nitric Acid Industry
- March 2025: Gujarat Narmada Valley Fertilizers and Chemicals Ltd (GNFC) finalized a contract with thyssenkrupp Udhe India Private Ltd (TKUIPL) for the establishment of a new weak nitric acid-III plant with a production capacity of 600 metric tonnes per day (equivalent to around 200,000 metric tonnes per annum).
- July 2024: Stamicarbon teamed up with NextChem Tech to perform a feasibility study and a pre-FEED contract for FertigHy. According to this agreement, Stamicarbon will supply its NX Stami Green AmmoniaTM and NX Stami Nitric AcidTM technologies for FertigHy's inaugural low-carbon fertilizer facility in France.
- April 2024: Tata Projects Limited (TPL) took over the nitric acid expansion initiative of Deepak Fertilizers and Petrochemicals Corporation Ltd. (DFPCL).
Product Description
Nitric acid (HNO₃) is a highly corrosive and colorless mineral acid, classified as an important inorganic chemical used globally in bulk volumes. It plays a critical role in the industrial value chain as a key intermediate for ammonium nitrate fertilizers, explosives, and nylon precursors such as adipic acid. Its defining property lies in its strong oxidizing ability, making it indispensable in metallurgical refining, specialty chemicals, and military-grade applications. The compound is widely consumed in the production of fertilizers, supporting global agricultural productivity, while also serving as a core input in the automotive, construction, and mining sectors, where it enhances performance through durability and explosive efficiency.
Key Supplier List
The key suppliers of nitric acid are:
- CF Industries Holdings Inc.
- Nutrien Ltd.
- Deepak Fertilizers and Petrochemicals Corp. Ltd.
- Yara International ASA
- Sasol Limited
- Columbus Chemical Industries
Report Coverage
| Key Attributes | Details |
|---|---|
| Product Name | Nitric Acid |
| Report Features | Exploration of Historical Trends and Market Outlook, Industry Demand, Industry Supply, Gap Analysis, Challenges, Nitric Acid Price Analysis, and Segment-Wise Assessment. |
| Currency/Units | US$ (Data can also be provided in local currency) or Metric Tons |
| Region/Countries Covered | The current coverage includes analysis at the global and regional levels only. Based on your requirements, we can also customize the report and provide specific information for the following countries: Asia Pacific: China, India, Indonesia, Pakistan, Bangladesh, Japan, Philippines, Vietnam, Thailand, South Korea, Malaysia, Nepal, Taiwan, Sri Lanka, Hongkong, Singapore, Australia, and New Zealand Europe: Germany, France, United Kingdom, Italy, Spain, Russia, Turkey, Netherlands, Poland, Sweden, Belgium, Austria, Ireland, Switzerland, Norway, Denmark, Romania, Finland, Czech Republic, Portugal and Greece North America: United States and Canada Latin America: Brazil, Mexico, Argentina, Columbia, Chile, Ecuador, and Peru Middle East & Africa: Saudi Arabia, UAE, Israel, Iran, South Africa, Nigeria, Oman, Kuwait, Qatar, Iraq, Egypt, Algeria, and Morocco The list of countries presented is not exhaustive. Information on additional countries can be provided if required by the client. |
| Information Covered for Key Suppliers |
|
| Customization Scope | The report can be customized as per the requirements of the customer |
| Report Price and Purchase Option |
Plan A: Monthly Updates - Annual Subscription
Plan B: Quarterly Updates - Annual Subscription
Plan C: Biannually Updates - Annual Subscription
|
| Post-Sale Analyst Support | 360-degree analyst support after report delivery |
| Delivery Format | PDF and Excel through email (We can also provide the editable version of the report in PPT/Word format on special request) |
Key Benefits for Stakeholders:
- IMARC’s report presents a detailed analysis of nitric acid pricing, covering global and regional trends, spot prices at key ports, and a breakdown of Ex Works, FOB, and CIF prices.
- The study examines factors affecting nitric acid price trend, including raw material costs, supply-demand shifts, geopolitical impacts, and industry developments, offering insights for informed decision-making.
- The competitive landscape review equips stakeholders with crucial insights into the latest market news, regulatory changes, and technological advancements, ensuring a well-rounded, strategic overview for forecasting and planning.
- IMARC offers various subscription options, including monthly, quarterly, and biannual updates, allowing clients to stay informed with the latest market trends, ongoing developments, and comprehensive market insights. The nitric acid price charts ensure our clients remain at the forefront of the industry.
Frequently Asked Questions About the Nitric Acid Price Trend Report
Nitric acid prices in May 2026 are averaging between USD 0.30 - 0.42 per Kg, depending on region and grade. North America markets are currently trading above global averages due to tighter supply.
In 2026, nitric acid prices generally showed a stable to moderately increasing trend compared with the previous year. Prices were influenced by steady demand from key end-uses and relatively stable feedstock costs, especially ammonia and energy inputs.
The nitric acid price index aggregates pricing data from major producing and consuming regions, reflecting changes in supply, demand, trade flows, and benchmark futures pricing.
The nitric acid price forecast suggests annual growth of approx. 3%-4% through 2030 supported by demand growth from detergents, water treatment chemicals, and silica gel applications.
Nitric acid price history data can be accessed through detailed quarterly and annual pricing reports, including regional benchmarks and historical trend analysis.
Need more help?
- Speak to our experienced analysts for insights on the current market scenarios.
- Include additional segments and countries to customize the report as per your requirement.
- Gain an unparalleled competitive advantage in your domain by understanding how to utilize the report and positively impacting your operations and revenue.
- For further assistance, please connect with our analysts.
 Request Customization
 Inquire Before Buying
 Speak to an Analyst
 Request Brochure
Benefits of Customization
- Personalize this research
- Triangulate with your data
- Get data as per your format and definition
- Gain a deeper dive into a specific application, geography, customer, or competitor
- Any level of personalization
Get in Touch With Us
UNITED STATES
Phone: +1-201-971-6302
INDIA
Phone: +91-120-433-0800
UNITED KINGDOM
Phone: +44-753-714-6104
Email: [email protected]
Client Testimonials


.webp)


Related Reports
Why Choose Us
IMARC offers trustworthy, data-centric insights into commodity pricing and evolving market trends, enabling businesses to make well-informed decisions in areas such as procurement, strategic planning, and investments. With in-depth knowledge spanning more than 1000 commodities and a vast global presence in over 150 countries, we provide tailored, actionable intelligence designed to meet the specific needs of diverse industries and markets.
1000
+Commodities
150
+Countries Covered
3000
+Clients
20
+Industry
Robust Methodologies & Extensive Resources
IMARC delivers precise commodity pricing insights using proven methodologies and a wealth of data to support strategic decision-making.
Subscription-Based Databases
Our extensive databases provide detailed commodity pricing, import-export trade statistics, and shipment-level tracking for comprehensive market analysis.
Primary Research-Driven Insights
Through direct supplier surveys and expert interviews, we gather real-time market data to enhance pricing accuracy and trend forecasting.
Extensive Secondary Research
We analyze industry reports, trade publications, and market studies to offer tailored intelligence and actionable commodity market insights.
Trusted by 3000+ industry leaders worldwide to drive data-backed decisions. From global manufacturers to government agencies, our clients rely on us for accurate pricing, deep market intelligence, and forward-looking insights.