
Nitrogen Prices, Trend, Chart, Demand, Market Analysis, News, Historical and Forecast Data Report 2026 Edition
Nitrogen Price Trend, Index and Forecast
Track real-time and historical nitrogen prices across global regions. Updated monthly with market insights, drivers, and forecasts.
Nitrogen Prices June 2026
| Region | Price (USD/Kg) | Latest Movement |
|---|---|---|
| Europe | 0.14 | -22.2% ↓ Down |
| North America | 0.1 | -9.1% ↓ Down |
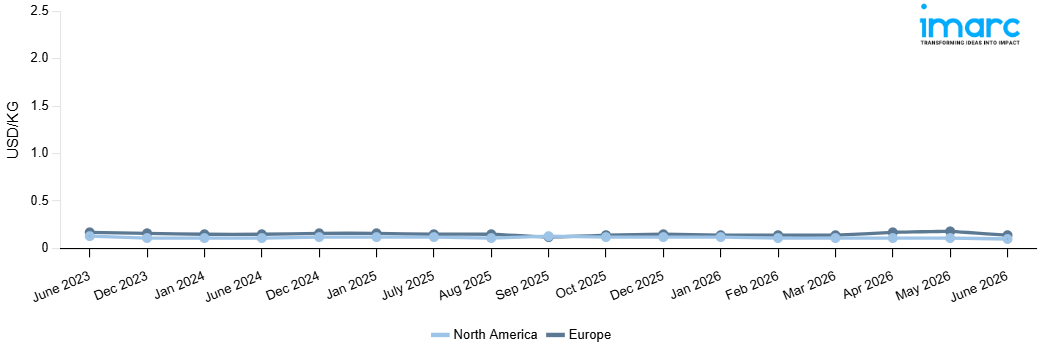
Nitrogen Price Index (USD/KG):
The chart below highlights monthly nitrogen prices across different regions.
Get Access to Monthly/Quarterly/Yearly Prices, Request Sample
Market Overview Q1 Ending March 2026
Europe: The nitrogen prices in Europe reached 0.14 USD/KG in March 2026. The downward pricing movement registered between December and March 2026 was 6.7%. The notable price decline was primarily driven by easing energy costs across the region, as declining electricity and natural gas prices significantly reduced operational expenses for air separation unit operators running energy intensive cryogenic distillation processes. Improved supply availability resulting from resumed operations at key industrial gas production facilities following completion of maintenance turnarounds further alleviated regional supply constraints. Softened demand from the metal fabrication and manufacturing sectors amid broader industrial contraction reduced consumption volumes throughout the quarter.
North America: The nitrogen prices in North America reached 0.11 USD/KG in March 2026. The downward pricing movement registered between December and March 2026 was 8.3%. The significant price drop was due to weakened demand in the oil and gas industry, which saw a decline in enhanced oil recovery activities and a moderation of drilling, leading to a significant drop in overall industrial nitrogen consumption in the region. The drop in upstream oil and gas costs also reduced production costs for air separation units, lowering base price benchmarks. The increase in domestic production capacity from newly commissioned plants provided a sufficient supply base, and excess supply from established industrial gas plants also contributed to downward pressure on prices.
Market Overview Q4 Ending December 2025
Europe: The nitrogen prices in Europe reached 0.15 USD/KG in December 2025. The upward pricing movement registered between September and December 2025 was 23.6%. The substantial price appreciation was primarily driven by escalating energy costs across the region, as rising natural gas prices significantly elevated production expenses for air separation unit operators. Regional availability was further restricted due to limited supply resulting from planned maintenance shutdowns at major nitrogen-generating plants. Stable consumption fundamentals were maintained by strong demand from the food packaging and pharmaceutical industries, which stepped up purchases to ensure sufficient inert gas supplies for their year-end production plans. Positive pricing developments during the quarter were also fueled by increased competition in procurement, driven by growing demand from the metal fabrication and electronics industries.
North America: The nitrogen prices in North America reached 0.12 USD/KG in December 2025. The downward pricing movement registered between September and December 2025 was 5.4%. The price drop mirrored weaker demand from the oil and gas sector, as reduced enhanced oil recovery operations moderated industrial nitrogen usage throughout the region. Favorable natural gas pricing conditions reduced production costs for air separation unit operators, hence lowering baseline pricing benchmarks. Sufficient domestic production capabilities from leading industrial gas suppliers maintained a stable supply, but moderate demand in the food processing and chemical manufacturing industries offered minimal price support. The cautious purchasing practices of end users, amid uncertain industrial demand, dampened the rising pricing trend, leading to adverse market conditions during the quarter.
Market Overview Q3 Ending September 2025
Europe: In Europe, nitrogen prices fell sharply due to weakened demand from the chemical and fertilizer industries. The nitrogen price index showed a clear downturn as oversupply from industrial gas producers coincided with reduced procurement activity from downstream sectors. Stable feedstock availability and lower energy costs further amplified the bearish sentiment. Additionally, muted seasonal activity in agriculture and slower industrial output reinforced the downward momentum, weighing heavily on regional pricing this quarter.
North America: In North America, nitrogen prices surged as robust demand from healthcare, chemicals, and food processing sectors supported market momentum. The nitrogen price index reflected heightened procurement activity, particularly in fertilizers and industrial gas applications. Supply limitations in certain regions, coupled with strong activity in the energy and manufacturing sectors, pushed prices upward. Increased infrastructure and agricultural usage added resilience to pricing, resulting in a strong bullish trend across this quarter.
Nitrogen Price Trend, Market Analysis, and News
IMARC's latest publication, “Nitrogen Prices, Trend, Chart, Demand, Market Analysis, News, Historical and Forecast Data Report 2026 Edition,” presents a detailed examination of the nitrogen market, providing insights into both global and regional trends that are shaping prices. This report delves into the spot price of nitrogen at major ports and analyzes the composition of prices, including FOB and CIF terms. It also presents detailed nitrogen prices trend analysis by region, covering North America, Europe, Asia Pacific, Latin America, and Middle East and Africa. The factors affecting nitrogen pricing, such as the dynamics of supply and demand, geopolitical influences, and sector-specific developments, are thoroughly explored. This comprehensive report helps stakeholders stay informed with the latest market news, regulatory updates, and technological progress, facilitating informed strategic decision-making and forecasting.
.webp)
Nitrogen Industry Analysis
The global nitrogen industry size reached USD 44.1 Billion in 2025. By 2034, IMARC Group expects the market to reach USD 87.1 Billion, at a projected CAGR of 7.62% during 2026-2034. Growth is driven by rising applications in fertilizers, expanding demand in chemicals and healthcare, and increasing utilization in food processing and electronics, supported by advancements in industrial gas technologies and broadening adoption across emerging economies.
Latest developments in the Nitrogen Industry:
- June 2025: Linde signed a long-term supply agreement to provide nitrogen and oxygen to the Blue Point low-carbon ammonia project on the US Gulf Coast. To fulfill this contract, Linde committed to invest approximately USD 400 million in a large air separation unit (ASU) that it will build, own, and operate onsite.
- February 2025: AGC Vinythai and BIG entered into a cooperation agreement to deliver low-carbon nitrogen and oxygen via pipeline for sustainable petrochemical production. This collaboration is expected to enhance the use of clean industrial gases in regional chemical operations, reinforcing both companies’ sustainability agendas.
- December 2024: Grupa Azoty developed its product line through the introduction of the granular nitrogen fertilizer eNpluS which contains sulfur and calcium. Grupa Azoty implements its product development approach based on market requirements through this strategic move. eNpluS production facilities will operate at both Puławy and Kędzierzyn-Koźle sites after the product launched recently among other new additions to the product line-up.
- November 2024: National Fertilizers (NFL), a government-owned enterprise, announced plans to commence nano urea production at its Nangal plant. The company aims to manufacture 1.5 lakh bottles of 500 ml per day at its nangal plant with the new variant.
- April 2024: Messer commissioned a new energy-efficient nitrogen plant in Székesfehérvár, Hungary, to serve the nitrogen requirements of Harman’s automotive electronics manufacturing facility, aiming to reduce energy consumption and emissions compared to prior nitrogen production methods.
- April 2024: INOX India Ltd secured a patent for a novel method to suspend internal vessels in Dewar-type cryogenic containers used for liquids like nitrogen, oxygen, and argon, improving the stability, safety, and efficiency of these storage systems.
Product Description
Nitrogen (N₂) is a diatomic, colorless, odorless, and inert gas that constitutes approximately 78% of the Earth’s atmosphere. Industrially, nitrogen is produced primarily via cryogenic air separation and pressure swing adsorption processes. Due to its inert properties, it is widely employed in diverse industries. In agriculture, nitrogen is a crucial component for producing ammonia-based fertilizers, supporting crop yield and food production. In healthcare, it is used in cryopreservation, medical gas mixtures, and pharmaceutical processes. In chemicals and manufacturing, nitrogen acts as a protective atmosphere for preventing oxidation during metal processing and electronics production. It also plays an important role in food packaging, water treatment, and energy applications, making it an essential industrial gas across global industries.
Report Coverage
| Key Attributes | Details |
|---|---|
| Product Name | Nitrogen |
| Report Features | Exploration of Historical Trends and Market Outlook, Industry Demand, Industry Supply, Gap Analysis, Challenges, Nitrogen Price Analysis, and Segment-Wise Assessment. |
| Currency/Units | US$ (Data can also be provided in local currency) or Metric Tons |
| Region/Countries Covered | The current coverage includes analysis at the global and regional levels only. Based on your requirements, we can also customize the report and provide specific information for the following countries: Asia Pacific: China, India, Indonesia, Pakistan, Bangladesh, Japan, Philippines, Vietnam, Thailand, South Korea, Malaysia, Nepal, Taiwan, Sri Lanka, Hongkong, Singapore, Australia, and New Zealand Europe: Germany, France, United Kingdom, Italy, Spain, Russia, Turkey, Netherlands, Poland, Sweden, Belgium, Austria, Ireland, Switzerland, Norway, Denmark, Romania, Finland, Czech Republic, Portugal and Greece North America: United States and Canada Latin America: Brazil, Mexico, Argentina, Columbia, Chile, Ecuador, and Peru Middle East & Africa: Saudi Arabia, UAE, Israel, Iran, South Africa, Nigeria, Oman, Kuwait, Qatar, Iraq, Egypt, Algeria, and Morocco The list of countries presented is not exhaustive. Information on additional countries can be provided if required by the client. |
| Information Covered for Key Suppliers |
|
| Customization Scope | The report can be customized as per the requirements of the customer |
| Report Price and Purchase Option |
Plan A: Monthly Updates - Annual Subscription
Plan B: Quarterly Updates - Annual Subscription
Plan C: Biannually Updates - Annual Subscription
|
| Post-Sale Analyst Support | 360-degree analyst support after report delivery |
| Delivery Format | PDF and Excel through email (We can also provide the editable version of the report in PPT/Word format on special request) |
Key Benefits for Stakeholders:
- IMARC’s report presents a detailed analysis of nitrogen pricing, covering global and regional trends, spot prices at key ports, and a breakdown of FOB and CIF prices.
- The study examines factors affecting nitrogen price trend, including input costs, supply-demand shifts, and geopolitical impacts, offering insights for informed decision-making.
- The competitive landscape review equips stakeholders with crucial insights into the latest market news, regulatory changes, and technological advancements, ensuring a well-rounded, strategic overview for forecasting and planning.
- IMARC offers various subscription options, including monthly, quarterly, and biannual updates, allowing clients to stay informed with the latest market trends, ongoing developments, and comprehensive market insights. The nitrogen price charts ensure our clients remain at the forefront of the industry.
Frequently Asked Questions About the Nitrogen Price Trend Report
The nitrogen prices in June 2026 were 0.14 USD/KG in Europe and 0.1 USD/KG in North America.
The nitrogen pricing data is updated on a monthly basis.
We provide the pricing data primarily in the form of an Excel sheet and a PDF.
Yes, our report includes a forecast for nitrogen prices.
The regions covered include North America, Europe, Asia Pacific, Middle East, and Latin America. Countries can be customized based on the request (additional charges may be applicable).
Yes, we provide both FOB and CIF prices in our report.
Need more help?
- Speak to our experienced analysts for insights on the current market scenarios.
- Include additional segments and countries to customize the report as per your requirement.
- Gain an unparalleled competitive advantage in your domain by understanding how to utilize the report and positively impacting your operations and revenue.
- For further assistance, please connect with our analysts.
 Request Customization
 Inquire Before Buying
 Speak to an Analyst
 Request Brochure
Benefits of Customization
- Personalize this research
- Triangulate with your data
- Get data as per your format and definition
- Gain a deeper dive into a specific application, geography, customer, or competitor
- Any level of personalization
Get in Touch With Us
UNITED STATES
Phone: +1-201-971-6302
INDIA
Phone: +91-120-433-0800
UNITED KINGDOM
Phone: +44-753-714-6104
Email: [email protected]
Client Testimonials


.webp)


Why Choose Us
IMARC offers trustworthy, data-centric insights into commodity pricing and evolving market trends, enabling businesses to make well-informed decisions in areas such as procurement, strategic planning, and investments. With in-depth knowledge spanning more than 1000 commodities and a vast global presence in over 150 countries, we provide tailored, actionable intelligence designed to meet the specific needs of diverse industries and markets.
1000
+Commodities
150
+Countries Covered
3000
+Clients
20
+Industry
Robust Methodologies & Extensive Resources
IMARC delivers precise commodity pricing insights using proven methodologies and a wealth of data to support strategic decision-making.
Subscription-Based Databases
Our extensive databases provide detailed commodity pricing, import-export trade statistics, and shipment-level tracking for comprehensive market analysis.
Primary Research-Driven Insights
Through direct supplier surveys and expert interviews, we gather real-time market data to enhance pricing accuracy and trend forecasting.
Extensive Secondary Research
We analyze industry reports, trade publications, and market studies to offer tailored intelligence and actionable commodity market insights.
Trusted by 3000+ industry leaders worldwide to drive data-backed decisions. From global manufacturers to government agencies, our clients rely on us for accurate pricing, deep market intelligence, and forward-looking insights.