Market Overview:
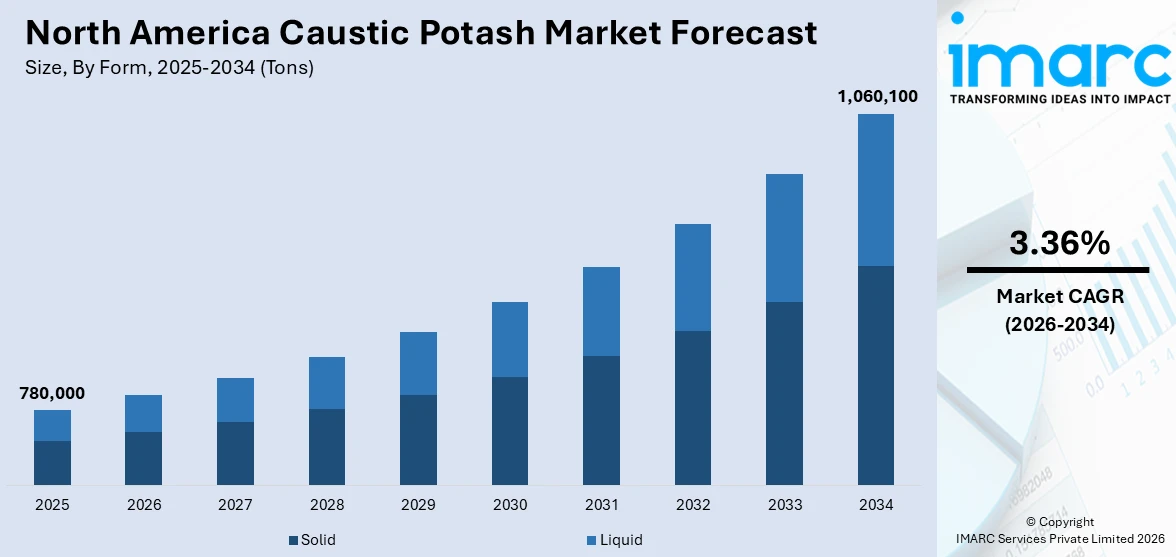
The North America caustic potash market exhibited moderate growth during 2015-2020. Looking forward, IMARC Group expects the market to grow at a CAGR of 3.5% during 2021-2026. Keeping in mind the uncertainties of COVID-19, we are continuously tracking and evaluating the direct as well as the indirect influence of the pandemic on different end use industries. These insights are included in the report as a major market contributor.
Caustic potash (KOH), also known as potassium hydrate and potassium hydroxide, is a strong alkaline chemical. The brine prepared from potassium chloride and water is electrolyzed by mercury/membrane/diaphragm-based cells to produce caustic potash. It is available for commercial purpose in several forms namely flakes, briquettes, crystal and distinctively concentrated solutions. Caustic potash is widely used in the electronics industry and in manufacturing phosphates, soaps and detergents, liquid fertilizers, neutralization agents, etc.
North America is one of the biggest producers of caustic potash in the world. Caustic soda is majorly utilized in the production of potassium carbonate which is primarily used in manufacturing specialty glasses, vat dyeing and textile printing, fire extinguisher powder and in water treatment chemicals. Rapid globalization and new product innovations are expected to increase the demand for caustic potash in the region.
Key Market Segmentation:
IMARC Group provides an analysis of the key trends in each sub-segment of the North America caustic potash market, along with forecasts at the regional and country level from 2021-2026. Our report has categorized the market based on end use, form and grade.
- Key Regions Analysed
- United States
- Canada
- Mexico
- Analysis for Each Country
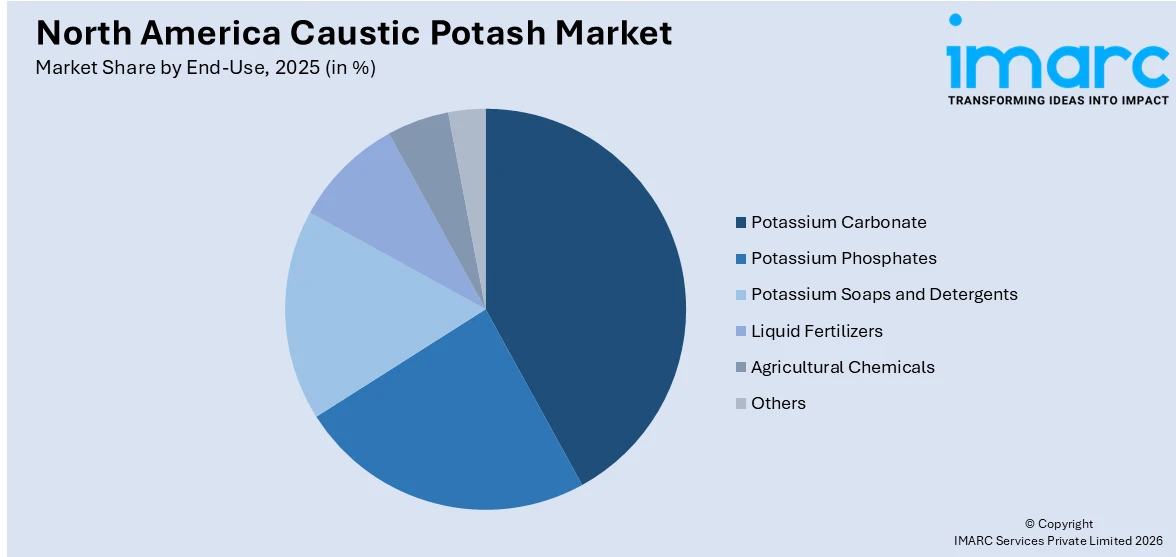
- Market by End-Use
- Potassium Carbonate
- Potassium Phosphates
- Potassium Soaps and Detergents
- Liquid Fertilizers
- Agricultural Chemicals
- Others
- Market by Form
- Market by Grade
- Industrial
- Reagent
- Pharma
- Value Chain Analysis
- Key Drivers and Challenges
- Porters Five Forces Analysis
- PESTEL Analysis
- Government Regulations
- Competitive Landscape
- Competitive Structure
- Key Player Profiles
IMARC Group’s latest report provides a deep insight into the North America caustic potash market covering all its essential aspects. This ranges from macro overview of the market to micro details of the industry performance, recent trends, key market drivers and challenges, SWOT analysis, Porter’s five forces analysis, value chain analysis, etc. This report is a must-read for entrepreneurs, investors, researchers, consultants, business strategists, and all those who have any kind of stake or are planning to foray into the North America caustic potash market in any manner.
Report Coverage:
Report Features |
Details |
---|
Base Year of the Analysis |
2020 |
Historical Period |
2015-2020 |
Forecast Period |
2021-2026 |
Units |
‘000 Tons |
Segment Coverage |
End Use, Form, Grad, Country |
Countries Covered |
United States, Canada, Mexico |
Customization Scope |
10% Free Customization |
Report Price and Purchase Option |
Single User License $ 2499
Five User License $ 3499
Corporate License $ 4499 |
Post-Sale Analyst Support |
10-12 Weeks |
Delivery Format |
PDF and Excel through Email (We can also provide the editable version of the report in PPT/Word format on special request) |
Key Questions Answered in This Report:
- How has the North America caustic potash market performed so far and how will it perform in the coming years?
- What are the key regions in the North America caustic potash market?
- What has been the impact of COVID-19 on the North America caustic potash market?
- What is the breakup of the North America caustic potash market on the basis of end use?
- What is the breakup of the North America caustic potash market on the basis of form?
- What is the breakup of the North America caustic potash market on the basis of grade?
- What are the various stages in the value chain of the North America caustic potash industry?
- What are the key driving factors and challenges in the North America caustic potash industry?
- What is the structure of the North America caustic potash industry and who are the key players?
- What is the degree of competition in the North America caustic potash industry?
- What are the profit margins in the North America caustic potash industry?
1 Preface
2 Scope and Methodology
2.1 Objectives of the Study
2.2 Stakeholders
2.3 Data Sources
2.3.1 Primary Sources
2.3.2 Secondary Sources
2.4 Market Estimation
2.4.1 Bottom-Up Approach
2.4.2 Top-Down Approach
2.5 Forecasting Methodology
3 Executive Summary
4 Introduction
4.1 Overview
4.2 Key Industry Trends
5 Global Caustic Potash Market
5.1 Market Performance
5.2 Market Breakup by End Use
5.3 Market Breakup by Form
5.4 Market Breakup by Grade
5.5 Market Breakup by Region
5.6 Market Forecast
6 North America Caustic Potash Market
6.1 Market Performance
6.2 Impact of COVID-19
6.3 Market Forecast
7 North America Caustic Potash Market: Breakup by End Use
7.1 Potassium Carbonate
7.2 Potassium Phosphates
7.3 Potassium Soaps and Detergents
7.4 Liquid Fertilizers
7.5 Agricultural Chemicals
7.6 Others
8 North America Caustic Potash Market: Breakup by Form
8.1 Solid
8.2 Liquid
9 North America Caustic Potash Market: Breakup by Grade
9.1 Industrial
9.2 Reagent
9.3 Pharma
10 North America Caustic Potash Market: Breakup by Country
10.1 United States
10.1.1 Historical Market Trends
10.1.2 Market Breakup by End Use
10.1.3 Market Breakup by Form
10.1.4 Market Breakup by Grade
10.1.5 Market Forecast
10.2 Canada
10.2.1 Historical Market Trends
10.2.2 Market Breakup by End Use
10.2.3 Market Breakup by Form
10.2.4 Market Breakup by Grade
10.2.5 Market Forecast
10.3 Mexico
10.3.1 Historical Market Trends
10.3.2 Market Breakup by End Use
10.3.3 Market Breakup by Form
10.3.4 Market Breakup by Grade
10.3.5 Market Forecast
11 SWOT Analysis
11.1 Overview
11.2 Strengths
11.3 Weaknesses
11.4 Opportunities
11.5 Threats
12 Value Chain Analysis
12.1 Overview
12.2 Raw Material Procurement
12.3 Manufacturing
12.4 Distribution
12.5 Exports
12.6 End-Use
13 Porter’s Five Forces Analysis
13.1 Overview
13.2 Bargaining Power of Buyers
13.3 Bargaining Power of Suppliers
13.4 Degree of Rivalry
13.5 Threat of New Entrants
13.6 Threat of Substitutes
14 Price Analysis
15 Competitive Landscape
15.1 Market Structure
15.2 Key Players
15.3 Profiles of Key Players
List of Figures
Figure 1: Global: Caustic Potash Market: Sales Value (in Million Tons), 2015-2020
Figure 2: Global: Caustic Potash Market: Breakup by End Use (in %), 2020
Figure 3: Global: Caustic Potash Market: Breakup by Form (in %), 2020
Figure 4: Global: Caustic Potash Market: Breakup by Grade (in %), 2020
Figure 5: Global: Caustic Potash Market: Breakup by Region (in %), 2020
Figure 6: Global: Caustic Potash Market Forecast: Sales Value (in Million Tons), 2021-2026
Figure 7: North America: Caustic Potash Market: Volume Trends (in ‘000 Tons), 2015-2020
Figure 8: North America: Caustic Potash Market Forecast: Volume Trends (in ‘000 Tons), 2021-2026
Figure 9: North America: Caustic Potash Market: Breakup by End Use (in %), 2020
Figure 10: North America: Caustic Potash (Potassium Carbonate) Market: Volume Trends (in ‘000 Tons), 2015 & 2020
Figure 11: North America: Caustic Potash (Potassium Carbonate) Market Forecast: Volume Trends (in ‘000 Tons), 2021-2026
Figure 12: North America: Caustic Potash (Potassium Phosphates) Market: Volume Trends (in ‘000 Tons), 2015 & 2020
Figure 13: North America: Caustic Potash (Potassium Phosphates) Market Forecast: Volume Trends (in ‘000 Tons), 2021-2026
Figure 14: North America: Caustic Potash (Potassium Soaps and Detergents) Market: Volume Trends (in ‘000 Tons), 2015 & 2020
Figure 15: North America: Caustic Potash (Potassium Soaps and Detergents) Market Forecast: Volume Trends (in ‘000 Tons), 2021-2026
Figure 16: North America: Caustic Potash (Liquid Fertilizers) Market: Volume Trends (in ‘000 Tons), 2015 & 2020
Figure 17: North America: Caustic Potash (Liquid Fertilizers) Market Forecast: Volume Trends (in ‘000 Tons), 2021-2026
Figure 18: North America: Caustic Potash (Agricultural Chemicals) Market: Volume Trends (in ‘000 Tons), 2015 & 2020
Figure 19: North America: Caustic Potash (Agricultural Chemicals) Market Forecast: Volume Trends (in ‘000 Tons), 2021-2026
Figure 20: North America: Caustic Potash (Other End-Uses) Market: Volume Trends (in ‘000 Tons), 2015 & 2020
Figure 21: North America: Caustic Potash (Other End-Uses) Market Forecast: Volume Trends (in ‘000 Tons), 2021-2026
Figure 22: North America: Caustic Potash Market: Breakup by Form (in %), 2020
Figure 23: North America: Caustic Potash (Solid) Market: Volume Trends (in ‘000 Tons), 2015 & 2020
Figure 24: North America: Caustic Potash (Solid) Market Forecast: Volume Trends (in ‘000 Tons), 2021-2026
Figure 25: North America: Caustic Potash (Liquid) Market: Volume Trends (in ‘000 Tons), 2015 & 2020
Figure 26: North America: Caustic Potash (Liquid) Market Forecast: Volume Trends (in ‘000 Tons), 2021-2026
Figure 27: North America: Caustic Potash Market: Breakup by Grade (in %), 2020
Figure 28: North America: Caustic Potash (Industrial) Market: Volume Trends (in ‘000 Tons), 2015 & 2020
Figure 29: North America: Caustic Potash (Industrial) Market Forecast: Volume Trends (in ‘000 Tons), 2021-2026
Figure 30: North America: Caustic Potash (Reagent) Market: Volume Trends (in ‘000 Tons), 2015 & 2020
Figure 31: North America: Caustic Potash (Reagent) Market Forecast: Volume Trends (in ‘000 Tons), 2021-2026
Figure 32: North America: Caustic Potash (Pharma) Market Forecast: Volume Trends (in ‘000 Tons), 2021-2026
Figure 33: North America: Caustic Potash (Pharma) Market: Volume Trends (in ‘000 Tons), 2015 & 2020
Figure 34: North America: Caustic Potash Market: Breakup by Country (in %), 2020
Figure 35: United States: Caustic Potash Market: Volume Trends (in ‘000 Tons), 2015-2020
Figure 36: United States: Caustic Potash Market: Breakup by End Use (in %), 2020
Figure 37: United States: Caustic Potash Market: Breakup by Form (in %), 2020
Figure 38: United States: Caustic Potash Market: Breakup by Grade (in %), 2020
Figure 39: United States: Caustic Potash Market Forecast: Volume Trends (in ‘000 Tons), 2021-2026
Figure 40: Canada: Caustic Potash Market: Volume Trends (in ‘000 Tons), 2015-2020
Figure 41: Canada: Caustic Potash Market: Breakup by End Use (in %), 2020
Figure 42: Canada: Caustic Potash Market: Breakup by Form (in %), 2020
Figure 43: Canada: Caustic Potash Market: Breakup by Grade (in %), 2020
Figure 44: Canada: Caustic Potash Market Forecast: Volume Trends (in ‘000 Tons), 2021-2026
Figure 45: Mexico: Caustic Potash Market: Volume Trends (in ‘000 Tons), 2015-2020
Figure 46: Mexico: Caustic Potash Market: Breakup by End Use (in %), 2020
Figure 47: Mexico: Caustic Potash Market: Breakup by Form (in %), 2020
Figure 48: Mexico: Caustic Potash Market: Breakup by Grade (in %), 2020
Figure 49: Mexico: Caustic Potash Market Forecast: Volume Trends (in ‘000 Tons), 2021-2026
Figure 50: North America: Caustic Potash Industry: SWOT Analysis
Figure 51: North America: Caustic Potash Industry: Value Chain Analysis
Figure 52: North America: Caustic Potash Industry: Porter’s Five Forces Analysis
List of Tables
Table 1: North America: Caustic Potash Market: Key Industry Highlights, 2020 and 2026
Table 2: North America: Caustic Potash Market Forecast: Breakup by End Use (in ‘000 Tons), 2021-2026
Table 3: North America: Caustic Potash Market Forecast: Breakup by Form (in ‘000 Tons), 2021-2026
Table 4: North America: Caustic Potash Market Forecast: Breakup by Grade (in ‘000 Tons), 2021-2026
Table 5: North America: Caustic Potash Market Forecast: Breakup by Country (in ‘000 Tons), 2021-2026
Table 6: North America: Caustic Potash Market: Competitive Structure
Table 7: North America: Caustic Potash Market: Key Players