
North America Ink Market Size, Share, Trends and Forecast by Technology, Ink Type, Application, and Country 2026-2034
North America Ink Market Size, Share, Trends & Forecast (2026-2034)
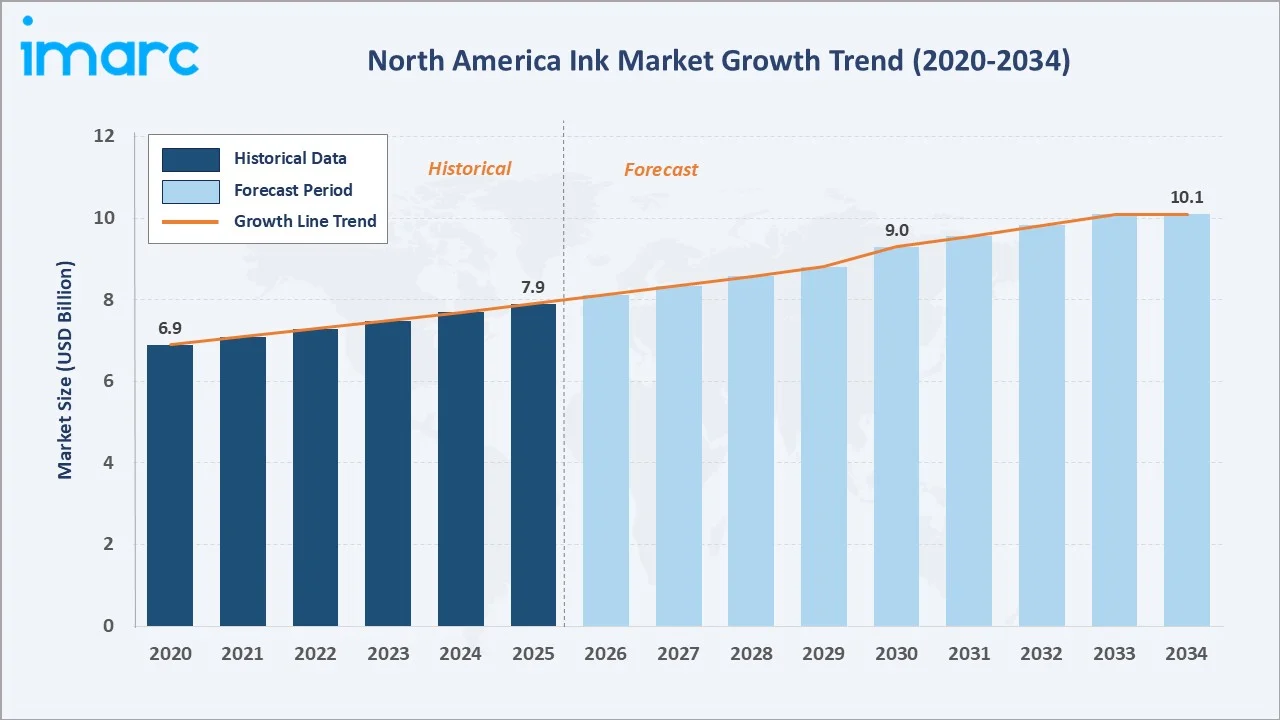
The North America ink market size reached USD 7.9 Billion in 2025 and is projected to reach USD 10.1 Billion by 2034, exhibiting a CAGR of 2.77% during 2026-2034. Rising e-commerce packaging demand, stringent FDA low-migration regulations spurring formulation innovation, and rapid digital printing adoption across commercial and label applications are the primary forces driving market growth.
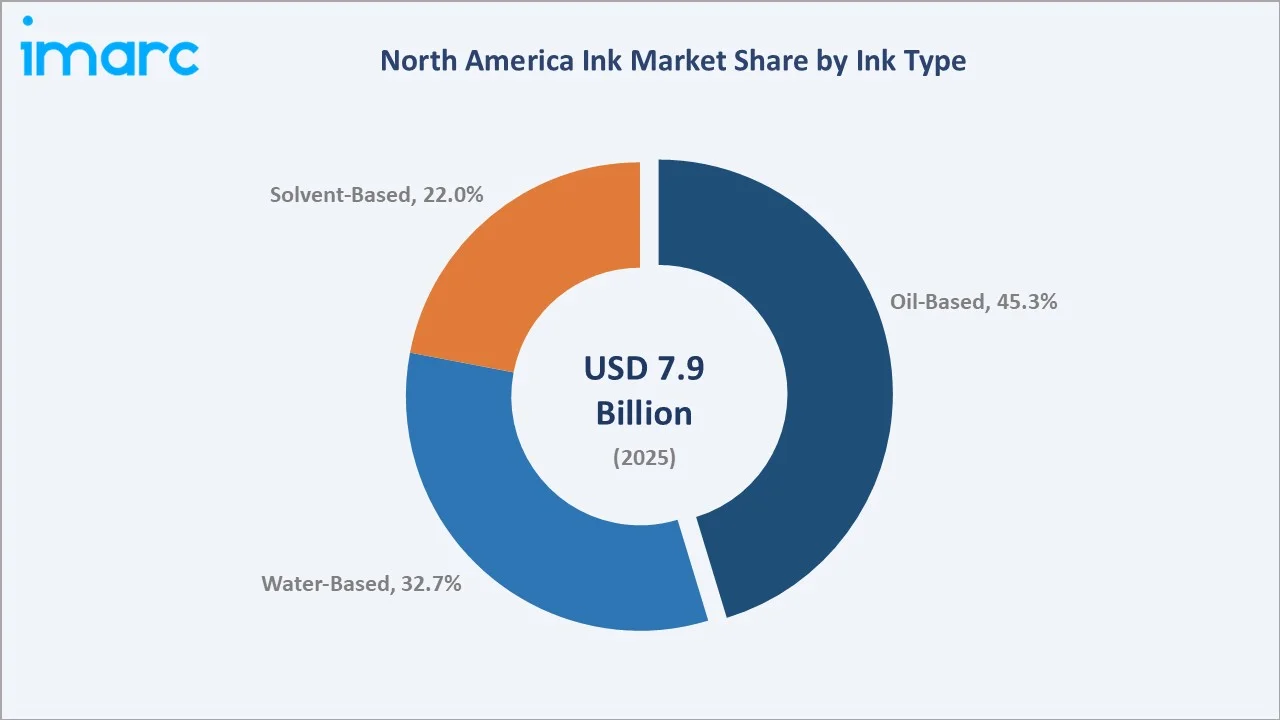
Oil-based ink dominates the type mix at 45.3% in 2025, while labeling and packaging lead the application segment at 39.5%. The United States commands a dominant 68.4% country share in 2025, reflecting its vast and diversified commercial, packaging, and industrial printing base.
Market Snapshot
|
Metric |
Value |
|
Market Size (2025) |
USD 7.9 Billion |
|
Forecast Market Size (2034) |
USD 10.1 Billion |
|
CAGR (2026-2034) |
2.77% |
|
Base Year |
2025 |
|
Historical Period |
2020-2025 |
|
Forecast Period |
2026-2034 |
|
Largest Country |
United States (68.4% share, 2025) |
|
Second Country |
Canada (18.7% share, 2025) |
|
Leading Ink Type |
Oil-Based (45.3%, 2025) |
|
Leading Application |
Labeling and Packaging (39.5%, 2025) |
The North America ink market growth trajectory from 2020 through 2034, with the historical expansion to USD 7.9 Billion in 2025, reflects consistent packaging and commercial printing demand, while the forecast to USD 10.1 Billion captures accelerating digital printing adoption, e-commerce-driven packaging volumes, and regulatory-led water-based and UV-curable ink substitution.
To get more information on this market, Request Sample
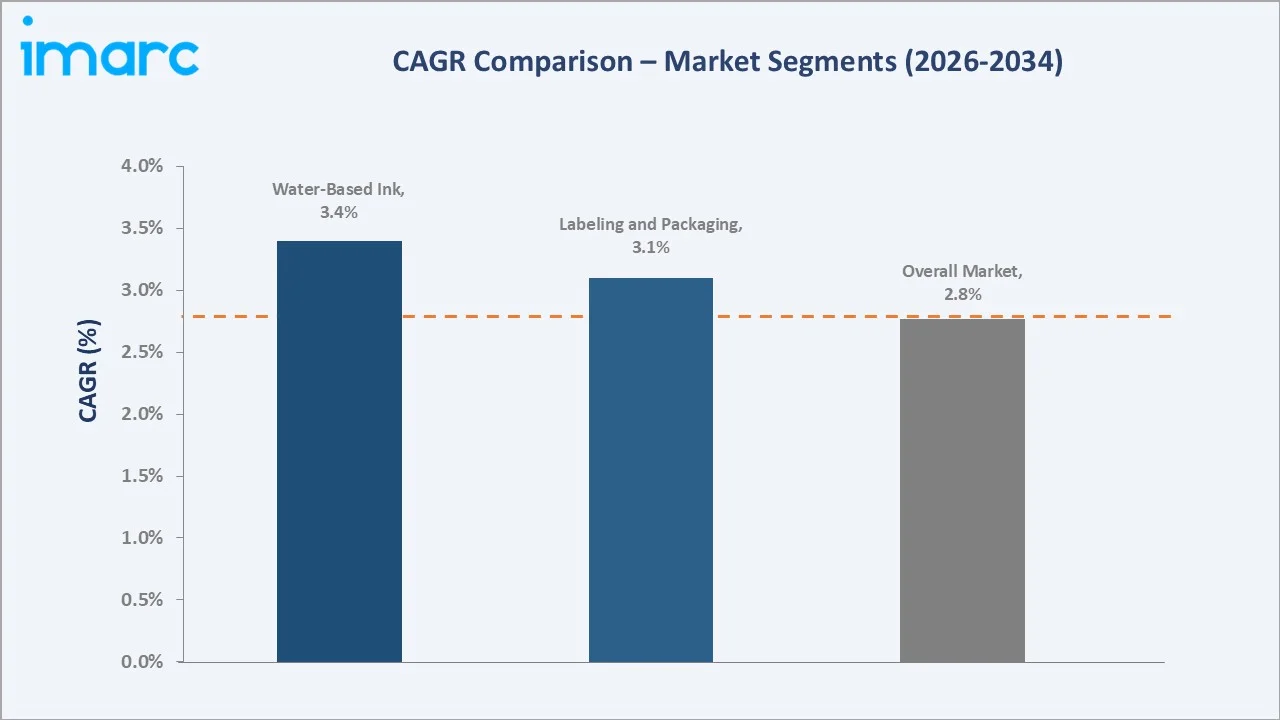
The CAGR trajectories across key ink type, application, and country sub-segments, with water-based ink at ~3.4% CAGR and labeling and packaging applications at ~3.1% CAGR, are the fastest-growing categories within the North America ink industry through 2034.
Executive Summary
The North America ink market is on a sustained growth trajectory from USD 7.9 Billion in 2025 to USD 10.1 Billion by 2034. Ink, a critical consumable for packaging, commercial printing, publishing, and industrial labeling, benefits from the non-discretionary nature of its demand across consumer goods and supply chain operations.
Oil based ink dominates the type mix at 45.3% in 2025, owing to its superior gloss, colour richness, and durability in offset lithographic printing. Water-based ink (32.7%) commands growing preference driven by EPA VOC emission regulations and brand-owner sustainability commitments. Solvent-based ink (22.0%) remains essential in flexographic and gravure packaging applications requiring fast drying and substrate adhesion.
Labeling and Packaging lead application at 39.5% in 2025, driven by e-commerce parcel growth, FDA food-contact compliance labeling mandates, and increasing unit packaging. Commercial Printing (28.6%) and Publishing (18.4%) follow.
The United States commands 68.4%, Canada 18.7%, and Mexico 12.9% of the regional market in 2025.
Key Market Insights
|
Insight |
Data |
|
Largest Ink Type |
Oil Based – 45.3% share (2025) |
|
Second Ink Type |
Water Based – 32.7% share (2025) |
|
Third Ink Type |
Solvent Based – 22.0% share (2025) |
|
Leading Application |
Labeling and Packaging – 39.5% (2025) |
|
Second Application |
Commercial Printing – 28.6% (2025) |
|
Leading Country |
United States – 68.4% revenue share (2025) |
|
Top Companies |
Sun Chemical, Flint Group, Siegwerk Druckfarben AG & Co. KGaA, Wikoff Color Corporation, Sakata INX Corporation |
Key Analytical Observations Expanding on the Above Data:
- Oil-based ink, with 45.3% in 2025, dominates because lithographic offset printing, which relies on oil-based formulations, remains the leading technology in North America for commercial, packaging, and publication applications. Oil-based inks deliver superior colour gamut, gloss levels, and rub resistance on coated substrates, making them the default specification for premium packaging, catalogues, and commercial work.
- Water-based ink at 32.7% is the fastest-growing segment as North American brand owners face mounting pressure from EPA, state-level VOC regulations, and retailer sustainability scorecards to eliminate hydrocarbon solvent emissions. Water-based flexo inks now serve the majority of corrugated, paper bag, and paper-based flexible packaging applications.
- Labeling and Packaging at 39.5% dominance in 2025 reflects the surge in e-commerce fulfilment requiring large quantities of shipping label inks, secondary packaging print, and product identification labels. FDA 21 CFR compliance mandates for food and pharmaceutical package printing have elevated quality standards while sustaining volume.
- The United States at 68.4% reflects hosting the majority of North America's ink manufacturing infrastructure, including major facilities operated by Sun Chemical, INX International, and Flint Group, providing robust domestic supply and short lead-time capability for converters.
North America Ink Market Overview
Ink is a complex chemical formulation available as liquid or paste, produced from pigments, dyes, resins, solvents, lubricants, solubilizers, fluorescents, and surfactants. Printing inks constitute the largest category, applied via lithographic, flexographic, gravure, digital, and letterpress technologies to packaging, commercial print, publishing, and industrial substrates.
The North America ecosystem integrates global chemical raw material suppliers, regional ink formulators, large-format ink manufacturers, specialty chemistry providers, ink distribution networks, and diverse end-use print converters spanning flexible packaging, cartons, labels, newspapers, magazines, and direct mail. NAPIM oversees industry standards and regulatory engagement across this supply chain.
Market Dynamics
To evaluate market opportunities, Request Sample
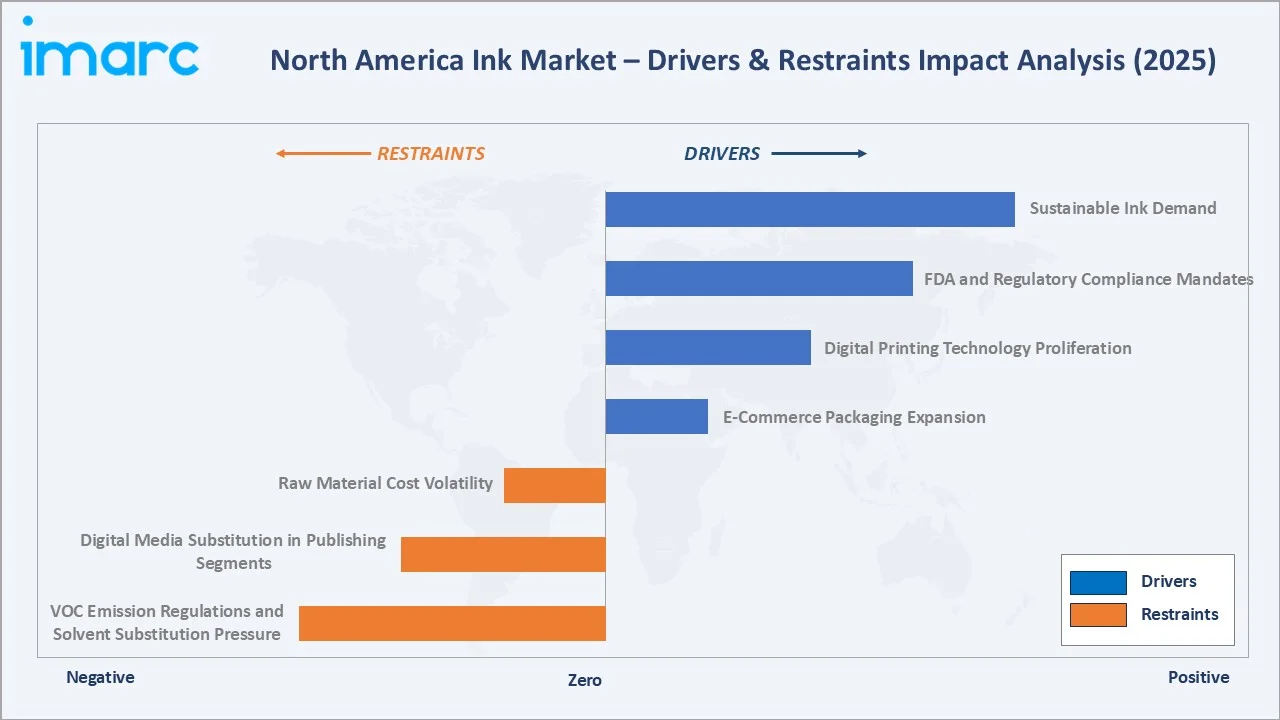
Market Drivers
- E-Commerce Packaging Expansion: US e-commerce sales surpassed USD 1.1 Trillion in 2023, and each transaction generates demand for primary product packaging ink, shipping label ink, and secondary corrugated box print, creating structurally elevated print volumes that sustain ink consumption regardless of analog-to-digital media migration.
- FDA and Regulatory Compliance Mandates: The FDA 21 CFR requirements for indirect food additives and direct food-contact packaging inks compel ink formulation innovation, sustained capital investment in compliant chemistries, and rigorous supply chain qualification audits that create barriers to entry and sustain volume for certified suppliers.
- Digital Printing Technology Proliferation: High-speed inkjet and toner-based digital presses enable short-run, personalized, and variable-data printing at economical unit costs, expanding ink consumption in label, packaging, and direct mail markets that previously could not justify print due to minimum run requirements of conventional presses.
Market Restraints
- VOC Emission Regulations and Solvent Substitution Pressure: The EPA NESHAP standards and state-level air quality regulations impose compliance cost burdens on solvent-based ink users and incentivize capital expenditure in ventilation systems or reformulation toward low-VOC alternatives, compressing margins for traditional solvent ink formulators.
- Digital Media Substitution in Publishing and Newspaper Segments: The ongoing shift of news and advertising to digital platforms has significantly reduced the circulation of printed newspapers and magazines, leading to a decline in demand for lithographic inks across publishing and commercial printing segments. Advertisers are increasingly prioritizing digital channels due to their superior targeting capabilities, real-time performance tracking, and cost efficiency, further diminishing reliance on print media. At the same time, evolving consumer preferences toward instant, online content consumption continue to accelerate the structural decline of traditional print formats.
Market Opportunities
- UV-Curable and LED-UV Ink Technology: LED-UV systems, eliminating ozone emissions and reducing energy consumption substantially versus mercury arc UV, are driving rapid adoption in label, offset, and narrow-web flexo applications, generating a fast-growing premium ink segment were formulation innovation commands price premiums over conventional alternatives.
- Sustainable and Bio-Based Ink Formulations: Brand owner net-zero commitments and retailer sustainability scorecard requirements are creating commercial premium for vegetable-oil-based inks, bio-renewable solvent carriers, and recycled-content pigment systems, with the SGP certification expanding specification requirements for certified sustainable inks.
Market Challenges
- Raw Material Cost Volatility: Fluctuations in petrochemical-based inputs such as resins, solvents, and oils continue to create cost pressures for ink manufacturers, particularly in environments where pricing agreements with customers limit the ability to pass through increases in a timely manner. This creates margin uncertainty and challenges in long-term cost planning. In addition, supply chain disruptions and geopolitical factors can further intensify price instability, making procurement strategies more complex.
- Low-Migration Compliance Complexity: Expanding regulatory standards and brand-specific restrictions on chemical usage are adding complexity to ink formulations and increasing testing and compliance costs, placing greater pressure on smaller suppliers and favoring larger players with dedicated regulatory capabilities. This also leads to longer product development cycles and higher barriers to entry for new formulations. As a result, companies must invest more in regulatory expertise and documentation to maintain market access and customer trust.
Emerging Market Trends
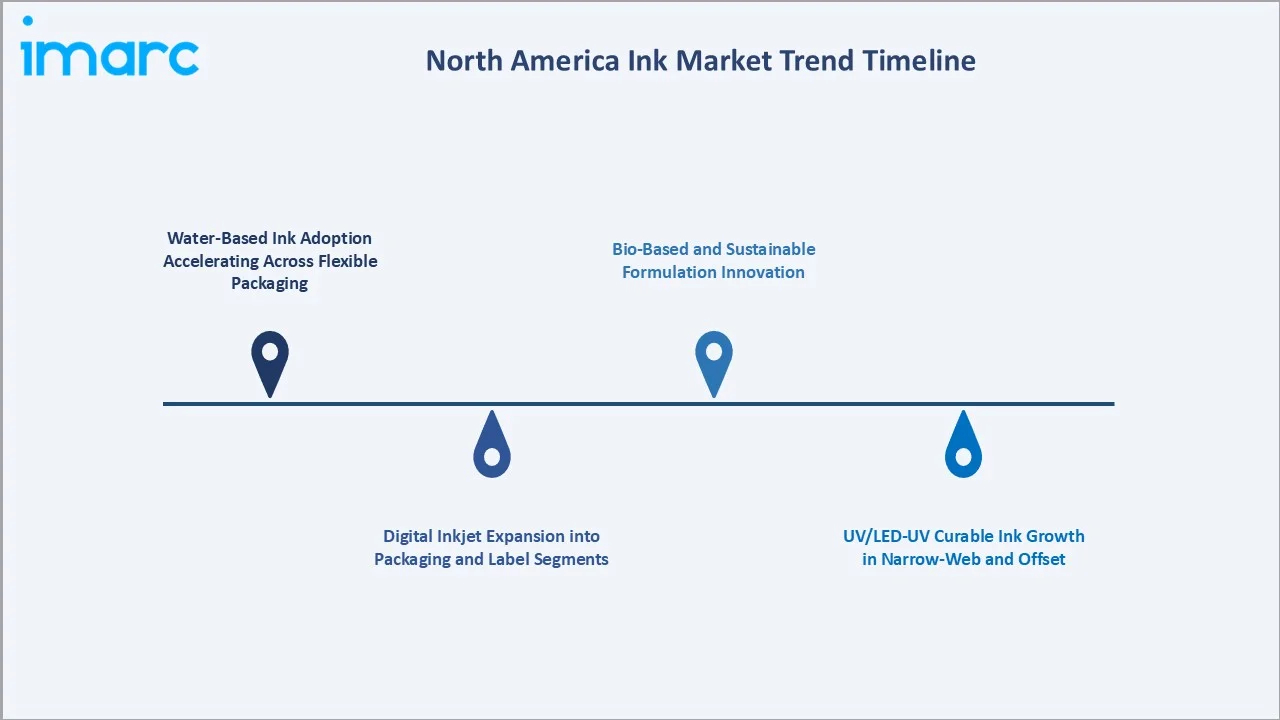
1. Water-Based Ink Adoption Accelerating Across Flexible Packaging
Regulatory pressure from EPA NESHAP standards and brand owner VOC reduction commitments has accelerated water-based flexo ink adoption in corrugated, flexible film, and paper packaging. Formulators have achieved performance parity on adhesion, color gamut, and block resistance, enabling converters to meet sustainability targets without sacrificing print quality benchmarks.
2. Digital Inkjet Expansion into Packaging and Label Segments
High-speed single-pass inkjet presses are penetrating label, flexible packaging, and carton printing, driving demand for aqueous inkjet ink formulations engineered for challenging substrates. Digital press installations in North America exceeded prior decade totals, with packaging applications representing the fastest growth category across the region.
3. UV/LED-UV Curable Ink Growth in Narrow-Web and Offset
LED-UV technology, eliminating ozone emissions and reducing energy cost substantially versus mercury arc, has achieved rapid adoption in narrow-web label and sheet-fed offset applications. UV inkjet for beverage can decoration, exemplified by INX International's 2025 launch of UV inkjet grades, is opening a significant new decorative packaging ink segment.
4. Bio-Based and Sustainable Formulation Innovation
The 2024-2026 period has seen accelerated commercialization of bio-based resin systems derived from rosin, tall oil, and soy to replace petroleum resin carriers in news and offset inks. SGP-certified formulations are gaining specification preference in US government printing procurement, creating a commercially significant and growing green ink segment.
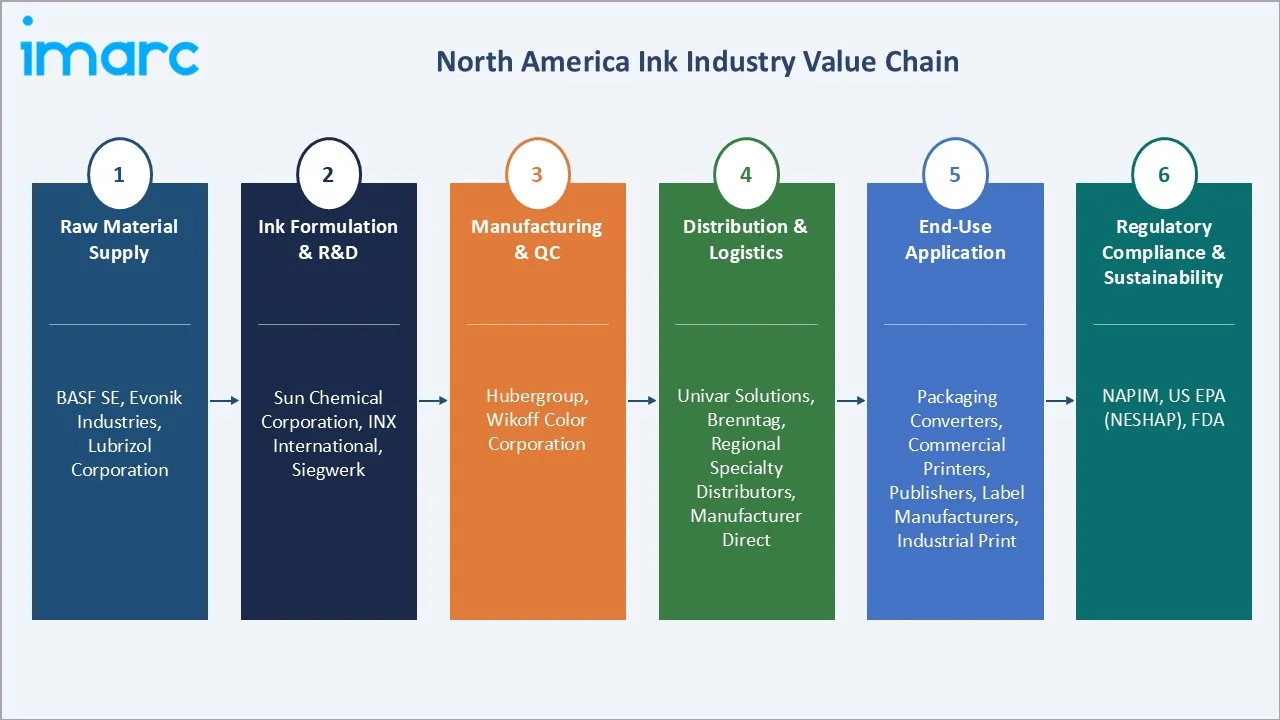
Industry Value Chain Analysis
The North America ink value chain spans six stages from raw chemical input through end-use application and recycling compliance. Ink formulation and specialty chemistry capture the highest value-add margins, while regulatory compliance management and digital technology integration generate competitive advantages that favor large, well-capitalized manufacturers.
|
Stage |
Key Players / Examples |
|
Raw Material Supply |
BASF SE, Evonik Industries, Lubrizol Corporation |
|
Ink Formulation & R&D |
Sun Chemical Corporation, INX International, Siegwerk |
|
Manufacturing & QC |
Hubergroup, Wikoff Color Corporation |
|
Distribution & Logistics |
Univar Solutions, Brenntag, Regional specialty ink distributors, manufacturer direct |
|
End-Use Application |
Packaging converters, commercial printers, publishers, label manufacturers, and industrial print |
|
Regulatory Compliance & Sustainability Certification |
NAPIM, US EPA (NESHAP), FDA |
Integrated ink manufacturers with captive resin polymerization, pigment dispersion capabilities, and global raw material procurement contracts achieve lower material cost bases than processors relying entirely on spot market purchases. This vertical integration is a meaningful competitive advantage in commodity ink segments were converters benchmark annual price reductions.
Technology Landscape in the North America Ink Industry
Lithographic and Offset Ink Technology
Conventional heatset web offset and coldset newsprint inks use mineral oil and vegetable oil resin varnish systems with carbon black and organic pigments, printing at speeds exceeding 1,000 feet per minute. Sheetfed offset lithographic inks use highly viscous, high-tack alkyd/phenolic resin varnishes optimized for rapid oxidative setting on coated paper at press speeds up to 18,000 sheets per hour.
UV/LED-UV and EB Curable Technology
UV-curable inks polymerize instantly upon exposure to UV or LED-UV light, achieving immediate tack-free surfaces that enable inline finishing without drying ovens. Electron beam (EB) curable inks require no photo initiators, eliminating migration risk in food packaging and providing the regulatory gold standard for food-contact ink safety.
Digital Inkjet and Toner Technology
Piezoelectric drop-on-demand inkjet technology now covers substrate types from absorbent paper to non-porous films and metals, with ink formulations engineered for each substrate chemistry. Water-based inkjet inks account for most of the digital print volume, with UV-curable inkjet expanding in industrial, label, and direct-to-shape applications.
Market Segmentation Analysis
The report covers the following segments:
|
Segment Category |
Leading Segment |
Market Share |
Year |
| Technology | Lithographic | 🔒 |
2025 |
| Ink Type | Oil Based | 45.3% |
2025 |
| Application | Labeling and Packaging | 39.5% |
2025 |
| Country | United States | 68.4% |
2025 |

By Ink Type
Oil-based ink commands a 45.3% majority share in 2025 due to its fundamental performance advantages in lithographic offset printing, the dominant printing technology in North America for commercial, packaging, and publication applications. Heatset web offset and sheetfed offset rely on oil-based formulations for their rheological properties, tack profiles, and drying mechanisms on coated substrates.
To access detailed market analysis, Request Sample
Water-based ink at 32.7% in 2025, growing fastest, reflects the structural shift in flexographic packaging printing, where brand owners and converters have collectively committed to water-based reformulation under EPA compliance programs and retailer sustainability requirements.
Solvent-based ink (22.0%) remains essential in gravure and solvent flexo for demanding flexible film packaging substrates where water-based alternatives have not yet achieved full performance equivalence.
By Application
Labeling and packaging dominate at 39.5% in 2025, driven by e-commerce parcel growth, FDA food-contact labeling compliance requirements, FMCG product proliferation, and the conversion of bulk food formats to individual unit packs. Each SKU multiplication event generates additional label ink consumption across primary label, secondary carton, and shipping label applications.
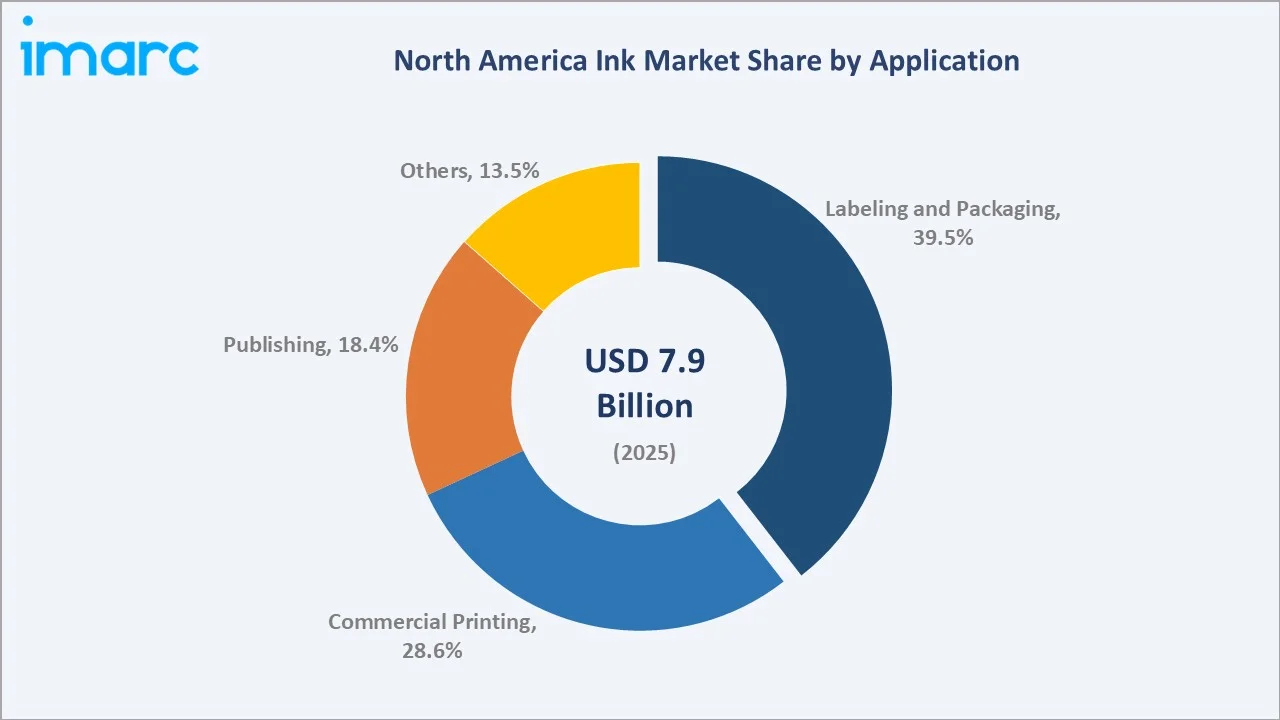
Commercial printing at 28.6% in 2025 encompasses direct mail, promotional print, catalogues, point-of-sale displays, and folding cartons, segments that have demonstrated resilience through premium tactile differentiation and targeted campaign effectiveness.
Publishing at 18.4% faces secular headwinds from digital media substitution but is partially offset by premium book printing growth. Others (13.5%) include industrial marking, security printing, and functional conductive inks for electronics.
Regional Market Insights
|
Country |
Share (2025) |
Key Growth Drivers |
|
United States |
68.4% |
E-commerce packaging boom; FDA compliance-driven ink innovation; large commercial print base |
|
Canada |
18.7% |
Bilingual labeling regulations; growing food & beverage packaging; digital printing expansion |
|
Mexico |
12.9% |
Nearshoring manufacturing growth; expanding FMCG sector; rising flexible packaging demand |
The United States, at 68.4% in 2025, hosts the largest and most diversified ink manufacturing and consuming market in North America. The market growth is supported by advanced R&D centers, and the US FDA's strict food-contact ink regulations have created a premium compliance-driven market segment that sustains higher formulation value.
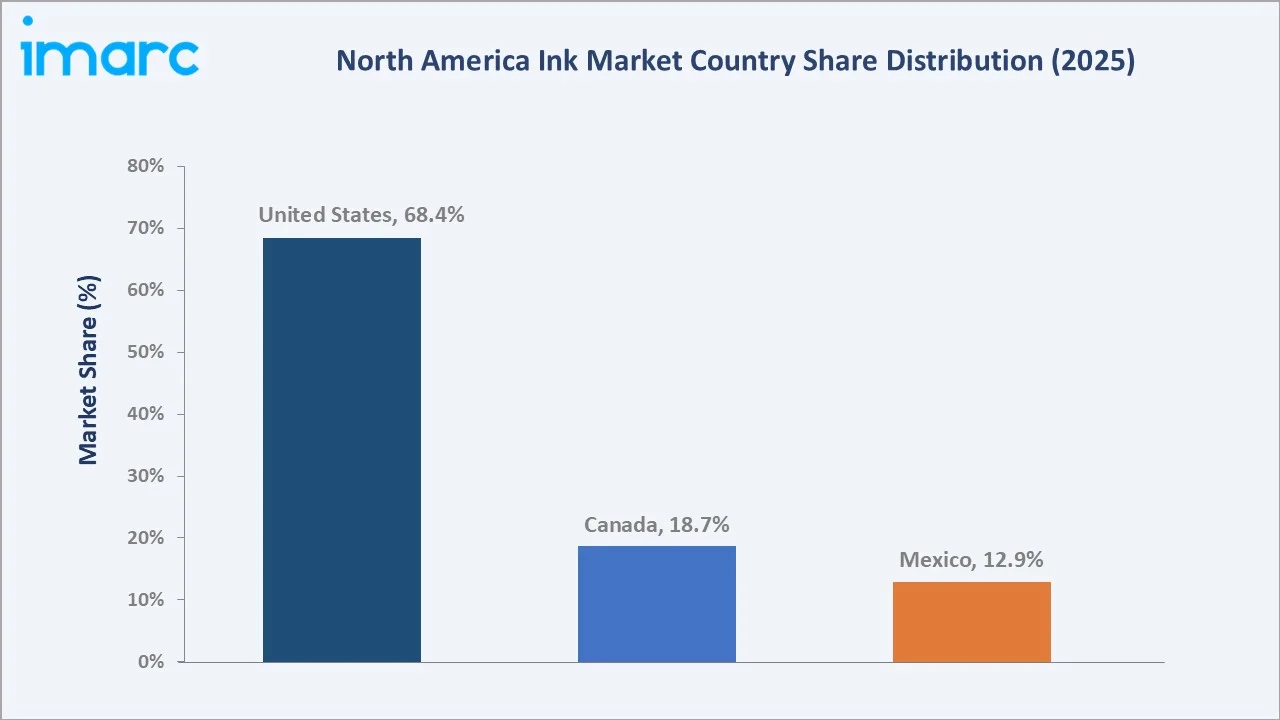
Canada, with 18.7% in 2025, requires bilingual English-French labeling compliance under the Consumer Packaging and Labelling Act, sustaining distinctive label ink demand. The country's growing food manufacturing sector and pharmaceutical packaging base sustain consistent ink consumption growth aligned with the overall market CAGR.
Mexico, with 12.9% in 2025, is experiencing above-average growth driven by nearshoring of manufacturing operations, expanding the country's FMCG and automotive parts packaging requirements. Mexico's flexible packaging converter capacity additions and growing modern retail format expansion support ink consumption growth above the regional average.
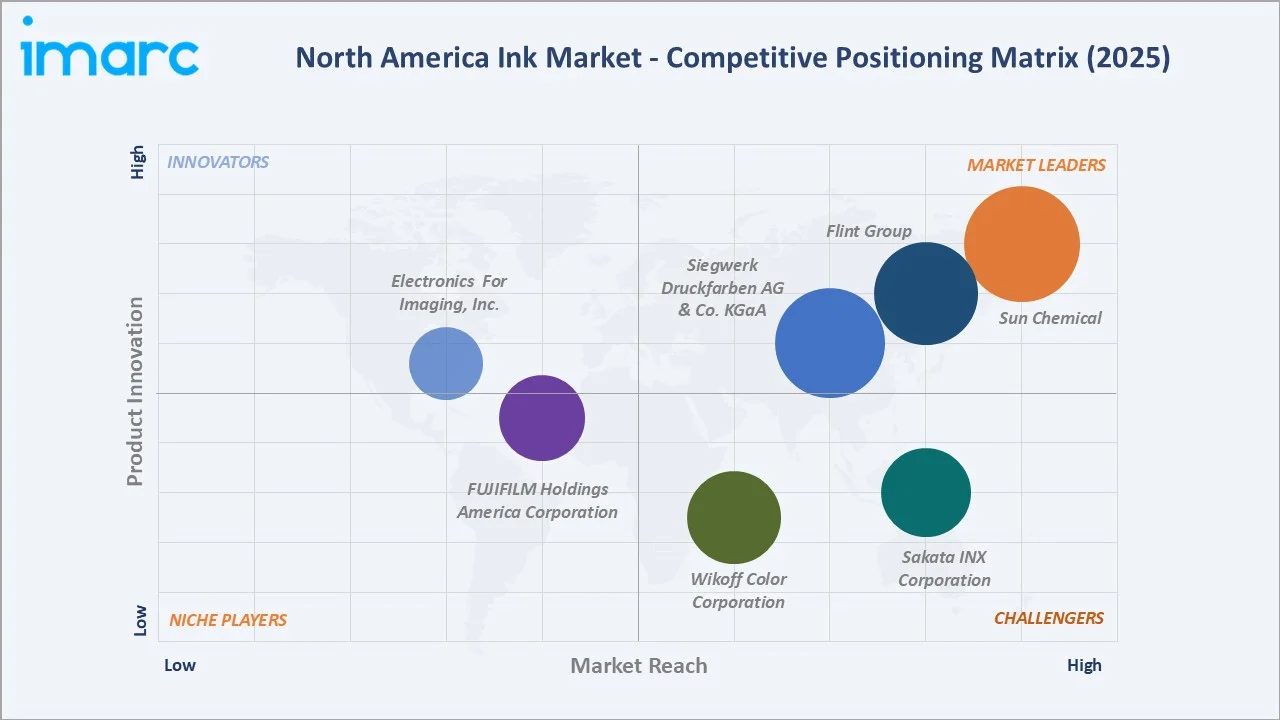
Competitive Landscape
The North America ink market is moderately fragmented, with a small number of large global ink manufacturers commanding dominant positions in major technology and application segments, while a long tail of regional and specialty formulators serves niche application and geographic markets.
|
Company Name |
Key Products |
Position |
Strategic Focus |
|
Sun Chemical |
Textile inks, SunHytek, SunPoly Screen Printing Inks, Pad Printing Inks, Edible Inks |
Leader |
Broadest North America portfolio; sustainability-led innovation; largest R&D investment |
|
Flint Group |
Flexo, Gravure, Offset Inks |
Leader |
Global backward integration; strong packaging converter relationships; price competitive |
|
Siegwerk Druckfarben AG & Co. KGaA |
Packaging Inks, Low-Migration |
Leader |
Food-contact specialization; brand owner approval lists; European heritage |
|
Wikoff Color Corporation |
Flexo, Gravure, Offset |
Challenger |
US mid-market specialist; customer service differentiation; distributor-friendly |
|
Sakata INX Corporation |
Flexo, Digital, Gravure |
Challenger |
Digital ink innovation; flexographic packaging strength; responsive supply chain |
|
FUJIFILM Holdings America Corporation |
Digital Inkjet, UV-Curable |
Emerging |
Digital press ecosystem integration; inkjet for wide-format and label applications |
|
Electronics For Imaging, Inc. |
Digital Inkjet, UV |
Emerging |
OEM digital ink model; industrial inkjet expansion |
Key players include Sun Chemical, Flint Group, Siegwerk Druckfarben AG & Co. KGaA, Wikoff Color Corporation, Sakata INX Corporation, FUJIFILM Holdings America Corporation, Electronics For Imaging, Inc., and others.
Key Company Profiles
Sun Chemical
Sun Chemical is the largest producer of printing inks and coatings in North America, operating as a subsidiary of DIC Corporation of Japan, serving packaging, commercial, and industrial print markets with the broadest product portfolio in the region.
- Product Portfolio: Textile inks, SunHytek, SunPoly Screen Printing Inks, Pad Printing Inks, Edible Inks.
- Recent Developments: In April 2025, Sun Chemical announced the launch of its SunPak PowerPace range, a new generation of vegetable oil-based sheetfed offset inks designed for paper and board packaging applications. The technology is engineered to enhance productivity on high-speed presses, offering improved color stability, faster drying, and greater press efficiency.
- Strategic Focus: Sun Chemical's strategy focuses on leading the sustainability transition through its SunEco platform of bio-based, low-VOC, and low-migration formulations, while leveraging DIC Group's global raw material procurement scale to maintain cost leadership.
Flint Group
Flint Group is one of the world's largest printing ink manufacturers, with a strong North American presence across packaging, commercial, and narrow-web label inks, operating manufacturing facilities throughout the United States serving flexo, gravure, and offset markets.
- Product Portfolio: Flexographic packaging inks, gravure inks, offset inks, UV/LED-UV curable inks, narrow-web label inks, and digital printing consumables.
- Recent Developments: In February 2026, Flint Group announced that its nitrocellulose-free (NC-free) ink technologies for flexible packaging have received RecyClass Technology Approval, confirming their compatibility with established polyethylene recycling streams. The approved ink systems are designed for flexographic and gravure printing and demonstrate enhanced stability under the high temperatures encountered during mechanical recycling, supporting improved recyclate quality. This certification provides independent validation that these inks do not negatively impact the recycling process, enabling converters and brand owners to adopt more circular packaging solutions with greater confidence.
- Strategic Focus: Flint Group leverages backward resin integration and global procurement to buffer raw material cost volatility, while differentiating through technical service depth and fast-response supply reliability for mid-market converters.
Siegwerk Druckfarben AG & Co. KGaA
Siegwerk is a leading global ink manufacturer with specialization in food-contact compliant packaging inks, low-migration formulations, and brand owner approval list management, with a strong presence in the North American food and pharmaceutical packaging ink segment.
- Product Portfolio: Low-migration food-contact packaging inks, UV-curable inks, water-based flexo inks, gravure packaging inks, and EFC (Emerging Food Contact) compliant formulations.
- Recent Developments: In April 2026, Siegwerk introduced its UniLEAF solution, an innovative acrylic-free ink system specifically developed for paper and board packaging applications, reinforcing its focus on advancing sustainable packaging technologies. The new solution eliminates the use of acrylic binders, instead incorporating alternative raw materials that contribute to a lower environmental footprint while maintaining high-performance printing characteristics.
- Strategic Focus: Siegwerk's North America strategy centers on premium positioning in regulated food-contact and pharmaceutical packaging applications, where its global compliance database and restricted substance management infrastructure provide a defensible advantage.
Market Concentration Analysis
The North America ink market is moderately concentrated at the regional level, with three companies, Sun Chemical, Flint Group, and INX International, collectively estimated to hold approximately 50-55% of total North American printing ink revenue. This concentration reflects the capital intensity of full-service ink formulation infrastructure and the certification burden of food-contact compliance.
Consolidation through merger and acquisition has been active in the sector, with large global ink manufacturers acquiring regional specialty formulators to expand geographic reach and add proprietary chemistry. Private equity interest in ink distribution consolidation is emerging, reflecting the attractive recurring revenue characteristics of the consumable ink supply model.
Investment & Growth Opportunities
Fastest-Growing Segments
Water based ink at ~3.4% CAGR through 2034 is the highest-growth type segment, driven by regulatory VOC reduction mandates and packaging converter transitions from solvent-based systems. Labeling and Packaging at ~3.1% CAGR represents the broadest-based growth opportunity, anchored by e-commerce parcel growth and FDA compliance requirements.
Emerging Markets
Mexico at ~3.0% CAGR is the fastest-growing country within North America for ink through 2034. Nearshoring manufacturing investment, growing FMCG sector, and expanding modern retail format penetration are creating large-scale packaging ink procurement from a market with historically lower per-capita ink consumption versus US benchmarks.
Venture & Investment Trends
Venture and corporate investment in bio-based ink chemistries, LED-UV curing system integration, and digital inkjet ink platforms for packaging has accelerated since 2022. SGP-certified sustainable ink programs are generating measurable commercial premium in US government and institutional print procurement, incentivizing continued investment in green ink formulation innovation.
Future Market Outlook (2026-2034)
The North America ink market is forecast to expand from USD 7.9 Billion in 2025 to USD 10.1 Billion by 2034 at a CAGR of 2.77%, adding USD 2.2 Billion in incremental annual market value over the forecast period. This sustained growth reflects the market's packaging-linked, non-discretionary demand characteristics alongside digital printing technology expansion.
Three structural forces will most significantly shape the North America ink landscape through 2034. Regulatory-driven water-based and UV-curable ink substitution will continue compressing solvent-based volumes while driving formulation premiumization. E-commerce-led packaging volume growth will sustain labeling and packaging ink consumption as the largest and most resilient end-use segment. Digital inkjet platform penetration will expand ink consumption into previously short-run or unprinted packaging substrates while reshaping competitive dynamics.
Research Methodology
Primary Research
Primary research encompassed structured interviews with North America ink industry stakeholders, including senior commercial managers at major ink manufacturers, packaging converter procurement specialists, brand owner packaging engineers, NAPIM committee members, and print technology OEM representatives. Primary data validated market sizing, ink type and application segment shares, country demand estimates, and technology adoption timelines.
Secondary Research
Key secondary sources include NAPIM Industry Statistics reports, EPA NESHAP compliance data, FDA food-contact ink regulatory filings, US Census Bureau printing industry data, AICC corrugated packaging volume data, Flexible Packaging Association market statistics, TAPPI publication print run data, and trade publications including Ink World, American Printer, and Packaging Digest.
Forecasting Models
Market size estimations and growth projections were derived using top-down and bottom-up forecasting models incorporating printing industry volume indices, packaging converter output data, GDP growth rates, e-commerce penetration trajectories, and regulatory substitution timelines. Scenario analysis was performed to account for raw material cost volatility and technology adoption timing uncertainty.
North America Ink Market Report Coverage:
| Report Features | Details |
|---|---|
| Base Year of the Analysis | 2025 |
| Historical Period | 2020-2025 |
| Forecast Period | 2026-2034 |
| Units | Billion USD |
| Scope of the report |
Exploration of Historical Trends and Market Outlook, Industry Catalysts and Challenges, Segment-Wise Historical and Future Market Assessment:
|
| Technologies Application | Lithographic, Flexographic, Gravure, Digital, Letterpress, Others |
| Ink Types Application | Oil Based, Solvent Based, Water Based |
| Applications Application | Labeling and Packaging, Commercial Printing, Publishing, Others |
| Countries Application | United States, Canada, Mexico |
| Companies Covered | Sun Chemical, Flint Group, Siegwerk Druckfarben AG & Co. KGaA, Wikoff Color Corporation, Sakata INX Corporation, FUJIFILM Holdings America Corporation, Electronics For Imaging, Inc., etc. |
| Customization Scope | 10% Free Customization |
| Post-Sale Analyst Support | 10-12 Weeks |
| Delivery Format | PDF and Excel through Email (We can also provide the editable version of the report in PPT/Word format on special request) |
Frequently Asked Questions About the North America Ink Market Report
The North America ink market reached USD 7.9 Billion in 2025, driven by e-commerce packaging demand, FDA compliance-driven ink innovation, and digital printing expansion across commercial and label segments.
The market is projected to grow at a CAGR of 2.77% from 2026 to 2034, reaching USD 10.1 Billion by 2034, supported by packaging volume growth, water-based ink regulatory substitution, and digital printing technology proliferation.
Oil based ink leads with a 45.3% share in 2025, owing to its dominant position in lithographic offset printing. Water based ink is the fastest growing type at approximately 3.4% CAGR through 2034, driven by EPA VOC regulations and sustainability mandates.
Labeling and packaging is the largest application at 39.5% in 2025, driven by e-commerce fulfilment volumes, FDA food-contact labeling mandates, and FMCG product proliferation requiring extensive unit-level packaging and label printing.
The United States commands a 68.4% share in 2025, reflecting its vast and diversified printing industry hosting over 90% of regional ink manufacturing capacity, with the largest commercial, packaging, and industrial print-consuming base in North America.
The leading companies include Sun Chemical, Flint Group, Siegwerk Druckfarben AG & Co. KGaA, Wikoff Color Corporation, Sakata INX Corporation, FUJIFILM Holdings America Corporation, Electronics For Imaging, Inc., and others.
EPA NESHAP VOC emission regulations, state-level air quality mandates in California and the Northeast, brand owner sustainability scorecard requirements from major retailers, and consumer demand for environmentally responsible packaging are the primary forces accelerating water-based ink adoption across corrugated, flexible, and paper packaging converters.
Digital printing is expanding ink consumption by enabling economical short-run, personalized, and variable-data printing in label and packaging segments that previously relied solely on conventional presses. UV inkjet for beverage cans, digital label presses, and high-speed inkjet packaging are the three highest-growth digital ink applications through 2034.
Need more help?
- Speak to our experienced analysts for insights on the current market scenarios.
- Include additional segments and countries to customize the report as per your requirement.
- Gain an unparalleled competitive advantage in your domain by understanding how to utilize the report and positively impacting your operations and revenue.
- For further assistance, please connect with our analysts.
 Request Customization
 Speak to an Analyst
 Request Brochure
 Inquire Before Buying
Benefits of Customization
- Personalize this research
- Triangulate with your data
- Get data as per your format and definition
- Gain a deeper dive into a specific application, geography, customer, or competitor
- Any level of personalization
Get in Touch With Us
UNITED STATES
Phone: +1-201-971-6302
INDIA
Phone: +91-120-433-0800
UNITED KINGDOM
Phone: +44-753-714-6104
Email: [email protected]
Client Testimonials


.webp)


