
North America Smart Lighting Market Size, Share, Trends and Forecast by Offering, Communication Technology, Installation Type, Light Source, Application, and Country, 2026-2034
North America Smart Lighting Market Summary:
The North America smart lighting market size was valued at USD 7.96 Billion in 2025 and is projected to reach USD 26.52 Billion by 2034, growing at a compound annual growth rate of 14.3% from 2026-2034.
The market is experiencing growth driven by accelerating smart city initiatives, stringent energy efficiency regulations, and increasing integration of Internet of Things (IoT) technologies across commercial and residential infrastructure. Rising user demand for connected home ecosystems, coupled with declining light-emitting diode (LED) component costs and advanced wireless connectivity protocols, is reshaping the regional lighting landscape. Municipalities and enterprises are increasingly deploying intelligent lighting solutions to optimize energy usage, enhance occupant comfort, and enable data-driven facility management. The convergence of artificial intelligence (AI), building automation systems, and sustainable development objectives continues to create substantial opportunities for market participants across the value chain, contributing to the North America smart lighting market share.
Key Takeaways and Insights:
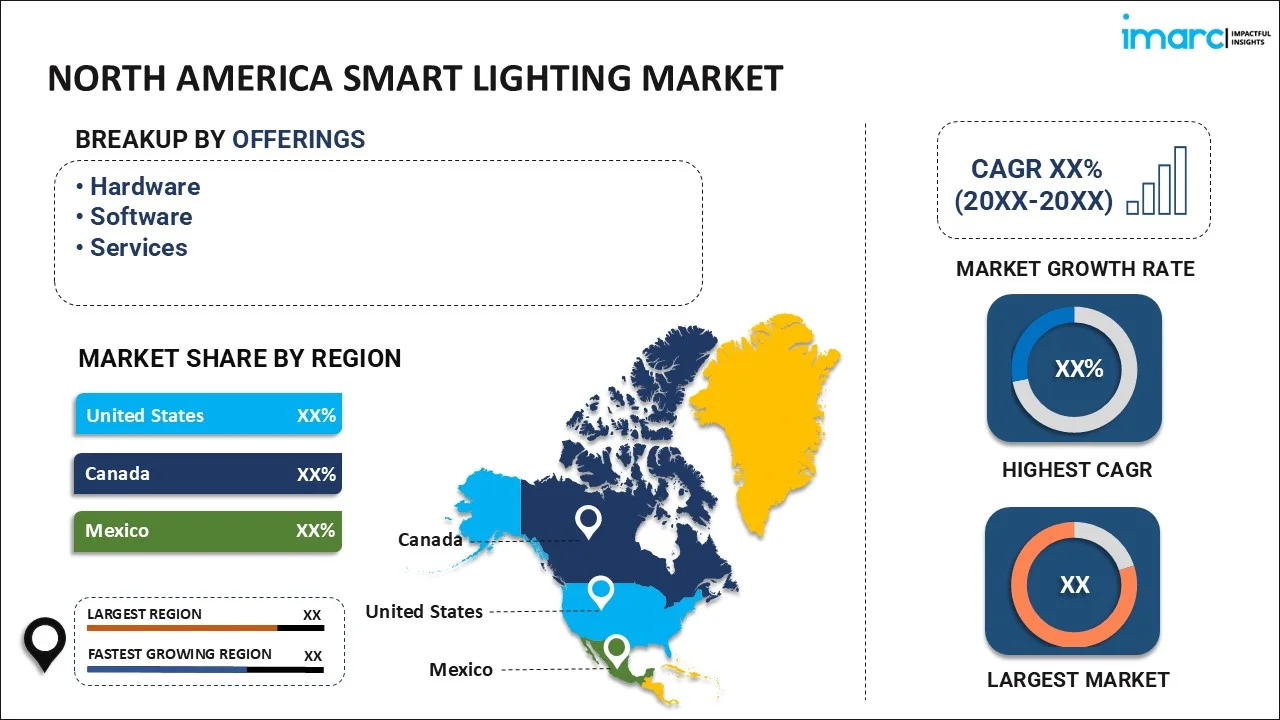
- By Offering: Hardware dominates the market with a share of 62% in 2025, driven by the foundational nature of smart lighting solutions requiring physical components like smart bulbs, sensors, gateways, and control panels to enable connectivity, automation, and energy optimization across residential and commercial applications.
- By Communication Technology: Wireless technology leads the market with a share of 68% in 2025, owing to its ease of installation, scalability, and seamless integration with IoT platforms. Bluetooth, Wi-Fi, and Zigbee protocols enable flexible deployment across homes and commercial buildings.
- By Installation Type: New installation represents the largest segment with a market share of 55% in 2025, supported by rising demand from new residential constructions, commercial buildings, and infrastructure projects where energy-efficient lighting is becoming a standard requirement.
- By Light Source: LED lamps dominate the market with a share of 70% in 2025, because of superior energy efficiency, longer lifespan, and declining costs that make them the preferred choice for both residential and commercial applications.
- By Application: Commercial leads the market with a share of 43% in 2025, due to widespread adoption in offices, retail spaces, hospitals, and industrial facilities where energy efficiency and occupant comfort are critical considerations.
- By Country: United States represents the largest segment with a market share of 79% in 2025, supported by the growing user adoption of connected home technologies, extensive commercial building automation initiatives, and substantial municipal smart city investments.
- Key Players: North America smart lighting market exhibits intense competitive activity, with established multinational corporations and innovative technology companies competing through product innovation, strategic acquisitions, and expanding IoT-integrated solutions across residential, commercial, and municipal segments.
The smart lighting market in North America is propelled by the growing adoption of connected home and building technologies, bolstered by a rising need for convenience, energy efficiency, and enhanced lighting control. Intelligent lighting solutions facilitate automatic dimming, presence detection, and flexible scheduling, assisting homes and companies in lowering energy usage and operational expenses. Market growth is enhanced by advancements in wireless communication, app-based management, and interoperability standards that make installation easier and enhance user experience. Interoperable ecosystems are enhancing adoption, as individuals are increasingly favoring solutions that work across various smart platforms. Deployments of outdoor and public infrastructure are also contributing to the market demand as cities enhance street lighting for safety and centralized oversight. In 2025, Flashnet unveiled its growth into the United States by establishing Flashnet LLC to enhance its smart street lighting initiatives in North America. The firm aimed to deliver regional knowledge, enhanced cooperation with local governments and services, and a greater reliance on American-manufactured parts.
North America Smart Lighting Market Trends:
Rising Adoption of Smart Home Automation Systems
The North America smart lighting market growth is being propelled by the rising adoption of smart home automation systems that enable centralized and intelligent control of household environments. People increasingly prefer connected lighting solutions that support remote operation, programmable routines, and integration with security and entertainment platforms. This trend is reinforced by continuous innovation, as in 2025, Signify announced new AI-powered Philips Hue developments across the United States and Canada, introducing a generative AI assistant within the Hue app, upgraded Hue Secure features, such as smoke alarm detection, and expanded Hue Sync TV compatibility for LG televisions. Such advancements strengthen demand by enhancing personalization, safety, and immersive connected living experiences.
Increasing Focus on Energy Efficiency and Cost Reduction
Energy efficiency is a crucial factor influencing the smart lighting adoption in North America, as businesses and households seek solutions that reduce electricity use while maintaining strong performance. Smart lighting systems support automated dimming, occupancy sensing, and adaptive scheduling, lowering energy bills and minimizing wastage. This focus is reinforced by innovations targeting commercial users, as in 2025 Enlighted announced the launch of Enlighted Eazy in Fremont, California, a new smart lighting control system designed specifically for small and medium-sized businesses. The solution offered fast app-based setup with laser-based commissioning, making installation up to 30% quicker than traditional methods. It also helped businesses reduce energy costs through occupancy sensing, daylight harvesting, and customizable lighting controls.
Rising Demand for Smart Lighting in Outdoor and Public Infrastructure
The North America smart lighting market is being supported by the growing deployment of intelligent outdoor lighting systems across public infrastructure and residential exterior applications. Municipal authorities increasingly adopt smart street lighting to enhance safety, improve efficiency, and enable centralized monitoring through adaptive brightness and fault detection features. Furthermore, there is rise in the user demand for connected outdoor solutions, which is encouraging manufacturers to introduce products catering to outdoor application. In 2025, Philips Hue launched three new Impress outdoor smart lights in the US and Canada, expanding its outdoor lighting portfolio. The lineup included a hardwired wall light, a wider wall variant, and a pedestal model, all offering app-controlled white and color ambiance lighting.
Market Outlook 2026-2034:
The North America smart lighting market demonstrates substantial revenue growth potential throughout the forecast period, underpinned by irreversible trends toward connected infrastructure and sustainable building practices. The market generated a revenue of USD 7.96 Billion in 2025 and is projected to reach a revenue of USD 26.52 Billion by 2034, growing at a compound annual growth rate of 14.3% from 2026-2034. This expansion is driven by the growing smart city investments, advancing IoT integration, and strengthening regulatory mandates for energy-efficient building systems across commercial and residential sectors.
North America Smart Lighting Market Report Segmentation:
|
Segment Category |
Leading Segment |
Market Share |
|
Offering |
Hardware |
62% |
|
Communication Technology |
Wireless Technology |
68% |
|
Installation Type |
New Installation |
55% |
|
Light Source |
LED Lamps |
70% |
|
Application |
Commercial |
43% |
|
Country |
United States |
79% |
Offering Insights:
To get detailed segment analysis of this market, Request Sample
- Hardware
- Lights and Luminaires
- Lighting Controls
- Software
- Services
- Design and Engineering
- Installation
- Post-Installation
Hardware exhibits a clear dominance with a 62% share of the total North America smart lighting market in 2025.
Hardware (lights and luminaires and lighting controls) accounts for the majority of the market share, driven by the high demand for connected lighting products such as smart bulbs, fixtures, sensors, and lighting controls. Individuals and businesses are increasingly investing in advanced hardware solutions to improve energy efficiency, enhance convenience, and enable automation. The widespread adoption of smart home ecosystems and commercial building upgrades supports strong sales of physical components. Continuous product innovation, including voice-enabled and app-controlled lighting devices, further strengthens hardware’s leading position.
The dominance of hardware is also driven by infrastructure replacement needs and large-scale deployment of smart lighting systems in residential, commercial, and industrial environments. Smart lighting hardware provides the foundation for advanced features, such as remote monitoring, occupancy detection, and adaptive brightness control. Governments and utilities promoting energy-saving initiatives have encouraged adoption of efficient lighting hardware across cities. Additionally, falling device costs, rising user awareness, and increased integration with IoT platforms ensure the market dominance.
Communication Technology Insights:
- Wired Technology
- Wireless Technology
Wireless technology dominates with a market share of 68% of the total North America smart lighting market in 2025.
Wireless technology represents the largest segment attributed to its convenience, flexibility, and ease of installation. Wireless systems, such as Wi-Fi, Bluetooth, Zigbee, and Z-Wave, allow smart lighting devices to connect seamlessly without complex wiring, making them highly suitable for both new installations and retrofitting existing buildings. Individuals prefer wireless solutions because they enable remote control through smartphones, voice assistants, and home automation platforms. Strong adoption of smart homes further reinforces this dominance.
The dominance of wireless communication is also supported by its scalability and compatibility with broader IoT ecosystems. Commercial buildings and cities increasingly deploy wireless smart lighting networks to reduce energy usage, improve operational efficiency, and support adaptive lighting features. Wireless system enables real-time monitoring, automated scheduling, and occupancy-based control, enhancing overall lighting management. Falling costs of wireless components and rapid advancements in connectivity standards continue to drive widespread adoption. Additionally, the growing preference for flexible, connected infrastructure ensures wireless technology remains the leading communication option in the market.
Installation Type Insights:
- New Installation
- Retrofit Installation
New installation leads with a market share of 55% of the total North America smart lighting market in 2025.
New installation exhibits a clear dominance in the market because of the rising construction activity and increasing integration of smart technologies in modern buildings. Residential developers and commercial projects are adopting smart lighting systems at the design stage to improve energy efficiency, enhance convenience, and support automation features. New installations allow seamless integration with smart home platforms, building management systems, and advanced connectivity networks. The growing focus on sustainable infrastructure and intelligent building solutions further drives the demand for smart lighting in newly built spaces.
The dominance of new installation is also supported by large-scale adoption in offices, retail spaces, and public infrastructure projects seeking long-term energy savings. Installing smart lighting during construction reduces retrofitting costs and ensures optimized system performance. Government initiatives promoting efficient lighting and green building standards also encourage developers to incorporate smart lighting solutions from the outset. Additionally, advancements in wireless connectivity and IoT-enabled devices make new installations more attractive for individuals and businesses, reinforcing their leading role in the market.
Light Source Insights:
- LED Lamps
- Fluorescent Lamps
- Compact Fluorescent Lamps
- High Intensity Discharge Lamps
- Others
LED lamps exhibit a clear dominance with a 70% share of the total North America smart lighting market in 2025.
LED lamps hold the biggest market share, influenced by their high energy efficiency, long operational lifespan, and compatibility with smart control technologies. LEDs use significantly less electricity than traditional lighting sources, making them the preferred option for households and commercial buildings aiming to reduce energy costs. Their ability to support dimming, color tuning, and automation features strengthens their role in smart lighting systems. Continuous advancements in LED technology and falling product prices further reinforce their market leadership.
The dominance of LED lamps is also driven by widespread adoption across residential, commercial, and industrial sectors as part of sustainability and energy conservation efforts. Smart LED lamps integrate seamlessly with wireless communication platforms, enabling remote control, scheduling, and occupancy-based lighting management. People favor LED solutions due to improved brightness, design flexibility, and reduced maintenance needs. In 2026, IKEA introduced the Grejsimojs LED table lamp in markets across North America and Europe. The playful dog-shaped lamp offers a replaceable LED light source, dimmable brightness, and a smart memory function that restores the previous setting when switched on.
Application Insights:
- Commercial
- Residential
- Public Infrastructure
- Others
Commercial dominates with a market share of 43% of the total North America smart lighting market in 2025.
Commercial leads the market owing to the high demand for energy-efficient and automated lighting solutions across offices, retail spaces, hotels, and industrial facilities. Businesses increasingly adopt smart lighting to reduce operational costs, optimize electricity consumption, and improve workplace productivity. Smart systems enable centralized control, adaptive brightness, and occupancy-based lighting, which enhance efficiency in large commercial buildings. Strong investments in intelligent infrastructure and green building upgrades further support the commercial sector’s leading share in the market.
The dominance of commercial smart lighting is also driven by regulatory pressure and sustainability targets encouraging adoption of advanced energy-saving technologies. Commercial buildings benefit significantly from smart lighting through reduced maintenance needs, improved safety, and enhanced user experience in retail and hospitality settings. Integration with building management systems and IoT networks allows real-time monitoring and automated scheduling, improving overall facility performance. Additionally, large-scale deployment in airports, malls, and corporate campuses continues to generate high demand, ensuring commercial remains the largest segment in the market.
Country Insights:
- United States
- Canada
- Mexico
United States leads with a market share of 79% of the total North America smart lighting market in 2025.
United States dominates the market due to its advanced technological adoption, strong smart home penetration, and large-scale commercial infrastructure. People across the country increasingly invest in connected lighting solutions for convenience, energy savings, and home automation integration. The presence of major smart lighting manufacturers, strong distribution networks, and high disposable incomes further supports widespread adoption. In addition, the market is increasingly influenced by digital retail growth, with US retail e-commerce sales reaching $310.3 billion in Q3 2025, as per the U.S. Census Bureau, reflecting rising online demand.
The dominance of the United States is also driven by extensive deployment of smart lighting in commercial buildings, offices, retail complexes, and public infrastructure projects. Businesses adopt smart lighting systems to reduce energy usage, improve operational efficiency, and support sustainability goals. The growing integration of IoT platforms, voice assistants, and wireless connectivity enhances product demand. Additionally, continuous innovation in LED-based smart lighting and supportive regulatory frameworks encourage faster replacement of conventional lighting, ensuring the United States remains the largest contributor to North America’s smart lighting market.
Market Dynamics:
Growth Drivers:
Why is the North America Smart Lighting Market Growing?
Growing Adoption of Interoperable and Standardized Ecosystems
The North America smart lighting market is being driven by rising demand for interoperable solutions that enable seamless operation across multiple connected devices and smart home platforms. People increasingly prefer standardized ecosystems that reduce integration complexity and allow unified control through widely adopted IoT protocols. This momentum is reflected in 2025, when IKEA Canada announced the launch of 21 new Matter-compatible smart home products focused on smart lighting, sensors, and remote controls, aimed at improving affordability and cross-brand compatibility. Such developments highlight how interoperability is strengthening adoption by simplifying installation, enhancing user experience, and supporting broader penetration of smart lighting systems across the region.
Rise of E-Commerce and Digital Retail Channels
The rapid expansion of e-commerce and digital retail platforms, which are improving product visibility and user access, is impelling the market growth. Online channels allow buyers to compare features, pricing, and compatibility across a wide range of smart lighting solutions, supporting informed purchasing decisions. This shift toward digital buying behavior is evident in Canada, where e-commerce accounted for 6.1% of total retail sales in December 2024, with online sales reaching approximately USD 3.14 billion, according to ITA data. Strong online penetration accelerates adoption of smart lighting by simplifying discovery, distribution, and direct-to-consumer (DTC) engagement across the region.
Expansion of Wireless Communication and Voice Assistant Integration
The North America smart lighting market is being supported by the widespread adoption of wireless communication technologies and app-enabled control platforms that enhance convenience and system integration. Individuals and businesses increasingly prefer lighting solutions that offer seamless remote operation, simplified installation, and compatibility with connected ecosystems. This demand is reinforced by advancing control innovations, as in 2024, Casambi launched the Salvador Series 3016 in the United States, enabling up to 16 DALI drivers to be individually programmed and monitored through the Casambi app within hybrid wired and wireless networks. Such developments strengthen adoption by supporting efficient, compliant, and user-friendly smart lighting deployments.
Market Restraints:
What Challenges the North America Smart Lighting Market is Facing?
High Initial Investment Costs Limiting Broader Market Adoption
The upfront cost of smart lighting systems remains significantly higher than conventional lighting alternatives, presenting adoption barriers for price-sensitive individuals and organizations with constrained capital budgets. While long-term operational savings and energy cost reductions demonstrate compelling return on investment, the initial expenditure required for comprehensive smart lighting deployments can discourage adoption, particularly among smaller businesses and residential users.
Interoperability Challenges Across Multiple Wireless Protocols
The coexistence of multiple wireless communication standards creates significant complexity for users and system integrators attempting to develop cohesive smart lighting ecosystems. Different protocols often require separate control platforms and compatibility adjustments, increasing installation challenges and integration costs. This fragmentation can slow adoption, as stakeholders prefer unified systems that ensure seamless connectivity, reliable performance, and simplified management across diverse smart lighting applications.
Cybersecurity Vulnerabilities in Connected Lighting Networks
Connected lighting systems introduce potential security vulnerabilities as networked devices become potential entry points for cyberattacks targeting broader building systems and corporate networks. Security research has demonstrated that compromised smart lighting devices can provide access to wider information technology infrastructure, creating remediation costs and liability concerns that deter adoption in security-critical environments.
Competitive Landscape:
The North America smart lighting market exhibits intense competitive activity characterized by the presence of established multinational lighting corporations alongside innovative technology companies competing across residential, commercial, and municipal segments. Market dynamics reflect strategic positioning, ranging from user-focused connected home solutions emphasizing ease of use and ecosystem integration to enterprise-grade commercial platforms delivering advanced analytics and building automation capabilities. The competitive landscape is increasingly shaped by AI integration, software platform development, strategic acquisitions, and expanding partnerships with smart home ecosystem providers. Companies are differentiating through product innovation, expanding service offerings, and strengthening distribution channels to capture market share across diverse application segments.
Recent Developments:
- November 2025: Messe Frankfurt, along with the Illuminating Engineering Society (IES) and the International Association of Lighting Designers (IALD), announced the launch of Light + Intelligent Building North America, a new trade show focused on lighting, smart controls, and integrated building technologies. Scheduled to debut in Las Vegas from March 15–18, 2027, the platform will unite architects, engineers, designers, and system integrators under one roof.
- September 2025: Govee launched the Star Light Projector (Ocean Wave) in North America and Europe, expanding its smart ambient lighting portfolio. The device projected colorful water ripple effects onto walls and ceilings, offering over 40 dynamic presets through the Govee Home app. It also included a built-in Bluetooth speaker with music and white-noise playback, along with Alexa, Google Home, and Matter smart home compatibility for connected control.
North America Smart Lighting Market Report Coverage:
| Report Features | Details |
|---|---|
| Base Year of the Analysis | 2025 |
| Historical Period | 2020-2025 |
| Forecast Period | 2026-2034 |
| Units | Billion USD |
|
Scope of the report |
Exploration of Historical Trends and Market Outlook, Industry Catalysts and Challenges, Segment-Wise Historical and Future Market Assessment:
|
| Offerings Covered |
|
| Communication Technologies Covered | Wired Technology, Wireless Technology |
| Installation Types Covered | New Installation, Retrofit Installation |
| Light Sources Covered | LED Lamps, Fluorescent Lamps, Compact Fluorescent Lamps, High Intensity Discharge Lamps, Others |
| Applications Covered | Commercial, Residential, Public Infrastructure, Others |
| Countries Covered | United States, Canada, Mexico |
| Customization Scope | 10% Free Customization |
| Post-Sale Analyst Support | 10-12 Weeks |
| Delivery Format | PDF and Excel through Email (We can also provide the editable version of the report in PPT/Word format on special request) |
Frequently Asked Questions About the North America Smart Lighting Market Report
The North America smart lighting market size was valued at USD 7.96 Billion in 2025.
The North America smart lighting market is expected to grow at a compound annual growth rate of 14.3% from 2026-2034 to reach USD 26.52 Billion by 2034.
Hardware dominates the market with 62% revenue share in 2025, driven by the foundational nature of physical components including smart bulbs, sensors, gateways, and control panels essential for enabling connectivity, automation, and energy optimization across applications.
Key factors driving the North America smart lighting market include energy efficiency demand, as businesses and households seek solutions that reduce electricity use through automated dimming and occupancy sensing. Supporting this trend, Enlighted launched Enlighted Eazy in Fremont in 2025, offering faster installation and energy savings for small and medium-sized businesses.
Major challenges include high initial investment costs compared to conventional lighting, interoperability challenges across multiple wireless communication protocols, cybersecurity vulnerabilities in connected lighting networks, and complexity in integrating legacy building systems with modern smart lighting platforms.
Need more help?
- Speak to our experienced analysts for insights on the current market scenarios.
- Include additional segments and countries to customize the report as per your requirement.
- Gain an unparalleled competitive advantage in your domain by understanding how to utilize the report and positively impacting your operations and revenue.
- For further assistance, please connect with our analysts.
 Request Customization
 Speak to an Analyst
 Request Brochure
 Inquire Before Buying
Benefits of Customization
- Personalize this research
- Triangulate with your data
- Get data as per your format and definition
- Gain a deeper dive into a specific application, geography, customer, or competitor
- Any level of personalization
Get in Touch With Us
UNITED STATES
Phone: +1-201-971-6302
INDIA
Phone: +91-120-433-0800
UNITED KINGDOM
Phone: +44-753-714-6104
Email: [email protected]
Client Testimonials


.webp)


