
North America Tartaric Acid Market Size, Share, Trends and Forecast by Type, End-Use, and Country, 2026-2034
North America Tartaric Acid Market Summary:
The North America tartaric acid market size reached 34.32 Kilo Tons in 2025 and is projected to reach 52.99 Kilo Tons by 2034, growing at a compound annual growth rate of 4.94% from 2026-2034.
The North America tartaric acid market is expanding steadily, as demand rises across the food and beverage (F&B), pharmaceutical, and cosmetic industries. Increasing consumer preferences for natural and organic ingredients, coupled with the growing adoption of clean-label products, is fueling consumption. The expanding wine industry and rising applications in drug formulations and skincare further strengthen the market share.
Key Takeaways and Insights:
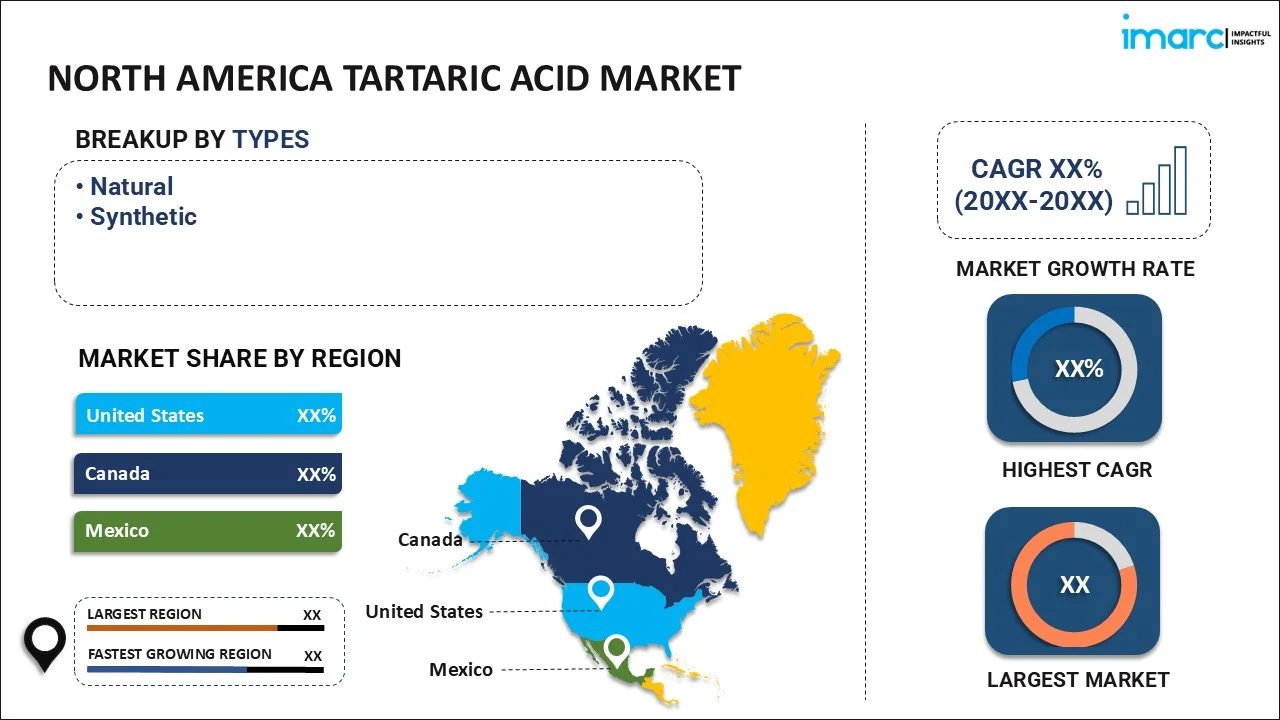
- By Type: Natural dominates the market with a share of 55% in 2025, driven by rising consumer demand for naturally sourced food additives and clean-label ingredients. Expanding applications in winemaking and pharmaceutical formulations continue to strengthen preference for grape-derived tartaric acid across the region.
- By End-Use: Food and beverages lead the market with a share of 40% in 2025. This dominance is driven by the widespread utilization of tartaric acid as an acidulant, stabilizer, and emulsifier in baked goods, confectionery, carbonated beverages, and wine production throughout the region.
- By Country: United States represents the largest country with 69% share in 2025, reflecting its dominant wine production infrastructure concentrated in California, robust processed food manufacturing sector, and strong pharmaceutical industry that collectively sustain high-volume tartaric acid consumption.
- Key Players: Key players drive the North America tartaric acid market by expanding product portfolios, investing in sustainable extraction technologies, and strengthening distribution networks. Their focus on natural ingredient innovation, strategic partnerships, and quality certifications accelerates adoption and ensures consistent product availability across diverse industrial segments.
The North America tartaric acid market is experiencing sustained growth, as industries increasingly prioritize natural, plant-derived ingredients across manufacturing processes. The F&B industry continues to be a key source of demand, with tartaric acid acting as a vital acidulant, preservative, and flavor enhancer in items, including baked products and fizzy drinks. The region’s established wine industry further sustains significant consumption volumes, as tartaric acid is indispensable for regulating acidity, enhancing flavor stability, and preventing crystallization during production. As per IMARC Group, the United States wine market size reached USD 79.8 Billion in 2025. In the pharmaceutical sector, the compound’s utility as a chiral resolving agent, excipient, and buffering agent in drug formulations is driving incremental demand, particularly for high-purity grades. The cosmetics industry is also contributing to market expansion, leveraging tartaric acid’s exfoliating and antioxidant properties in skincare products. Regulatory support for clean-label ingredients further reinforces adoption across end-use sectors.
North America Tartaric Acid Market Trends:
Growing Preferences for Clean-Label and Natural Ingredients
North American consumers are increasingly favoring food products formulated with natural, minimally processed ingredients, driving manufacturers to adopt naturally derived tartaric acid over synthetic alternatives. This shift aligns with broader clean-label movements emphasizing transparency and ingredient simplicity. F&B manufacturers are adjusting their recipes to remove synthetic additives while preserving product functionality and sensory appeal. Naturally derived tartaric acid supports clean-label claims by providing acidity control and flavor enhancement without compromising ingredient transparency. As retailers and regulators place greater emphasis on clear labeling, demand for natural tartaric acid continues to strengthen across packaged F&B applications.
Expansion of Pharmaceutical Applications
Tartaric acid is gaining increasing relevance in pharmaceutical manufacturing, particularly as a chiral resolving agent and excipient in drug formulations. The compound’s role in enhancing drug solubility, stability, and bioavailability is attracting attention from formulators developing effervescent tablets, antibiotics, and cardiovascular medications. Its well-established safety profile and compatibility with a wide range of active pharmaceutical ingredients make it suitable for diverse therapeutic applications. Pharmaceutical manufacturers are also leveraging tartaric acid to improve taste masking and controlled release characteristics in oral dosage forms.
Sustainable Production and Circular Economy Initiatives
Sustainability is becoming a defining factor in tartaric acid production, with manufacturers investing in circular economy practices that recover the compound from winemaking byproducts, such as grape pomace and wine lees. These practices minimize waste while ensuring a consistent supply of natural tartaric acid. Producers are lessening their reliance on synthetic pathways and overall environmental impact by turning agricultural leftovers into valuable commodities. The implementation of circular production models throughout the tartaric acid value chain is being further encouraged by the growing support from F&B firms for sustainably produced ingredients.
Market Outlook 2026-2034:
The North America tartaric acid market is poised for robust expansion during the forecast period, supported by escalating demand from the food processing, winemaking, pharmaceutical, and cosmetic industries. Continued consumer preferences for natural and organic ingredients are expected to sustain the dominance of naturally derived tartaric acid. The market size was estimated at 34.32 Kilo Tons in 2025 and is expected to reach 52.99 Kilo Tons by 2034, reflecting a compound annual growth rate of 4.94% over the forecast period 2026-2034. Advancements in sustainable extraction technologies, expanding pharmaceutical applications, and growing investments in clean-label product formulations are anticipated to create new opportunities. Additionally, strengthening distribution partnerships and evolving regulatory frameworks favoring natural additives will reinforce market momentum across the region.
North America Tartaric Acid Market Report Segmentation:
|
Segment Category |
Leading Segment |
Market Share |
|
Type |
Natural |
55% |
|
End-Use |
Food and Beverages |
40% |
|
Country |
United States |
69% |
Type Insights:
To get detailed segment analysis of this market, Request Sample
- Natural
- Synthetic
Natural dominates with a market share of 55% of the total North America tartaric acid market in 2025.
The natural segment continues to lead the North America tartaric acid market, as consumer demand for clean-label, plant-based ingredients in F&B applications is increasing. A well-established supply chain connected to the region's vast viticulture industry supports natural tartaric acid, which is mostly extracted from grape pomace and wine lees. Its compatibility with circular economy principles and sustainability goals increases its acceptability among producers looking for eco-friendly sourcing solutions.
The demand for naturally sourced additives is further supported by regulatory frameworks in the United States and Canada, especially in applications involving pharmaceuticals where purity and traceability are crucial. Higher volumes of grape-based residues suitable for tartaric acid recovery are also produced by the region's growing adoption of sustainable and organic winemaking methods, enhancing production scalability and cost competitiveness against synthetic alternatives. This regulatory and industry alignment strengthens market confidence and encourages long-term adoption of natural tartaric acid across regulated end-use sectors.
End-Use Insights:
- Food and Beverages
- Pharmaceuticals
- Cosmetics
- Others
Food and beverages lead with a share of 40% of the total North America tartaric acid market in 2025.
Food and beverages command the largest share of tartaric acid consumption in North America, motivated by the compound's widespread applications in the manufacturing of wine, baked goods, confections, emulsifiers, stabilizers, and taste enhancers. It is especially useful for large-scale food processing operations because of its capacity to provide uniform acidity and enhance shelf stability. In addition, its functional versatility across diverse formulations supports consistent adoption across a wide range of processed products.
Tartaric acid's importance in product formulations is being further enhanced by the rising customer desire for naturally preserved, clean-label food items. Since tartaric acid is necessary for controlling acidity, maintaining flavor, and preventing potassium bitartrate crystallization, wine manufacturing is a major demand driver in this market. In the United States and Canada, the growing craft beverage movement and rising interest in premium wines support strong consumption levels in this end use category.
Country Insights:
- United States
- Canada
- Mexico
United States exhibits a clear dominance with a 69% share of the total North America tartaric acid market in 2025.
United States leads the North America tartaric acid market, underpinned by its massive food processing industry, established wine production infrastructure, and advanced pharmaceutical manufacturing sector. As of August 2024, California alone produced more than 80% of the nation’s wine, generating substantial volumes of grape-derived byproducts that feed natural tartaric acid supply chains. Additional factors that improve supply chain efficiency and sustain consistent market growth across the region include a robust logistical infrastructure and close proximity to vineyards, processing plants, and end use manufacturers.
In addition to winemaking, tartaric acid is consistently needed as an acidulant and stabilizer in the United States' extensive baking, confectionery, and beverage production industries. Through the use of high-purity tartaric acid in medicine formulations, effervescent tablets, and chiral resolution procedures, the nation's pharmaceutical industry further adds to consumption. The need for premium-grade tartaric acid products is reinforced by the strict FDA regulations controlling pharmaceutical excipients and food additives, which guarantee high quality standards.
Market Dynamics:
Growth Drivers:
Why is the North America Tartaric Acid Market Growing?
Expanding F&B Industry Demand
The North America tartaric acid market is benefiting significantly from the expanding F&B manufacturing sector, where the compound serves as a multifunctional ingredient. Tartaric acid is widely employed as an acidulant in carbonated beverages, a stabilizer in confectionery products, a leavening agent in baking powders, and a flavor enhancer in processed foods. The region’s strong consumer appetite for convenience foods, ready-to-drink (RTD) beverages, and bakery products continues to drive procurement volumes. As per IMARC Group, the Mexico convenience food market size reached USD 6.13 Billion in 2024 and is set to reach USD 11.09 Billion by 2033. Clean-label reformulation initiatives, where manufacturers replace synthetic additives with naturally derived alternatives, are further accelerating adoption. In addition, continuous product innovations and frequent new product launches in beverages and packaged foods are sustaining long-term demand for tartaric acid across diverse formulation requirements.
Growth in Wine Production and Premium Beverage Culture
North America’s wine industry, particularly concentrated in the United States, represents a fundamental demand pillar for tartaric acid. The compound is critical for managing acidity, ensuring flavor stability, and preventing the crystallization of potassium bitartrate during vinification. The growing popularity of premium and craft wines, alongside expanding wine tourism and consumption culture across the region, continues to reinforce tartaric acid demand within this critical segment. In order to ensure customer satisfaction, winemakers are depending more on tartaric acid to maintain uniform quality across various grape varieties and vintages. Longer shelf life and stability during distribution and storage are further benefits of its use. Moreover, tartaric acid is embedded as a necessary component in contemporary enology procedures, which place an emphasis on precise acid management to achieve balanced flavor profiles.
Rising Pharmaceutical and Cosmetic Industry Applications
Tartaric acid’s versatile functional properties are driving increasing adoption in the pharmaceutical and cosmetic sectors across North America. In pharmaceuticals, it is employed as a chiral resolving agent for drug synthesis, an excipient in effervescent tablet formulations, and a buffering agent that improves drug solubility, stability, and bioavailability. The growing complexity of drug formulations, including specialty medicines and biologics, is creating steady demand for high-purity tartaric acid. In the cosmetics and personal care industry, its exfoliating, pH-regulating, and antioxidant properties are being leveraged in anti-aging creams, facial cleansers, chemical peels, and other skincare products. Manufacturers are investing in reliable production and supply chains to meet this diversified demand. Across both industries, tartaric acid is recognized for its functional efficiency, safety profile, and formulation flexibility, making it an increasingly important ingredient in pharmaceutical and personal care product development.
Market Restraints:
What Challenges the North America Tartaric Acid Market is Facing?
Raw Material Supply Volatility and Climate Sensitivity
The production of natural tartaric acid is inherently reliant on grape harvests, which are susceptible to unfavorable weather patterns, such as drought, frost, and heat waves. Variations in grape yields can cause supply shortages and pricing instability by interfering with the availability of raw materials. The ability of manufacturers to maintain steady production quantities is hampered by seasonal variations in viticulture output across important producing regions, which poses procurement issues for downstream sectors.
Competition from Alternative Acidulants
Alternative organic acids that provide similar functions at lower price points, such as citric acid, malic acid, and lactic acid, put pressure on tartaric acid. These substitutes are generally accessible and frequently chosen in F&B applications that are cost-sensitive. The commercial penetration of tartaric acid may be constrained by the availability of affordable synthetic acidulants, especially in industrial and non-premium product segments.
Regulatory Compliance and Quality Standardization Costs
In North America, producers and distributors of tartaric acid have to comply with strict regulations that dictate the criteria for pharmaceutical and food-grade products. It takes a large investment in quality control, testing facilities, and paperwork to comply with FDA requirements, labeling laws, and purity levels. Smaller producers looking to enter the market may encounter obstacles, due to these regulatory restrictions, which can also increase operating expenses.
Competitive Landscape:
The North America tartaric acid market is characterized by a moderately consolidated competitive structure, with participation from both established global producers and regional distributors. Businesses are concentrating on strengthening their market positions by diversifying their product lines, increasing extraction efficiency, and negotiating long-term supply contracts. Products are becoming more accessible throughout the region, owing to strategic alliances between distribution networks and producers. Competitive difference is being fueled by innovations in high-purity grade products, bio-based item creation, and sustainable production techniques. Through investments in clean-label positioning, quality certifications, and capacity development, market participants are able to meet changing end user needs from the food, pharmaceutical, and cosmetic industries.
North America Tartaric Acid Market Report Coverage:
| Report Features | Details |
|---|---|
| Base Year of the Analysis | 2025 |
| Historical Period | 2020-2025 |
| Forecast Period | 2026-2034 |
| Units | Kilo Tons, Million USD |
| Scope of the Report |
Exploration of Historical and Forecast Trends, Industry Catalysts and Challenges, Segment-Wise Historical and Predictive Market Assessment:
|
| Types Covered | Natural, Synthetic |
| End-Uses Covered | Food and Beverages, Pharmaceuticals, Cosmetics, Others |
| Countries Covered | United States, Canada, Mexico |
| Customization Scope | 10% Free Customization |
| Post-Sale Analyst Support | 10-12 Weeks |
| Delivery Format | PDF and Excel through Email (We can also provide the editable version of the report in PPT/Word format on special request) |
Frequently Asked Questions About the North America Tartaric Acid Market Report
The North America tartaric acid market reached a volume of 34.32 Kilo Tons in 2025.
The North America tartaric acid market is expected to grow at a compound annual growth rate of 4.94% from 2026-2034 to reach 52.99 Kilo Tons by 2034.
Natural dominated the market with a share of 55%, driven by growing consumer preference for plant-derived, clean-label ingredients across food, beverage, and pharmaceutical applications in the region.
Key factors driving the North America tartaric acid market include expanding F&B manufacturing, growing wine production, rising pharmaceutical applications, increasing demand for clean-label ingredients, and sustainability-focused production innovations.
Major challenges include raw material supply volatility linked to grape harvest fluctuations, competition from other acidulants, such as citric and malic acid, stringent regulatory compliance costs, and price sensitivity in industrial applications.
Need more help?
- Speak to our experienced analysts for insights on the current market scenarios.
- Include additional segments and countries to customize the report as per your requirement.
- Gain an unparalleled competitive advantage in your domain by understanding how to utilize the report and positively impacting your operations and revenue.
- For further assistance, please connect with our analysts.
 Request Customization
 Speak to an Analyst
 Request Brochure
 Inquire Before Buying
Benefits of Customization
- Personalize this research
- Triangulate with your data
- Get data as per your format and definition
- Gain a deeper dive into a specific application, geography, customer, or competitor
- Any level of personalization
Get in Touch With Us
UNITED STATES
Phone: +1-201-971-6302
INDIA
Phone: +91-120-433-0800
UNITED KINGDOM
Phone: +44-753-714-6104
Email: [email protected]
Client Testimonials


.webp)


