
North America Telecom Power Systems Market Size, Share, Trends and Forecast by Product Type, Component, Power Source, Grid Type, and Country, 2026-2034
North America Telecom Power Systems Market Market Size and Share:
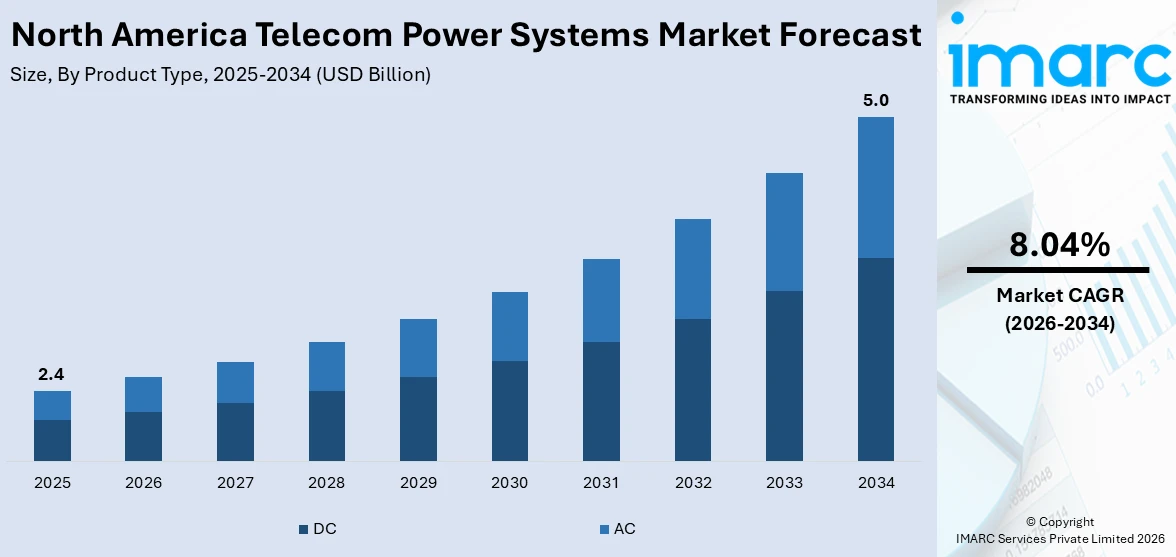
The North America telecom power systems market size was valued at USD 2.4 Billion in 2025. Looking forward, IMARC Group estimates the market to reach USD 5.0 Billion by 2034, exhibiting a CAGR of 8.04% from 2026-2034. The market is growing due to increasing demand for reliable, energy-efficient power solutions for telecom infrastructure. Rising need for uninterrupted service, sustainability goals and advancements in power management systems, particularly in remote and off-grid locations are driving the market growth across the region.
|
Report Attribute
|
Key Statistics
|
|---|---|
|
Base Year
|
2025
|
|
Forecast Years
|
2026-2034
|
|
Historical Years
|
2020-2025
|
|
Market Size in 2025
|
USD 2.4 Billion |
|
Market Forecast in 2034
|
USD 5.0 Billion |
| Market Growth Rate (2026-2034) | 8.04% |
The increasing demand for reliable and uninterrupted communication networks is driving the North America telecom power systems market. The growing reliance on 4G and 5G technologies makes telecom operators invest in robust power systems to ensure consistent performance and avoid network downtime. For instance, in December 2023, AT&T announced its plans to invest $140 billion to enhance its 5G and fiber networks aiming to double its fiber footprint to 50 million locations by 2029. The company focuses on blending wireless and broadband services to improve customer retention anticipating 7% annual broadband revenue growth and a significant increase in fiber subscribers. Moreover, the expansion of data centers and the shift towards cloud-based services further boost the need for advanced telecom power systems to manage energy consumption efficiently and meet sustainability goals.
To get more information on this market Request Sample
Renewable energy sources and energy efficiency in the telecom industries represent some of the key market trends. Solar and wind power as well as hybrid power solutions have begun to gain more acceptance with companies in an effort to reduce operational costs and environmental issues. These power systems eventually save money on costs over the long term while helping meet regulatory requirements for carbon reduction. According to the North America telecom power systems market forecast, renewable energy adoption will play a key role in market expansion. Furthermore, technological advancements in power backup systems including battery storage and fuel cells are enhancing the reliability and sustainability of telecom infrastructure. For instance, in December 2024, Rogers Communications launched Canada’s first home internet backup device featuring a rechargeable battery that provides up to four hours of power during outages.
North America Telecom Power Systems Market Trends:
Shift to Renewable Energy
Telecom firms in North America are integrating solar and wind energy sources into their network. This shift in their infrastructure minimizes the usage of traditional grid power therefore decreasing operational cost and carbon emission. Solar panels and wind turbines are integrated in the telecom towers, data centers and base stations particularly in remote areas or off-grid sites. The adoption of renewable energy not only fits into the sustainability goals but also enhances energy security through diversification of power sources. For instance, in October 2023, Aither Systems successfully deployed its first iQM550 energy storage system at a Tier-1 telecom carrier cell site. The system operated efficiently for three days demonstrating advantages over traditional power solutions. This milestone reflects Aither's commitment to innovative high-density energy solutions and enhancing network reliability. It reduces long-term energy costs and supports regulatory compliance because governments are now pushing for greener technologies and carbon reduction initiatives in the telecom sector.
Energy Storage Solutions
The demand for battery storage systems in North America's telecom sector is increasing as a result of the need to provide an uninterrupted power supply in case of grid failure or at times of high demand. Base stations and data centers in the telecom infrastructure need constant energy supply especially in remote locations where power reliability is often limited. For instance, in January 2025, Exide Technologies launched Solition Telecom a pioneering lithium-ion energy storage system designed for telecom Base Transceiver Stations. Offering reliable backup power across diverse grid conditions it features advanced battery management, high energy efficiency and modular scalability promising safety and longevity while reducing operational costs for telecom operators. Advanced battery technologies like lithium-ion and flow batteries offer scalable approaches to store excess energy created by renewable sources such as solar and wind. These systems provide a backup power source reducing operational costs ensure continuous service even during power outages and help keep the telecommunication network stable and deliver customer expectation.
Smart Grid Integration
Smart grid technology is gaining traction in North America's telecom power systems to enhance the delivery of power and minimize outages. This technology integrates real-time data monitoring, automated controls and advanced analytics to boost the efficiency of power delivery to telecom infrastructure. These grids facilitate fast identification and resolution of problems thereby preventing network outages and ensuring stable reliable power. They also enable dynamic load management optimizing energy consumption based on demand fluctuations. Predictive maintenance and improved fault detection help telecom operators manage energy use more efficiently, cut operational costs and ensure higher uptime for critical communication services.
North America Telecom Power Systems Industry Segmentation:
IMARC Group provides an analysis of the key trends in each segment of the North America telecom power systems market, along with forecasts at the country and regional levels from 2026-2034. The market has been categorized based on product type, component, power source, and grid type.
Analysis by Product Type:
- DC
- AC
DC (Direct Current) systems holds the largest North America telecom power systems market share due to their efficiency in powering telecom infrastructure. DC power offers lower energy losses during transmission making it ideal for remote sites and base stations. Additionally, telecom equipment typically operates on DC reducing the need for conversion and improving system reliability. DC systems are also scalable, more cost-effective and easier to maintain. When combined with renewable sources such as solar and wind energy sources they make it the preferred source for telecom operators who seek high efficiency and reduced operational costs.
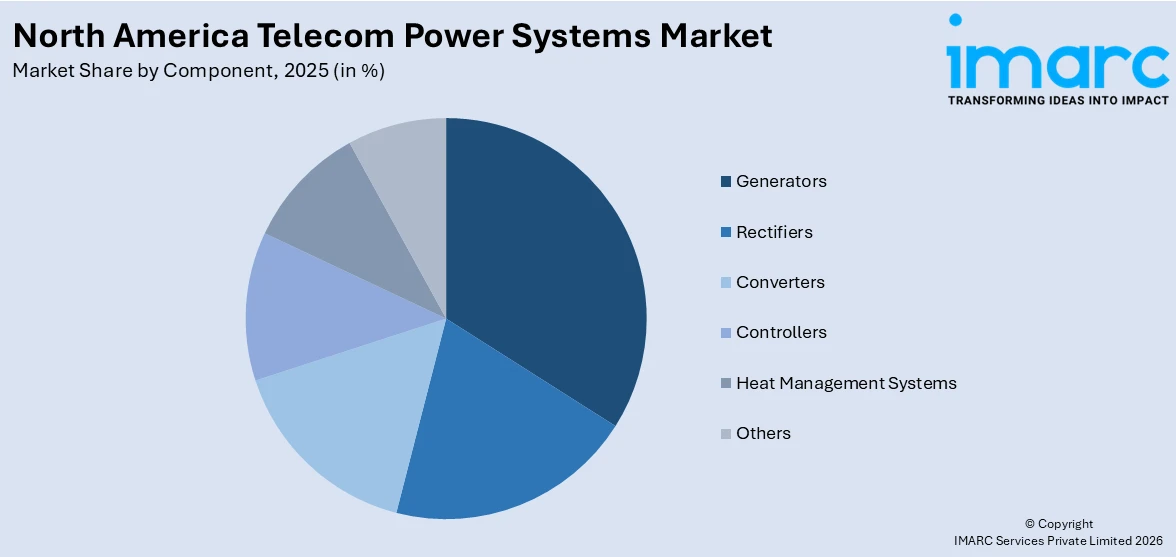
Analysis by Component:
Access the comprehensive market breakdown Request Sample
- Rectifiers
- Converters
- Controllers
- Heat Management Systems
- Generators
- Others
Generators lead the North America telecom power systems market as they are essential in providing backup power during grid outages or peak demand periods. Diesel and hybrid generators are also widely used due to their reliability, long runtime and support for telecom infrastructure especially in off-grid or remote locations. With an increasing demand for constant service and energy security generators provide a reliable source of power so that the telecom network remains in service during a power interruption or emergency. This versatility along with cost-effective capabilities drives market leadership.
Analysis by Power Source:
- Diesel-Battery
- Diesel-Solar
- Diesel-Wind
- Multiple Sources
Diesel-Battery lead the North America Telecom Power Systems Market due to their ability to balance efficiency, reliability and sustainability. These systems combine the reliability of diesel generators with the flexibility of battery storage ensuring continuous power during grid failures or peak demand periods. The diesel generator provides long-term backup while the battery offers quick-response power for short outages reducing fuel consumption and emissions. This hybrid approach is very effective for remote telecom sites offering cost savings and reduced environmental impact.
Analysis by Grid Type:
- On Grid
- Off Grid
- Bad Grid
Bad Grid systems lead the market due to their ability to provide reliable power in areas with unstable or poor grid infrastructure. These systems are designed to operate in environments with frequent voltage fluctuations, power surges or interruptions ensuring telecom networks remain operational. By incorporating advanced power conditioning technologies Bad Grid systems mitigate issues caused by unstable grids offering telecom operators a stable and cost-effective power solution especially in rural or underserved regions.
Regional Analysis:
- United States
- Canada
The United States dominates the North America telecom power systems market due to its large telecom infrastructure and high demand for reliable and continuous power. The country’s extensive network of telecom towers, data centers and base stations drives the need for efficient power solutions. With a focus on sustainability the U.S. is adopting renewable energy sources like solar and wind along with advanced storage and hybrid systems. Regulatory incentives, technological advancements and the drive for energy efficiency further fuel market growth.
Competitive Landscape:
The North America telecom power systems market is characterized by intense competition among key players each striving to offer innovative, cost-effective and reliable power solutions for telecom infrastructure. Companies are focusing on integrating renewable energy sources such as solar, wind and hybrid systems to meet growing sustainability demands while ensuring power reliability. The market is witnessing a shift toward energy-efficient solutions with a strong emphasis on battery storage, smart grid technology and low-maintenance systems. Players are investing in advanced power management systems and automation to optimize energy usage and reduce downtime. Strategic partnerships and collaborations are also prevalent enabling companies to expand their portfolios, enhance technological capabilities and address the diverse power needs of telecom operators across the region.
The report provides a comprehensive analysis of the competitive landscape in the North America telecom power systems market with detailed profiles of all major companies, including:
- Ascot Group
- Alpha Technologies
- General Electric
- Eaton Corp PLC
- Huawei Technologies
- ZTE Corporation
- Schneider Electric SE
- Cummins Inc.
- Delta Group
- ABB Group
Latest News and Developments:
- In June 2024, Alpine Power Systems acquired assets of DC Power Systems, Inc. enhancing its presence in the Southeast. This marks Alpine's 26th acquisition, leveraging DC's expertise in critical power solutions. Leaders from both companies express excitement for the collaboration, aiming to deliver innovative solutions and exceptional service to customers.
- In August 2024, Concentric, LLC acquired Communication Power Solutions Inc. to enhance its power management services for communications and data center clients in the Southwest. The acquisition strengthens Concentric’s capabilities in DC power systems and expands its national reach promoting innovation and improved service in a rapidly evolving market.
North America Telecom Power Systems Market Report Scope:
| Report Features | Details |
|---|---|
| Base Year of the Analysis | 2025 |
| Historical Period | 2020-2025 |
| Forecast Period | 2026-2034 |
| Units | Billion USD |
| Scope of the Report |
Exploration of Historical Trends and Market Outlook, Industry Catalysts and Challenges, Segment-Wise Historical and Future Market Assessment:
|
| Product Types Covered | DC, AC |
| Components Covered | Rectifiers, Converters, Controllers, Heat Management Systems, Generators, Others |
| Power Sources Covered | Diesel-Battery, Diesel-Solar, Diesel-Wind, Multiple Sources |
| Grid Types Covered | On Grid, Off Grid, Bad Grid |
| Countries Covered | United States, Canada |
| Companies Covered | Ascot Group, Alpha Technologies, General Electric, Eaton Corp PLC, Huawei Technologies, ZTE Corporation, Schneider Electric SE, Cummins Inc., Delta Group, ABB Group, etc. |
| Customization Scope | 10% Free Customization |
| Post-Sale Analyst Support | 10-12 Weeks |
| Delivery Format | PDF and Excel through Email (We can also provide the editable version of the report in PPT/Word format on special request) |
Key Benefits for Stakeholders:
- IMARC’s report offers a comprehensive quantitative analysis of various market segments, historical and current market trends, market forecasts, and dynamics of the North America telecom power systems market from 2020-2034.
- The research study provides the latest information on the market drivers, challenges, and opportunities in the North America telecom power systems market.
- Porter's Five Forces analysis assists stakeholders in assessing the impact of new entrants, competitive rivalry, supplier power, buyer power, and the threat of substitution. It helps stakeholders to analyze the level of competition within the North America telecom power systems industry and its attractiveness.
- Competitive landscape allows stakeholders to understand their competitive environment and provides an insight into the current positions of key players in the market.
Frequently Asked Questions About the North America Telecom Power Systems Market Report
The North America telecom power systems market was valued at USD 2.4 Billion in 2025.
The market is driven by increasing demand for reliable and energy-efficient power solutions, the growing reliance on 4G and 5G technologies, expansion of data centers, the shift to renewable energy, and advancements in energy storage and power management systems.
IMARC estimates the North America telecom power systems market to exhibit a CAGR of 8.04% during 2026-2034, reaching USD 5.0 Billion by 2034.
The DC (Direct Current) systems segment holds the largest market share due to their efficiency in powering telecom infrastructure, low energy losses, and suitability for remote sites.
Need more help?
- Speak to our experienced analysts for insights on the current market scenarios.
- Include additional segments and countries to customize the report as per your requirement.
- Gain an unparalleled competitive advantage in your domain by understanding how to utilize the report and positively impacting your operations and revenue.
- For further assistance, please connect with our analysts.
 Request Customization
 Speak to an Analyst
 Request Brochure
 Inquire Before Buying
Benefits of Customization
- Personalize this research
- Triangulate with your data
- Get data as per your format and definition
- Gain a deeper dive into a specific application, geography, customer, or competitor
- Any level of personalization
Get in Touch With Us
UNITED STATES
Phone: +1-201-971-6302
INDIA
Phone: +91-120-433-0800
UNITED KINGDOM
Phone: +44-753-714-6104
Email: [email protected]
Client Testimonials


.webp)


