
Output Management Software Market Size, Share, Trend and Forecast by Component, Deployment Type, Organization Size, Vertical, and Region, 2026-2034
Output Management Software Market Size and Share:
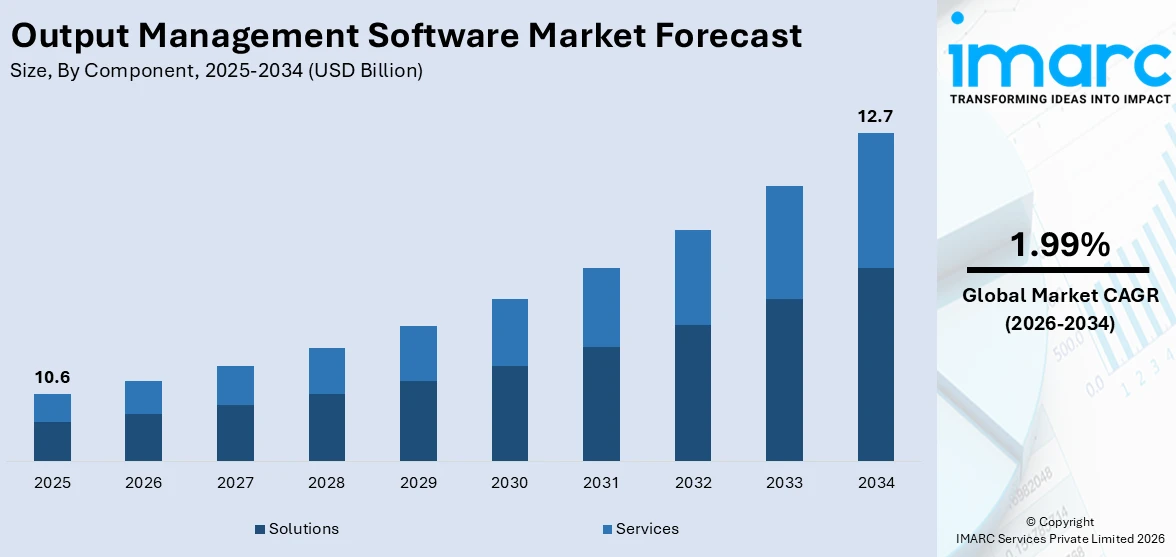
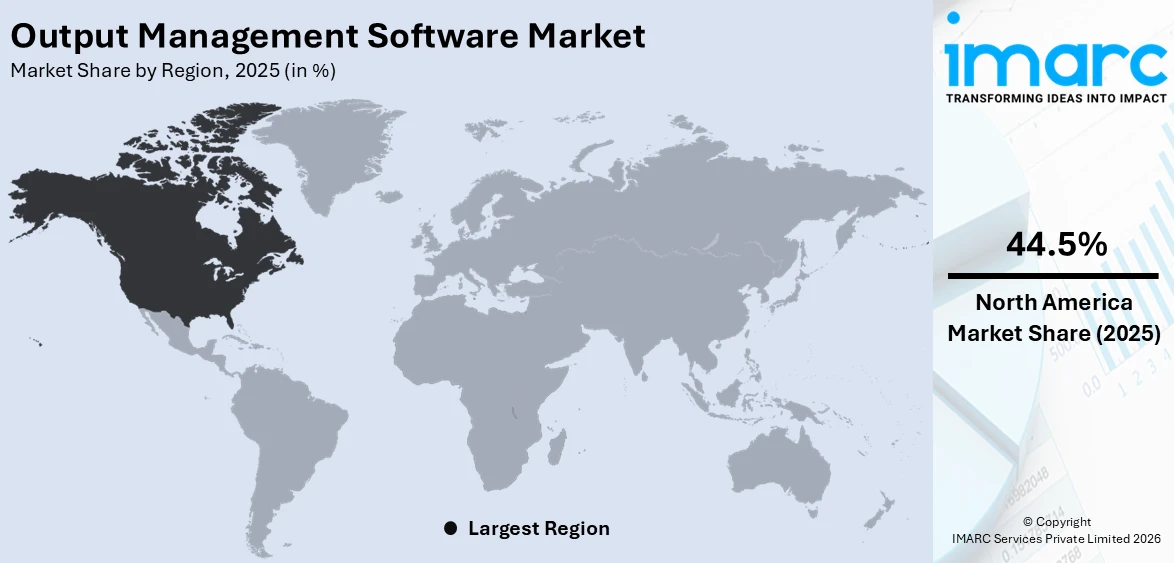
The global output management software market size was valued at USD 10.6 Billion in 2025. Looking forward, IMARC Group estimates the market to reach USD 12.7 Billion by 2034, exhibiting a CAGR of 1.99% during 2026-2034. North America currently dominates the market, holding a significant market share of over 44.5% in 2025, driven by high digital adoption, cloud-based solutions, AI-powered automation, and strong demand for secure document management across BFSI, healthcare, and IT sectors.
|
Report Attribute
|
Key Statistics
|
|---|---|
|
Base Year
|
2025
|
|
Forecast Years
|
2026-2034
|
|
Historical Years
|
2020-2025
|
|
Market Size in 2025
|
USD 10.6 Billion |
|
Market Forecast in 2034
|
USD 12.7 Billion |
| Market Growth Rate 2026-2034 | 1.99% |
The expanding trend for digital transformation programs and workflow automation in businesses is driving the output management software market growth. Enterprises are concentrating increasingly on streamlining documentation workflows for lower operation costs and higher regulatory compliance. The OMS provides a possibility for a flawless, multi-channel delivery of output and a secure data management, thus increasing overall efficiency. The trend towards cloud and hybrid provisioning of IT environment are further promoting the entry of new business users into document output processes. For instance, in November 2024, Broadcom Inc. and Telia Company announced the extension of their partnership through a multi-year agreement, enabling Telia to modernize and enhance its telecom and cloud infrastructure using the VMware product portfolio. Additionally, the demand for paperless operations, data security, and compliance with evolving regulations continues to fuel market growth, particularly in sectors such as healthcare, BFSI, and manufacturing. This also represents one of the key output management software market trends.
To get more information on this market Request Sample
The United States plays a pivotal role in the Output Management Software (OMS) market, serving as a hub for technological innovation, software development, and enterprise adoption. Leading US-based companies are investing in cloud-based solutions, AI-driven automation, and secure document management, addressing the increasing demand for efficiency, compliance, and cost reduction. For instance, in September 2024, Smartsheet's $8.4 billion acquisition by Blackstone and Vista Equity Partners highlights renewed private equity interest in output management software, driven by the rising demand for workflow automation, document management, and digital transformation solutions across enterprises. With a strong presence of BFSI, healthcare, and IT industries, the US drives R&D advancements and global software exports. Additionally, stringent data security regulations and evolving digital transformation initiatives push organizations to integrate scalable and multi-platform OMS solutions, reinforcing the country’s leadership in the global market.
Output Management Software Market Trends:
Growing Adoption in IT Industry
The growing information technology (IT) industry, along with the emerging trend of automation across the globe, represent as the key factors driving the growth of the market. According to India Brand Equity Foundation, the IT spending in India is estimated to record a double-digit growth of 11.1% in 2024, totalling USD 138.6 Billion up from USD 124.7 Billion last year. The OMS makes it convenient for organizations to expand the network of their printing tools for producing, managing and distributing the business output information across various locations. This eliminates the requirement for additional printing devices across multiple organizational departments, thereby enhancing the cost-efficiency and productivity of the organization.
Increasing Product Adoption in Healthcare Sector
Furthermore, increasing product adoption in the healthcare sector is also providing a boost to the market growth. According to Invest India’s Investment Grid, there are nearly 600 investment opportunities worth USD 32 Billion (INR 2.3 Lakh Crore) in the country’s hospital/medical infrastructure sub-sector. OMS solutions are employed in various healthcare centers to assist clinicians in gaining convenient access to large amounts of data and ensure the seamless delivery of system-generated documents to the patients. Other factors, such as outsourcing of these solutions and shifting consumer preference toward paperless operations, are also projected to intensify the output management software market demand.
AI-Driven Automation and Advanced Analytics
Artificial intelligence (AI) and machine learning (ML) are revolutionizing the OMS landscape by enabling intelligent document processing, automated report generation, and predictive analytics. AI-driven OMS platforms enhance document distribution efficiency, reduce human errors, and optimize resource utilization. Businesses are increasingly leveraging AI-powered solutions to analyze document workflows, detect inefficiencies, and provide actionable insights for process improvements. Furthermore, natural language processing (NLP) and AI-powered chatbots are being integrated into OMS platforms to enhance user experience and support automated document handling. For instance, in April 2024, SAS Institute Inc. enhances SAS Viya with AI assistants, SAS Data Maker, and Viya Workbench, enabling businesses to integrate GPT-4 and Gemini Pro into existing workflows for advanced AI-driven analytics and automation. These advancements are helping enterprises improve productivity, regulatory compliance, and operational efficiency.
Output Management Software Industry Segmentation:
IMARC Group provides an analysis of the key trends in each segment of the global output management software market, along with forecast at the global, regional, and country levels from 2026-2034. The market has been categorized based on component, deployment type, organization size, and vertical.
Analysis by Component:
- Solutions
- Services
Solutions stand as the largest component in 2025, holding around 74.3% of the market. This dominance is attributed to the increasing demand for cloud-based and on-premise OMS solutions that streamline document workflow automation, multi-channel output delivery, and secure data management. Businesses across industries such as BFSI, healthcare, manufacturing, and IT are investing in AI-driven OMS platforms to enhance efficiency, regulatory compliance, and cost optimization. Additionally, advancements in AI, machine learning, and cybersecurity are further boosting demand for intelligent document processing and output optimization. As enterprises prioritize digital transformation, the demand for scalable and customizable OMS solutions is expected to grow, reinforcing their market dominance.
Analysis by Deployment Type:
- Cloud-based
- On-premises
Cloud-based leads the market with around 70% of market share in 2025. This leadership is driven by the increasing adoption of cloud computing, digital transformation, and hybrid IT infrastructures across industries such as BFSI, healthcare, manufacturing, and IT. Organizations are prioritizing scalable, cost-effective, and secure document management solutions, making cloud-based OMS a preferred choice over traditional on-premise systems. The integration of AI, machine learning, and advanced data analytics further enhances cloud OMS capabilities, improving workflow automation, compliance, and multi-platform accessibility. As businesses continue to embrace remote work environments and paperless operations, the demand for cloud-based OMS solutions is expected to grow, reinforcing their market leadership.
Analysis by Organization Size:
- Large Enterprises
- Small and Medium Enterprises
Large enterprises leads the market with around 75.4% of market share in 2025. This dominance is driven by the increasing need for scalable, secure, and efficient document management solutions across industries such as BFSI, healthcare, manufacturing, and IT. Large organizations require advanced OMS solutions to manage high-volume document workflows, ensure regulatory compliance, and optimize operational efficiency. The integration of AI, automation, and cloud-based platforms further enhances their ability to streamline multi-channel output delivery and document security. With growing investments in digital transformation and hybrid IT infrastructures, large enterprises are accelerating the adoption of customizable and high-performance OMS platforms, reinforcing their leadership in the global market.
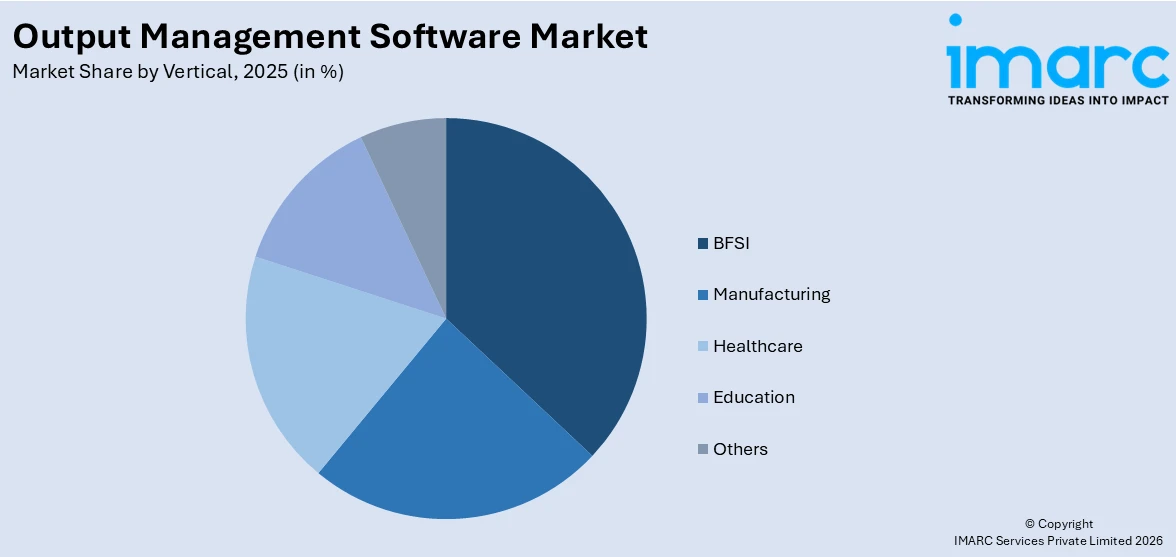
Analysis by Vertical:
Access the comprehensive market breakdown Request Sample
- BFSI
- Manufacturing
- Healthcare
- Education
- Others
BFSI leads the market with around 25.4% of output management software market share in 2025. This leadership is driven by the industry's increasing need for secure, efficient, and compliant document management solutions to handle high-volume transactional data, regulatory reporting, and customer communications. Financial institutions rely on OMS platforms to automate document workflows, enhance multi-channel output delivery, and maintain compliance with strict financial regulations. The integration of AI, machine learning, and cloud-based solutions further strengthens risk management, fraud detection, and customer engagement. As BFSI firms continue investing in digital transformation and cybersecurity, the demand for advanced OMS solutions is expected to grow, reinforcing the sector's dominance.
Regional Analysis:
To get more information on the regional analysis of this market Request Sample
- North America
- United States
- Canada
- Asia Pacific
- China
- Japan
- India
- South Korea
- Australia
- Indonesia
- Others
- Europe
- Germany
- France
- United Kingdom
- Italy
- Spain
- Russia
- Others
- Latin America
- Brazil
- Mexico
- Others
- Middle East and Africa
In 2025, North America accounted for the largest market share of over 44.5%. This dominance is driven by the region's strong presence of leading technology firms, high adoption of digital transformation strategies, and increasing demand for cloud-based solutions across industries such as BFSI, healthcare, IT, and manufacturing. Organizations in North America prioritize workflow automation, regulatory compliance, and data security, driving investments in AI-powered OMS solutions. The rapid expansion of hybrid cloud environments, cybersecurity initiatives, and remote work adoption further fuels demand. With growing advancements in machine learning, predictive analytics, and intelligent document processing, North America is expected to maintain its leadership in the OMS market, fostering continued innovation and expansion.
Key Regional Takeaways:
United States Output Management Software Market Analysis
US accounts for 82.6% share of the market in North America. In the United States, growing output management software adoption is driven by the increasing shift toward cloud services. According to reports, 98% of U.S. organizations have adopted cloud technology for business operations. Cloud platforms offer scalability, flexibility, and cost-effectiveness, making it easier for organizations to manage and optimize their document and print processes. The cloud's ability to integrate seamlessly with various systems and streamline workflows has become an essential factor in supporting digital transformation strategies. With businesses looking for efficient solutions to handle their output processes in a more centralized and automated way, cloud-based output management software is seeing widespread implementation across multiple industries. This trend is further accelerated by the need for real-time monitoring, improved document security, and the reduction of on-premises infrastructure costs. As cloud adoption continues to grow, output management software becomes a crucial tool for businesses aiming to enhance productivity, reduce overhead costs, and improve customer service.
Asia Pacific Output Management Software Market Analysis
In the Asia-Pacific region, output management software adoption is experiencing growth due to the rising number of small and medium enterprises (SMEs). According to India Brand Equity Foundation, the number of MSMEs in the country is projected to grow from 6.3 crore to around 7.5 crore at a CAGR of 2.5%. As SMEs rapidly expand, they require solutions that can streamline document and print management while reducing operational complexities. Output management software addresses these challenges by automating document workflows, enhancing communication, and reducing waste. These benefits are particularly appealing to SMEs in the region, which are looking for cost-effective, scalable solutions. The increasing reliance on digital technologies and the need for more efficient ways to handle output processes further boost the demand for these solutions. As SMEs focus on optimizing their operations, output management software provides a practical tool for managing and improving document workflows, contributing to growth in the region.
Europe Output Management Software Market Analysis
In Europe, output management software adoption is growing due to the increasing demand from the BFSI sector. According to reports, there were 784 foreign bank branches in the EU in 2021, of which 619 were from other EU Member States and 165 from third countries. The banking, financial services, and insurance (BFSI) industry requires highly secure, reliable, and efficient systems for managing the vast amounts of documents and communications they handle daily. Output management software offers a solution that helps organizations streamline document processes, reduce manual work, and ensure compliance with industry regulations. It facilitates seamless integration with existing infrastructures, ensuring secure distribution of sensitive financial documents while minimizing errors and processing time. As BFSI organizations face growing pressures to enhance efficiency and reduce operational costs, the adoption of output management software becomes critical for improving service delivery, minimizing waste, and maintaining regulatory compliance, further driving its adoption across Europe.
Latin America Output Management Software Market Analysis
In Latin America, the healthcare sector's expansion is driving the growing adoption of output management software. According to the Federal of Brazilian Hospitals (FBH) and the CN Saúde (National Confederation of Health), of the 7,191 private hospitals in Brazil, 62 percent are indeed private. With increasing healthcare demands and a focus on improving operational efficiency, hospitals, clinics, and medical centres are turning to output management software to streamline their document processes. This software aids in automating patient records, insurance claims, and medical billing, while also ensuring data security and compliance with healthcare regulations. As the healthcare sector continues to grow, these software solutions help reduce administrative burdens, enhance workflow automation, and improve patient service delivery. The demand for better, more efficient management of healthcare documents is a key factor pushing the adoption of output management software in the region.
Middle East and Africa Output Management Software Market Analysis
Middle East and Africa: In the Middle East and Africa, the growing education sector is driving the adoption of output management software. For instance, according to the Knowledge and Human Development Authority, the Middle East is the home of over 500 business schools; 38,000 of those students study in higher education institutions in Dubai alone. Educational institutions require efficient document management systems to handle administrative tasks, such as grading reports, certificates, student records, and other academic outputs. As the education sector embraces digital transformation, there is an increasing need for software solutions that streamline these processes and ensure accurate, timely distribution of documents. Output management software enables educational institutions to automate tasks, reduce paper usage, and improve communication with students and parents.
Competitive Landscape:
The Output Management Software (OMS) market is highly competitive, with key players focusing on technological advancements, cloud integration, and security enhancements to gain a competitive edge. Leading companies dominate the market, offering scalable and multi-platform solutions. Startups and emerging firms are driving innovation with AI-powered automation, document workflow optimization, and enhanced analytics. Strategic partnerships, mergers, and acquisitions are shaping the industry, while growing demand for hybrid cloud solutions and compliance-driven output management is intensifying competition. For instance, In December 2024, Xerox announced a $1.5 billion acquisition of Lexmark International, expanding its print portfolio and enhancing global managed print services to meet evolving hybrid workplace demands and client needs. Market players are also emphasizing cost-effective and customizable OMS solutions to cater to diverse industries.
The report provides a comprehensive analysis of the competitive landscape in the output management software market with detailed profiles of all major companies, including:
- Broadcom Inc.
- DocPath Corporation
- HP Development Company
- Kyocera Corporation
- LBM Systems
- Levi Ray & Shoup Inc.
- Lexmark International
- Quadient
- Plus Technologies LLC
- Ricoh Company
- Rochester Software Associates Inc.
Latest News and Developments:
- January 2025: AI-based SimplifyDocs.AI software for document generation and translation commenced on the market by Simplify Healthcare. The solution streamlines print and digital output for easy compliance for doc go-lightly; manual work is eliminated from work for gains' sake in document output and translation management.
- December 2024: From Sonata Software comes IntellQA, the AI/ML-powered testing automation product to enhance output management in software delivery. It supports Agile and DevOps while providing seamless integration with enterprise tools like Jira and Azure DevOps. IntellQA focuses on optimizing test coverage while reducing script maintenance efforts and framework costs for global enterprises.
- November 2024: Vasion is proud to present Output Automation, a cloud-native platform with changing the paradigm of output management and workflow automation. This innovation is simplifying document workflows and improving operational efficiency thus conforming to the rising demand for scalable, cloud-based output management solutions.
- November 2024: It-motive is partnering with InterForm to intensify its output management capabilities by adding some sophisticated advanced solutions to its service portfolio. This partnership is engaged in the streamlining of document processes to ultimately introduce innovative output management services to enterprises.
- May 2024: August Bridge associates with Docentric to boost output management capabilities. The much-acclaimed partnership mainly is in the area of enhancing document generation and customization processes that help enterprises speed up the workflow.
- February 2024: Gooten launches OrderMesh™, advanced order management software designed for on-demand production. It is targeted at retailers, marketplaces, and manufacturers, allowing for the streamlined processing of orders, minimizing the complexities of the supply chain, and ideally improving efficiencies for eCommerce brands looking to expand their offerings.
Output Management Software Market Report Coverage:
| Report Features | Details |
|---|---|
| Base Year of the Analysis | 2025 |
| Historical Period | 2020-2025 |
| Forecast Period | 2026-2034 |
| Units | Billion USD |
| Scope of the Report |
Exploration of Historical Trends and Market Outlook, Industry Catalysts and Challenges, Segment-Wise Historical and Future Market Assessment:
|
| Components Covered | Solutions, Services |
| Deployment Types Covered | Cloud-based, On-premises |
| Organization Sizes Covered | Large Enterprises, Small and Medium Enterprises |
| Verticals Covered | BFSI, Manufacturing, Healthcare, Education, Others |
| Regions Covered | Asia Pacific, Europe, North America, Latin America, Middle East and Africa |
| Countries Covered | United States, Canada, Germany, France, United Kingdom, Italy, Spain, Russia, China, Japan, India, South Korea, Australia, Indonesia, Brazil, Mexico |
| Companies Covered | Broadcom Inc., DocPath Corporation, HP Development Company, Kyocera Corporation, LBM Systems, Levi Ray & Shoup Inc., Lexmark International, Quadient, Plus Technologies LLC, Ricoh Company, Rochester Software Associates Inc. |
| Customization Scope | 10% Free Customization |
| Post-Sale Analyst Support | 10-12 Weeks |
| Delivery Format | PDF and Excel through Email (We can also provide the editable version of the report in PPT/Word format on special request) |
Key Benefits for Stakeholders:
- IMARC’s report offers a comprehensive quantitative analysis of various market segments, historical and current market trends, market forecasts, and dynamics of the output management software market from 2020-2034.
- The research study provides the latest information on the market drivers, challenges, and opportunities in the global output management software market.
- The study maps the leading, as well as the fastest-growing, regional markets. It further enables stakeholders to identify the key country-level markets within each region.
- Porter's Five Forces analysis assists stakeholders in assessing the impact of new entrants, competitive rivalry, supplier power, buyer power, and the threat of substitution. It helps stakeholders to analyze the level of competition within the output management software industry and its attractiveness.
- Competitive landscape allows stakeholders to understand their competitive environment and provides an insight into the current positions of key players in the market.
Frequently Asked Questions About the Output Management Software Market Report
The output management software market was valued at USD 10.6 Billion in 2025.
IMARC estimates the output management software market to reach USD 12.7 Billion by 2034, exhibiting a CAGR of 1.99% during 2026-2034.
The output management software market is driven by rising digital transformation, cloud adoption, and AI-driven automation. Increasing demand for workflow efficiency, regulatory compliance, and secure document management across BFSI, healthcare, and IT sectors, along with advancements in hybrid cloud solutions and cybersecurity, further accelerates market growth.
North America currently dominates the market with 44.5% share, driven by high digital adoption, strong presence of leading OMS providers, and increasing demand for AI-powered workflow automation, cloud-based solutions, and regulatory compliance across BFSI, healthcare, and IT sectors, positioning the region as a leader in innovation and technological advancements.
Some of the major players in the output management software market include Broadcom Inc., DocPath Corporation, HP Development Company, Kyocera Corporation, LBM Systems, Levi Ray & Shoup Inc., Lexmark International, Quadient, Plus Technologies LLC, Ricoh Company and Rochester Software Associates Inc., etc.
Need more help?
- Speak to our experienced analysts for insights on the current market scenarios.
- Include additional segments and countries to customize the report as per your requirement.
- Gain an unparalleled competitive advantage in your domain by understanding how to utilize the report and positively impacting your operations and revenue.
- For further assistance, please connect with our analysts.
 Request Customization
 Speak to an Analyst
 Request Brochure
 Inquire Before Buying
Benefits of Customization
- Personalize this research
- Triangulate with your data
- Get data as per your format and definition
- Gain a deeper dive into a specific application, geography, customer, or competitor
- Any level of personalization
Get in Touch With Us
UNITED STATES
Phone: +1-201-971-6302
INDIA
Phone: +91-120-433-0800
UNITED KINGDOM
Phone: +44-753-714-6104
Email: [email protected]
Client Testimonials


.webp)


