
Paraffin Wax Prices, Trend, Chart, Demand, Market Analysis, News, Historical and Forecast Data Report 2026 Edition
Paraffin Wax Price Trend, Index and Forecast
Track real-time and historical paraffin wax prices across global regions. Updated monthly with market insights, drivers, and forecasts.
Paraffin Wax Prices June 2026
| Region | Price (USD/Kg) | Latest Movement |
|---|---|---|
| Africa | 1.59 | -18.0% ↓ Down |
| Northeast Asia | 0.7 | -12.5% ↓ Down |
| Europe | 1.94 | -10.2% ↓ Down |
| Southeast Asia | 1.15 | -9.4% ↓ Down |
| North America | 1.04 | -14.8% ↓ Down |
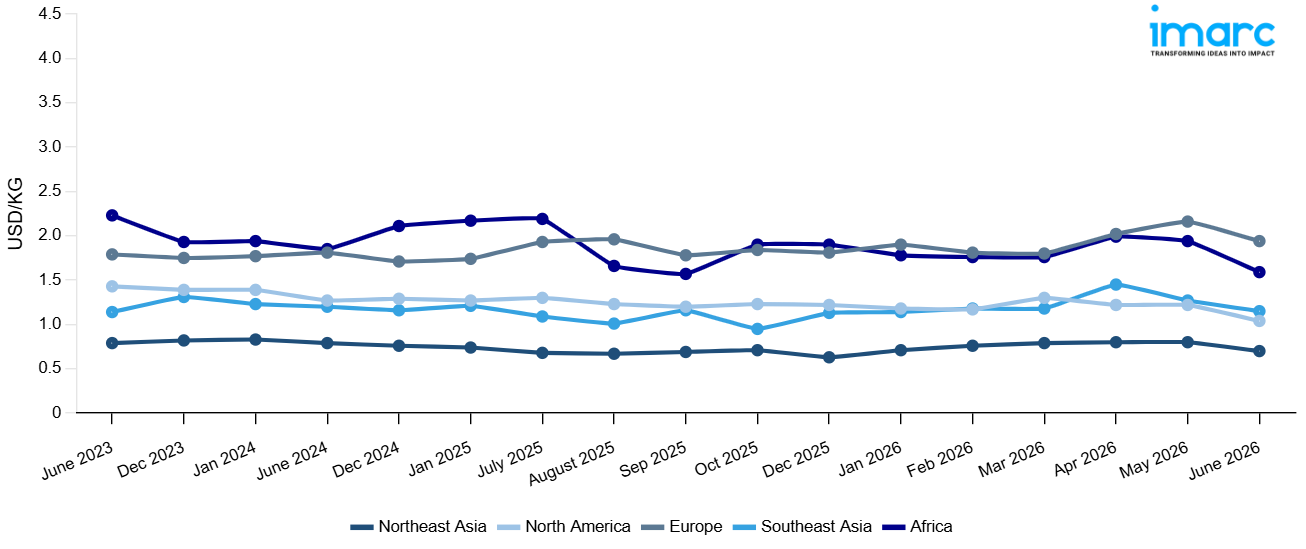
Paraffin Wax Price Index (USD/KG):
The chart below highlights monthly paraffin wax prices across different regions.
Get Access to Monthly/Quarterly/Yearly Prices, Request Sample
Market Overview Q1 Ending March 2026
Africa: The paraffin wax prices in Africa reached 1.76 USD/KG in March 2026. The downward pricing movement registered between December and March 2026 was 7.4%. This significant fall in prices was influenced by the decrease in demand from the candle manufacturing and packaging coatings industries, which eased up on purchases due to low demand in the region. This was further exacerbated by a decrease in prices of crude oil and slack wax, which are the raw materials used in the production of paraffin wax in the region. An increase in the supply of competitively priced imports contributed to the downward pressure on the prevailing prices in the region. This was further exacerbated by a high level of inventory held by the main distributors in the region, which eased the pressure on the prices.
Northeast Asia: The paraffin wax prices in Northeast Asia reached 0.79 USD/KG in March 2026. The upward pricing movement registered between December and March 2026 was 25.4%. The substantial price appreciation was primarily driven by tightened supply conditions resulting from reduced refinery output and constrained slack wax availability, significantly limiting regional volumes. Robust demand from the candle manufacturing, cosmetics, and food packaging sectors intensified procurement competition amid limited spot market availability. Escalating upstream crude oil benchmark valuations further elevated production expenses for regional refiners and processors. Additionally, heightened consumption from the rubber processing and industrial coating segments sustained strong fundamentals, while strategic inventory building by downstream consumers anticipating continued supply tightness amplified purchasing urgency.
Europe: The paraffin wax prices in Europe reached 1.8 USD/KG in March 2026. The downward pricing movement registered between December and March 2026 was 0.6%. This minimal price reduction is indicative of a largely stable market environment, driven by moderate demand from the candle production, packaging, and cosmetics formulation industries, which maintained consistent procurement volumes throughout the quarter. Softer crude oil and wax feedstock costs also contributed to marginal downward pressure on the regional refineries' production economics. Favorable supply levels from established processing facilities ensured comfortable inventory levels, with consistent demand from the food grade coating and pharmaceutical segments supporting the baseline fundamentals.
Southeast Asia: The paraffin wax prices in Southeast Asia reached 1.18 USD/KG in March 2026. The upward pricing movement registered between December and March 2026 was 4.4%. The moderate price appreciation was driven by firm demand from the candle, rubber processing, and packaging coating sectors, which maintained robust procurement activity amid stable downstream consumption patterns across the region. Rising upstream crude oil and slack wax feedstock costs elevated production expenses for regional processors, reinforcing upward pricing dynamics. Constrained import availability amid elevated international benchmark valuations further limited spot market volumes, amplifying procurement competition among downstream consumers.
North America: The paraffin wax prices in North America reached 1.3 USD/KG in March 2026. The upward pricing movement registered between December and March 2026 was 6.6%. The significant price increase was fueled by strong procurement demand from the candle making, food packaging, and personal care product industries. Firm upstream crude oil and slack wax raw material prices fueled higher production costs for domestic processors and refiners, thereby supporting prices. Supply constraints were further fueled by reduced refinery wax supply due to a shift in refinery optimization towards lighter distillate products. High logistics and transportation costs from key refinery centers further supported prices, while continued demand from the industrial coating and rubber compounding segments maintained strong fundamentals of the output, thereby sustaining a bullish price trend throughout the quarter.
Market Overview Q4 Ending December 2025
Africa: The paraffin wax prices in Africa reached 1.90 USD/KG in December 2025. The upward pricing movement registered between September and December 2025 was 21.3%. The substantial price appreciation was primarily driven by tightened supply conditions resulting from reduced refinery output and constrained domestic production capacity, significantly limiting regional paraffin wax availability. Robust demand from the candle manufacturing and packaging coating sectors intensified procurement competition amid limited spot market volumes. Elevated upstream crude oil and slack wax feedstock costs further increased production expenses for regional refiners, reinforcing upward pricing dynamics. Additionally, heightened seasonal consumption ahead of the festive period amplified off-take pressure, while logistical bottlenecks in distribution networks restricted timely supply replenishment, sustaining pronounced bullish pricing momentum throughout the quarter.
Northeast Asia: The paraffin wax prices in Northeast Asia reached 0.63 USD/KG in December 2025. The downward pricing movement registered between September and December 2025 was 9.2%. The notable price decline was driven by weakened downstream demand from the candle, cosmetics, and food packaging sectors, which moderated procurement volumes amid subdued consumer goods consumption across the region. Declining upstream crude oil and slack wax feedstock costs further diminished production cost benchmarks for regional refiners. Elevated inventory levels among major producers intensified competitive discounting strategies to accelerate stock clearance, while surplus refinery output maintained ample market availability. Tepid export enquiries from traditional trading partners provided limited offtake support, while cautious procurement strategies adopted by downstream consumers sustained bearish pricing conditions throughout the quarterly period.
Europe: The paraffin wax prices in Europe reached 1.81 USD/KG in December 2025. The upward pricing movement registered between September and December 2025 was 1.9%. The constant demand from the manufacturing, packaging, and cosmetics formulation industries, which sustained procurement activity throughout the quarter, supported the modest price increase. Regional refiners and processors received additional pricing assistance from stable upstream crude oil and slack wax feedstock values. Rising cost constraints throughout the supply chain were further exacerbated by high energy costs related to refining and de-oiling processes. Furthermore, balanced supply availability was maintained by controlled production output from well-established manufacturers, and strong fundamentals were maintained by increased seasonal consumption prior to the winter period, which contributed to somewhat bullish pricing conditions throughout the quarter.
Southeast Asia: The paraffin wax prices in Southeast Asia reached 1.13 USD/KG in December 2025. The downward pricing movement registered between September and December 2025 was 2.8%. The price softening was attributed to subdued demand from the candle, rubber processing, and packaging coating sectors, which moderated procurement volumes amid cautious consumer spending patterns across the region. Increased import availability from competitively priced cargoes exerted additional downward pressure on prevailing market rates, while softening upstream slack-wax feedstock costs diminished production-cost support for regional processors. Elevated stockpile positions among key distributors dampened restocking urgency, while moderate consumption in the cosmetics and food-grade paraffin segments provided only limited pricing support, sustaining mildly bearish market conditions throughout the quarter.
North America: The paraffin wax prices in North America reached 1.22 USD/KG in December 2025. The upward pricing movement registered between September and December 2025 was 1.7%. Consistent demand from the food packaging, personal care, and candle-making industries, which maintained steady procurement schedules throughout the quarter, supported the marginal price increase. Firm upstream crude oil and slack wax feedstock costs gave additional pricing assistance to domestic refiners and processors. Controlled production output from established refining facilities ensured balanced supply availability, minimizing market oversaturation. Moderate consumption in the industrial coating and rubber compounding segments supported baseline offtake fundamentals, while stable logistics and distribution costs reinforced delivered pricing levels, resulting in moderately bullish but largely stable market conditions over the quarter.
Market Overview Q3 Ending September 2025
Africa: In Africa, paraffin wax prices softened as demand from the packaging and candle-making sectors eased amid weaker consumer spending. The paraffin wax price index indicated lower procurement activity from cosmetics and pharmaceuticals, which further weighed on regional consumption. Adequate imports, supported by stable feedstock supply from petroleum refining, kept supply levels sufficient, contributing to the bearish trend. Additionally, reduced export activity limited price resilience, pushing values downward in this quarter.
Northeast Asia: In Northeast Asia, paraffin wax prices edged upward due to firm demand from the packaging and electronics sectors. The paraffin wax price index reflected rising consumption in cosmetics and personal care applications, while steady demand from the candle industry also provided support. Supply disruptions in some refining hubs and tighter logistics slightly constrained availability, lending strength to regional pricing. Overall, stable feedstock costs and a balanced demand-supply scenario kept sentiment cautiously positive.
Europe: In Europe, paraffin wax prices declined notably as consumption from packaging and industrial applications weakened. The paraffin wax price index showed downward momentum due to subdued demand from the cosmetics and pharmaceutical industries, combined with high inventory levels among distributors. Falling feedstock costs and reduced refinery utilization rates further contributed to bearish sentiment. Import competition and cautious buying behavior among end-users reinforced the downward trajectory, putting additional pressure on domestic suppliers.
Southeast Asia: In Southeast Asia, paraffin wax prices increased strongly, driven by heightened demand from the candle-making industry and steady consumption in packaging applications. The paraffin wax price index was supported by robust procurement from the cosmetics and personal care sectors, while higher regional exports further bolstered prices. Limited refinery output and temporary supply bottlenecks in certain markets contributed to tighter availability, amplifying the upward movement and creating a bullish sentiment across the region this quarter.
North America: In North America, paraffin wax prices eased as demand from packaging and industrial sectors moderated. The paraffin wax price index reflected weaker activity in the candle and cosmetics markets, which weighed on regional consumption. Ample domestic refinery output ensured adequate supply, while stable feedstock availability limited opportunities for upward adjustments. Competitive imports and cautious downstream procurement further pressured the market, resulting in modest price declines this quarter.
Paraffin Wax Price Trend, Market Analysis, and News
IMARC's latest publication, “Paraffin Wax Prices, Trend, Chart, Demand, Market Analysis, News, Historical and Forecast Data Report 2026 Edition,” presents a detailed examination of the paraffin wax market, providing insights into both global and regional trends that are shaping prices. This report delves into the spot price of paraffin wax at major ports and analyzes the composition of prices, including FOB and CIF terms. It also presents detailed paraffin wax prices trend analysis by region, covering North America, Europe, Asia Pacific, Latin America, and Middle East and Africa. The factors affecting paraffin wax pricing, such as the dynamics of supply and demand, geopolitical influences, and sector-specific developments, are thoroughly explored. This comprehensive report helps stakeholders stay informed with the latest market news, regulatory updates, and technological progress, facilitating informed strategic decision-making and forecasting.
.webp)
Paraffin Wax Industry Analysis
The global paraffin wax industry size reached USD 6.4 Billion in 2025. By 2034, IMARC Group expects the market to reach USD 10.1 Billion, at a projected CAGR of 5.02% during 2026-2034. Growth is driven by increasing demand in packaging, rising use in cosmetics and personal care products, and expanding applications in candles and coatings, supported by advancements in petroleum refining and rising consumption across emerging economies.
Latest developments in the Paraffin Wax Industry:
- June 2025: Lords Chloro Alkali Ltd. announced it plans to double its chlorinated paraffin wax capacity at its Rajasthan plant, raising capacity from 50 TPD to 100 TPD by fiscal 2025–26. This expansion, costing about INR 30 crore and funded via internal accruals and credit, is in response to rising demand and over 80% utilization.
- December 2022: Saudi Aramco, SABIC, and Sinopec announced a collaboration to build a 1.5 million-ton/year petrochemical cracker and a 320,000 barrel/day refinery, with operations expected to commence by end-2025, to expand their petrochemical and refining footprint in China and Saudi Arabia.
- November 2022: Eneos Corporation entered into an agreement with Niigata Public Corporation of Agriculture and Forestry to further forest conservation and carbon credit (J credit) generation. This supports Eneos’ goal of reducing CO₂ emissions by 46 % relative to 2013 levels by 2030.
Product Description
Paraffin wax is a white or colorless soft solid derived from petroleum, coal, or oil shale through the dewaxing of light lubricating oil stocks. Chemically, it consists of a mixture of saturated hydrocarbons (alkanes) with carbon chain lengths typically ranging from C20 to C40. It is odorless, tasteless, and insoluble in water but soluble in organic solvents. Paraffin wax is widely used in the candle industry due to its clean-burning properties and ease of molding. In packaging, it provides moisture resistance when applied as coatings on paper and cardboard. Additionally, paraffin wax is utilized in cosmetics, pharmaceuticals, rubber processing, and electrical insulation. Its versatile properties, such as low thermal conductivity and high chemical stability, make it a valuable material across diverse industrial applications.
Report Coverage
| Key Attributes | Details |
|---|---|
| Product Name | Paraffin Wax |
| Report Features | Exploration of Historical Trends and Market Outlook, Industry Demand, Industry Supply, Gap Analysis, Challenges, Paraffin Wax Price Analysis, and Segment-Wise Assessment. |
| Currency/Units | US$ (Data can also be provided in local currency) or Metric Tons |
| Region/Countries Covered | The current coverage includes analysis at the global and regional levels only. Based on your requirements, we can also customize the report and provide specific information for the following countries: Asia Pacific: China, India, Indonesia, Pakistan, Bangladesh, Japan, Philippines, Vietnam, Thailand, South Korea, Malaysia, Nepal, Taiwan, Sri Lanka, Hongkong, Singapore, Australia, and New Zealand* Europe: Germany, France, United Kingdom, Italy, Spain, Russia, Turkey, Netherlands, Poland, Sweden, Belgium, Austria, Ireland, Switzerland, Norway, Denmark, Romania, Finland, Czech Republic, Portugal and Greece* North America: United States and Canada Latin America: Brazil, Mexico, Argentina, Columbia, Chile, Ecuador, and Peru* Middle East & Africa: Saudi Arabia, UAE, Israel, Iran, South Africa, Nigeria, Oman, Kuwait, Qatar, Iraq, Egypt, Algeria, and Morocco* *The list of countries presented is not exhaustive. Information on additional countries can be provided if required by the client. |
| Information Covered for Key Suppliers |
|
| Customization Scope | The report can be customized as per the requirements of the customer |
| Report Price and Purchase Option |
Plan A: Monthly Updates - Annual Subscription
Plan B: Quarterly Updates - Annual Subscription
Plan C: Biannually Updates - Annual Subscription
|
| Post-Sale Analyst Support | 360-degree analyst support after report delivery |
| Delivery Format | PDF and Excel through email (We can also provide the editable version of the report in PPT/Word format on special request) |
Key Benefits for Stakeholders:
- IMARC’s report presents a detailed analysis of paraffin wax pricing, covering global and regional trends, spot prices at key ports, and a breakdown of FOB and CIF prices.
- The study examines factors affecting paraffin wax price trend, including input costs, supply-demand shifts, and geopolitical impacts, offering insights for informed decision-making.
- The competitive landscape review equips stakeholders with crucial insights into the latest market news, regulatory changes, and technological advancements, ensuring a well-rounded, strategic overview for forecasting and planning.
- IMARC offers various subscription options, including monthly, quarterly, and biannual updates, allowing clients to stay informed with the latest market trends, ongoing developments, and comprehensive market insights. The paraffin wax price charts ensure our clients remain at the forefront of the industry.
Frequently Asked Questions About the Paraffin Wax Price Trend Report
The paraffin wax prices in June 2026 were 1.59 USD/KG in Africa, 0.7 USD/KG in Northeast Asia, 1.94 USD/KG in Europe, 1.15 USD/KG in Southeast Asia, and 1.04 USD/KG in North America.
The paraffin wax pricing data is updated on a monthly basis.
We provide the pricing data primarily in the form of an Excel sheet and a PDF.
Yes, our report includes a forecast for paraffin wax prices.
The regions covered include North America, Europe, Asia Pacific, Middle East, and Latin America. Countries can be customized based on the request (additional charges may be applicable).
Yes, we provide both FOB and CIF prices in our report.
Need more help?
- Speak to our experienced analysts for insights on the current market scenarios.
- Include additional segments and countries to customize the report as per your requirement.
- Gain an unparalleled competitive advantage in your domain by understanding how to utilize the report and positively impacting your operations and revenue.
- For further assistance, please connect with our analysts.
 Request Customization
 Inquire Before Buying
 Speak to an Analyst
 Request Brochure
Benefits of Customization
- Personalize this research
- Triangulate with your data
- Get data as per your format and definition
- Gain a deeper dive into a specific application, geography, customer, or competitor
- Any level of personalization
Get in Touch With Us
UNITED STATES
Phone: +1-201-971-6302
INDIA
Phone: +91-120-433-0800
UNITED KINGDOM
Phone: +44-753-714-6104
Email: [email protected]
Client Testimonials


.webp)


Why Choose Us
IMARC offers trustworthy, data-centric insights into commodity pricing and evolving market trends, enabling businesses to make well-informed decisions in areas such as procurement, strategic planning, and investments. With in-depth knowledge spanning more than 1000 commodities and a vast global presence in over 150 countries, we provide tailored, actionable intelligence designed to meet the specific needs of diverse industries and markets.
1000
+Commodities
150
+Countries Covered
3000
+Clients
20
+Industry
Robust Methodologies & Extensive Resources
IMARC delivers precise commodity pricing insights using proven methodologies and a wealth of data to support strategic decision-making.
Subscription-Based Databases
Our extensive databases provide detailed commodity pricing, import-export trade statistics, and shipment-level tracking for comprehensive market analysis.
Primary Research-Driven Insights
Through direct supplier surveys and expert interviews, we gather real-time market data to enhance pricing accuracy and trend forecasting.
Extensive Secondary Research
We analyze industry reports, trade publications, and market studies to offer tailored intelligence and actionable commodity market insights.
Trusted by 3000+ industry leaders worldwide to drive data-backed decisions. From global manufacturers to government agencies, our clients rely on us for accurate pricing, deep market intelligence, and forward-looking insights.