
Party Supplies Market Size, Share, Trends and Forecast by Product Type, Application, Distribution Channel, and Region, 2026-2034
Party Supplies Market Overview:
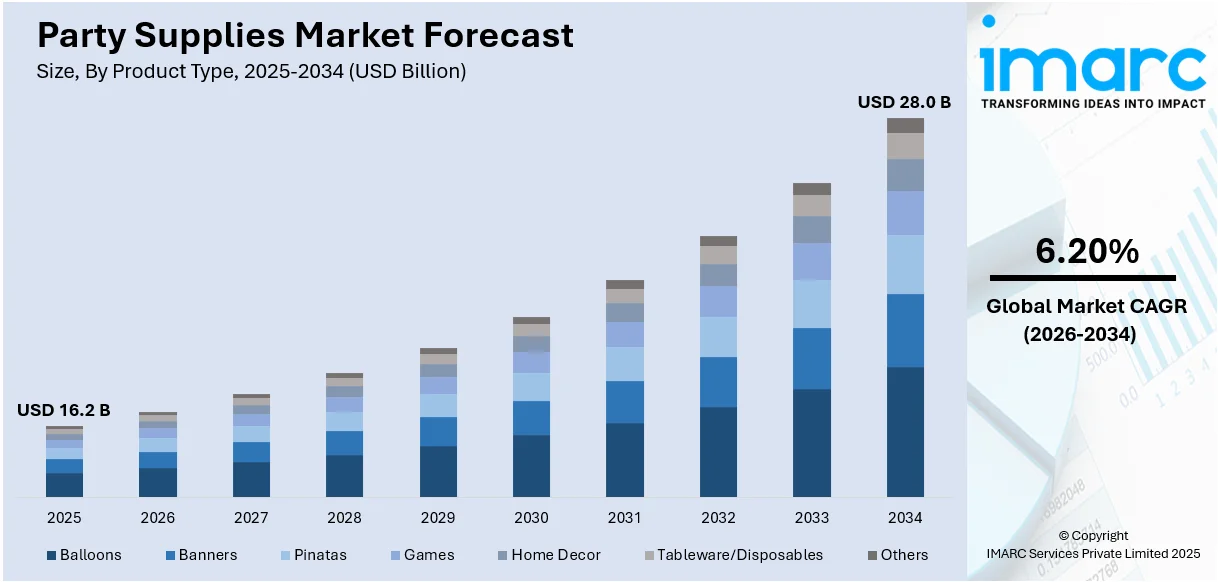
- The Party Supplies market size was valued at USD 16.2 Billion in 2025 and is projected to reach USD 28.0 Billion by 2034.
- The market is estimated to grow at a CAGR of 6.20% from 2026 to 2034.
- Major drivers include significant increase in social celebrations and events, rise in inclination towards online applications and websites, and the growing influence of social media
- In terms of product type, the balloons segment dominates the party supplies market.
- Region wise, North America holds the largest share in the market.
|
Report Attribute
|
Key Statistics
|
|---|---|
|
Base Year
|
2025
|
|
Forecast Years
|
2026-2034
|
|
Historical Years
|
2020-2025
|
|
Market Size in 2025
|
USD 16.2 Billion |
|
Market Forecast in 2034
|
USD 28.0 Billion |
| Market Growth Rate 2026-2034 | 6.20% |
The popularity of social parties and themed parties is the key to the global party supplies market growth. More people are putting emphasis on celebrating personal occasions, like birthdays, weddings, baby showers, and festivals, leading to a boost in demand for party supplies. For example, in November 2024, REAL SIMPLE and Minted introduced a holiday party decor collection, with colorful invitations, wrapping paper, balloons, and personalized designs, designed to deliver stylish and easy holiday entertaining solutions. Furthermore, themed parties have become popular due to social media, with people looking to make visually engaging arrangements to share online. Furthermore, these trends are evident in party supplies market research, which highlights the growing demand for creative and unique party products. Festive and cultural celebrations, such as New Year, Christmas, and Halloween celebrations, also fuel market growth. Moreover, growth in corporate events, such as office parties and product launches, has pushed demand for professional-standard decorations and accessories higher. Online shopping, which has become a convenient way of doing business, has increased party supplies' availability across the globe, promoting industry growth. With increasing disposable incomes and experiential consumption taking center stage, consumers are more than happy to spend on high-quality, personalized, and sustainable party supplies, driving market growth across the world. Concurrent with this, regional trends favoring customized decorations, high-quality products, and convenience-based shopping are further propelling the expansion of the party supplies industry.
To get more information on this market Request Sample
The US party supply industry is experiencing a transition towards sustainability, fueled by growing environmental consciousness among consumers with a market share of 81.80% in 2024. For instance, in September 2024, Albertsons Companies introduced Overjoyed, its first large-scale private label brand in recent years, with rich indulgences, gift-worthy décor, and festive party supplies throughout its retail banners, which add to everyday celebrations. Moreover, single-use plastic party supplies are being substituted with biodegradable, compostable, and recyclable options like paper decorations, bamboo tableware, and reusable fabric banners. This trend is complemented by state and federal regulatory actions limiting the use of single-use plastics. Customers are consciously looking for value-aligned products, and hence the trend of ecofriendly-branded products and handmade party decor using green materials. Online shopping websites and physical stores have integrated environmentally friendly options in their product lines to make them accessible to all. Schools and community organizations are increasingly adopting eco-friendly event supplies to promote sustainability. As awareness grows and regulations tighten, the demand for U.S. party supplies that meet green standards is expected to rise, shaping the industry's future.
Party Supplies Market Trends:
Increase in Social Celebrations and Events
The party supply demand keeps boosting as social events and celebrations increase, such as birthdays, weddings, graduations, and holidays. Destination weddings specifically have witnessed tremendous growth, going up from 18% in 2022 to 21% in 2023 and 26% in 2024. With people and communities putting more weight on life milestones celebrations, the party decoration, tableware, and themed accessories market is growing. With changing consumer tastes, customized and high-quality party supplies are becoming highly popular, complementing the event experience. Baby showers and corporate events are also fueling this trend, encouraging demand for bespoke and exclusive décor. Event planners and party planners are also looking for innovative and visually stimulating solutions to meet the rising expectations of customers. The growth of such a market represents the changing lifestyles and the increasingly significant role being played by social events in guiding consumer expenditure behavior.
Rise in Inclination Towards Online Applications and Websites
The ease of online buying has revolutionized the party supply sector, making consumers able to enjoy a huge inventory of goods offered by several sellers. Online buying has emerged into a USD 6.8 trillion sector that is set to reach USD 8 trillion in 2027, given that more than 33% of the world's population purchases items online. Internet platforms allow hassle-free access to personalized, thematic, and premium party supplies, improving customer experience and business development. The convenience of price comparison, review reading, and doorstep delivery has also accelerated the move to online buying. Direct-to-consumer (DTC) brands and marketplaces are using digital technology to provide an individualized shopping experience with handpicked collections and automated recommendations. The availability of same-day and next-day delivery options has also done away with last-minute in-store runs. As technology continues to advance, augmented reality (AR) platforms and interactive tools are expected to transform the party supplies sector by providing virtual event setup previews.
Growing Influence of Social Media
Social media sites have transformed the party supplies market by influencing consumer tastes and driving market trends. US influencer marketing expenditure is expected to hit USD 7.14 billion in 2024, a 15.9% year-over-year increase. Sites such as Instagram, Pinterest, and TikTok have emerged as primary sources of inspiration for party themes, decorations, and table settings. Visually oriented social media consumers want to produce visually appealing events, and thus the demand for fashionable, themed, and quality party supplies is on the rise. Viral challenges, influencer partnerships, and user-generated content have boosted consumer interaction, resulting in more emphasis on fashionable and Instagram-friendly celebrations. Brands are using digital marketing campaigns, influencer sponsorships, and short-form video content to entice consumers. Moreover, do-it-yourself party decoration video tutorials, real-time shopping events, and live interactive polls have also fueled engagement further. As the focus on distinctive event looks increases, social media still remains at the center of influencing buying decisions and powering the growth of the party supplies market.
Party Supplies Industry Segmentation:
IMARC Group provides an analysis of the key trends in each segment of the global party supplies market, along with forecast at the global, regional, and country levels from 2026-2034. The market has been categorized based on product type, application, and distribution channel.
Analysis by Product Type:
- Balloons
- Banners
- Pinatas
- Games
- Home Decor
- Tableware/Disposables
- Others
Balloons continue to lead the product segment in the party supplies market, with a market share of 11.7% in 2025. The surge in demand for themed party decoration, such as foil and latex balloons, is driving this demand. Personalized and biodegradable balloons are becoming popular as consumers shift toward sustainable trends. Balloon arches, garlands, and helium-filled options are popularly used for birthday parties, weddings, and business events. Additionally, advances in social media have also energized creative balloon designs, where event planners and influencers post the most creative balloons. Online and specialty stores, meanwhile, facilitated balloon customization to make it readily available, augmenting sales even further. Launches of printed and light emitting diode (LED) balloons also increased appeal to consumers. Further, extended services of delivering balloons and even do it yourself (DIY) balloon package kits for residential celebrations have become more robust at propelling growth in the market. With a growing emphasis on green materials and creative designs, the balloon industry is likely to see consistent growth in the years to come.

Analysis by Application:
- Commercial Use
- Domestic Use
Domestic use dominates the party supplies sector, with 71.8% of overall share in 2025. This is fueled by a rise in home-based celebrations, such as birthdays, anniversaries, baby showers, and holiday celebrations. The boosting popularity of small gatherings and DIY party organizing has spurred consumer demand for decorations, tableware, and themed accessories. Internet shopping and social media have also added fuel to this sector, by being sources of ideas and readily accessible party supplies. Furthermore, the value and ease of at-home celebrations as opposed to venue celebrations have driven continued market expansion. The expanded availability of party kits and home-based event customization have also played to growing consumer demand. Environmentally friendly and reusable party items, including biodegradable plates and fabric banners, are becoming highly popular in this market. As consumers increasingly value individual and cost-conscious celebrations, domestic usage should continue to be the top use in the party accessories market.
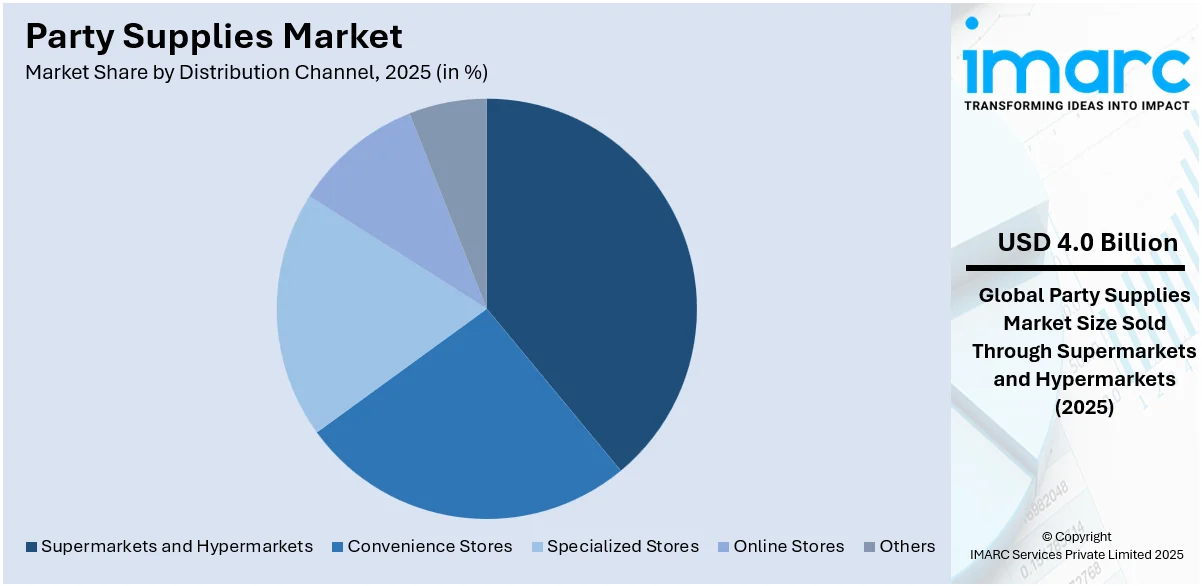
Analysis by Distribution Channel:
Access the comprehensive market breakdown Request Sample
- Supermarkets and Hypermarkets
- Convenience Stores
- Specialized Stores
- Online Stores
- Others
Hypermarkets and supermarkets are an important retail channel for party supplies, commanding 26.0% of market share in 2025. These shops provide a single-stop shopping destination, offering buyers a comprehensive selection of party products, such as decorations, tableware, balloons, and disposable cutlery. The facility to buy at discounts for bulk purchases and instant offers in the store draws cost-conscious buyers. Shoppers patronize supermarkets and hypermarkets for impromptu party shopping for convenience and the ability to immediately find products available in the stores. Private-label products and private-label collections that appear only in stores reinforce this category further. Seasonal sales during peak festivals and holidays also contribute to sales. Although the customer prefers shopping online, it remains so that consumers continue to shop in stores to evaluate product quality and design firsthand. The use of digital kiosks and self-checkout facilities improved the shopping experience. With more stores accelerating the product assortment and customer interaction approaches, they remain to be the most prominent forces in the party supply industry.
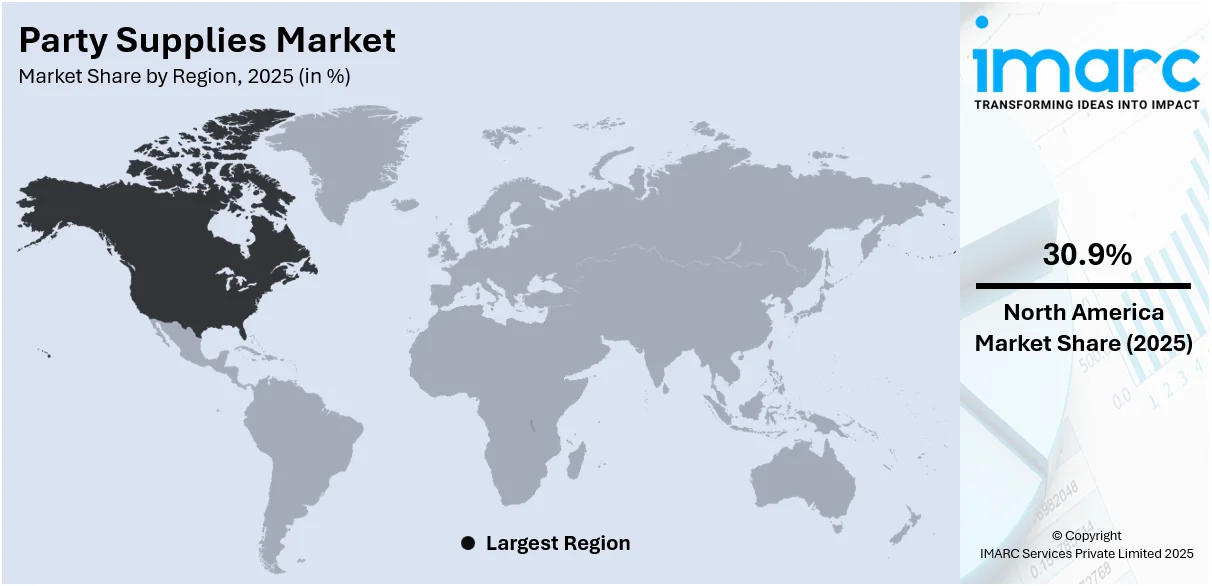
Regional Analysis:
To get more information on the regional analysis of this market Request Sample
- North America
- United States
- Canada
- Asia Pacific
- China
- Japan
- India
- South Korea
- Australia
- Indonesia
- Others
- Europe
- Germany
- France
- United Kingdom
- Italy
- Spain
- Russia
- Others
- Latin America
- Brazil
- Mexico
- Others
- Middle East and Africa
North America dominates the international party supplies market, with a 30.9% market share in 2025. This is attributed to the region's high disposable incomes, frequent social parties, and extensive theme party culture. The country has an extensive retail network consisting of supermarkets, specialty stores, and online platforms that provide access to a large assortment of party products. Trends on social media and influencer-based promotions heavily dictate consumer purchases. Besides, increased demand for customized and ecofriendly party materials has fueled market growth. Festive seasons like Halloween, Thanksgiving, and Christmas boosts demand further. Amplified DIY party planning and custom availability have also intensified consumer participation. Online shopping websites are the key drivers of sales, providing convenience and extensive product ranges. With stimulating demand for premium and themed party supplies, North America is likely to continue its dominance in the market.
Key Regional Takeaways:
United States Party Supplies Market Analysis
United States witnesses surging demand for Party Supplies owing to surging increasing demand for event management services. For example, meeting, convention, & event planners in 2022 totaled 135,051 individuals, including 76.6% of them being females and 23.4% of them being males. Growing professional event planning is propelling the demand for varying decorations, themed accessories, and customized items. Shoppers look for quality and personalized products for weddings, corporate events, and birthdays, driving market growth. Large parties, baby showers, and milestone anniversaries drive mounting sales in specialty stores and websites. Companies use social media and trends to promote themed parties that necessitate special supplies. Corporate and social events drive bulk buying, which fuels market growth. Rising growing demand for event management services results in new product launches and seasonal promotions to suit changing consumer needs. The trend toward green materials further impacts product development. Exclusive collections and limited-edition designs by retailers boost market dynamics. Rising promotion activities, discounts, and brand collaborations boost sales channels.
Asia Pacific Party Supplies Market Analysis
Asia-pacific sees amplifying party supplies demand with increased supermarkets and hypermarkets. Reports indicate that there are 66,225 Indian supermarkets as of January 23, 2025, an increase of 3.88% compared to 2023. Surging retail infrastructure enhances access, making diverse decorations, balloons, and tableware easily accessible. Buyers enjoy bulk discounts for purchases, festive offers, and special in-store collections. Impulsive purchasing, fueled by rapid urbanization and changing shopping habits, pushes sales. Hypermarkets and supermarkets boost product exposure, launching themed packages and festival collections. One-stop shopping is preferred by consumers for convenience, encouraging demand for various event accessories. The expansion of growing supermarkets and hypermarkets facilitates partnerships between retailers and suppliers to provide unique product lines. In-store promotions, loyalty schemes, and bundling products create further market penetration. They spend on enticing visual merchandising, determining consumers' shopping decisions. An increase in disposable income and altered lifestyle trends underpin consumer expenditures on high-end party decorations.
Europe Party Supplies Market Analysis
Europe witnesses rising demand for party supplies owing to the increasing popularity of destination weddings and events. For example, annually, 340,000 to 350,000 destination weddings are conducted, and a major percentage opt for the beautiful and scenic landscapes of Europe. Consumers look forward to exclusive and high-end decorations, and hence, rise in demand for exclusive themes, luxurious table settings, and high-end accessories. Individuals and event planners want premium floral arrangements, specialty lighting, and customized souvenirs to augment festivities. Destination wedding and celebrations trend boosts party supplies with themes matching scenic points and cultural sensitivities. Growing disposable income aids luxurious purchases, fueling the sales of luxury decorations. Wedding supplies with a theme, such as rustic, bohemian, and vintage, have high demand. Social media dictates consumer needs, with interest in complicated setups and design trends. High-end event supply rental services become popular, promoting sustainability and economical solutions. Clients have exclusive collections, periodical releases, and customized solutions introduced by businesses to meet changing demands.
Latin America Party Supplies Market Analysis
Latin America observes stimulating party supplies uptake owing to amplifying online shops and disposable revenue. Latin America's total disposable income is reported to increase by almost 60% from 2021 to 2040. Shoppers are intensely inclined toward buying event accessories from digital platforms, enjoying ease, promotions, and large product offerings. Themed decorations, bulk purchases, and unique designs from increasing online shops add to shopping experiences. Raised disposable income triggers high expenditure on elaborate party arrangements, high-end tableware, and specialty decorations. Increasing social media presence benefits the market by influencing customers to choose trendy and distinctive party designs. Merchants utilize digital marketing platforms to drive new product releases and seasonal offerings.
Middle East and Africa Party Supplies Market Analysis
Middle East and Africa witness rising demand for party products because of rising growth in social events and celebrations because of increasing tourism. For example, Dubai received 14.96 Million overnight visitors from January to October 2024, which represents an 8% rise over the same period in 2023, pointing towards a high growth in tourism. Growing hospitality and tourism industries promote large-scale celebrations, which amplify the demand for high-end decor, themed accessories, and party-specific decor. The boosting rise in social events and celebrations because of rising tourism creates demand for destination-themed party decorations based on various culture-oriented preferences. Luxury resorts, event organizers, and banquet halls promote mass procurement of high-end and customized decor. Party trends are driven by social media, which encourages elaborate settings and customized decor. High-profile shows, business conferences, and weddings play their role in increasing product categories.
Competitive Landscape:
The party supplies business is extremely competitive, with many participants spanning big-scale manufacturers to small, specialty retailers. The market has a combination of physical, offline stores and online platforms, as well as direct-to-consumer companies selling an extensive product selection, including decorations, tableware, balloons, themed merchandise, and personalized party kits. Increased competition due to e-commerce has prompted smaller companies to compete against well-established brands by providing new, niche, and customized products. Product differentiation and innovation are responsible for achieving competitive advantage. Firms invest in biodegradable and environmentally friendly materials to meet the needs of sustainability-focused consumers. Personalization services, like customized party favors and banners, are gaining prominence. Pricing mechanisms also play a role in shaping competition, with discounts for bulk purchases, subscription plans, and seasonal offers being favored by consumers. Moreover, online marketing, influencer partnerships, and social media activism have become crucial means for businesses to raise brand awareness and drive customer acquisition in this rapidly evolving sector.
The report provides a comprehensive analysis of the competitive landscape in the party supplies market with detailed profiles of all major companies, including:
- American Greetings Corporation
- Betallic, LLC
- Creating converting
- Meri Meri
- OTC Direct, Inc.
- PartyDeco
- Shindigz
- Shutterfly, Inc.
- The Beistle Company
- Unique Industries Inc.
Latest News and Developments:
- October 2024: Celeb chef Duff Goldman and Hallmark released a limited party supply collection, combining creativity and celebration. This daring line added special touches beyond the essentials to gatherings. Goldman describes it as a "full-circle moment," sharing his passion with festive events. The collection makes every event fun, memorable, and fashionable.
- October 2024: Instacart and Party City collaborated to provide same-day delivery of party supplies from more than 700 stores in North America. Party decorators, tableware, balloons, and costumes can be purchased on Instacart and delivered as quickly as an hour. The partnership provides greater convenience to party organizers, so they do not miss out on any celebration. Party City is focusing on making event preparation easier with effortless access to party essentials.
- May 2024: Nevada County OES, in partnership with United Way of Nevada County, organized a Community Go-Bag Party. Participants received free essential emergency kits to go along with party supplies, which were the attractions. They organized it in Grass Valley Veteran's Memorial Building, and this encourages wildfire preparation. The idea merges safety sensitivity with a relaxed, community-themed environment.
- March 2024: Michaels debuted "Birthday Parties" nationwide in the U.S., expanding its imaginative experiences for children ages 4-13. The new party supplies category comes after a successful Canadian pilot, complementing Michaels' omnichannel expansion. Families are able to celebrate stress-free with facilitated crafts, encouraging creativity. The move aligns with Michaels' focus on participating in-store and online activities.
Party Supplies Market Report Scope:
| Report Features | Details |
|---|---|
| Base Year of the Analysis | 2025 |
| Historical Period | 2020-2025 |
| Forecast Period | 2026-2034 |
| Units | Billion USD |
| Scope of the Report |
Exploration of Historical Trends and Market Outlook, Industry Catalysts and Challenges, Segment-Wise Historical and Future Market Assessment:
|
| Product Types Covered | Balloons, Banners, Pinatas, Games, Home Décor, Tableware/Disposables, Others |
| Applications Covered | Commercial Use, Domestic Use |
| Distribution Channels Covered | Supermarkets and Hypermarkets, Convenience Stores, Specialized Stores, Online Stores, Others |
| Regions Covered | Asia Pacific, Europe, North America, Latin America, Middle East and Africa |
| Countries Covered | United States, Canada, Germany, France, United Kingdom, Italy, Spain, Russia, China, Japan, India, South Korea, Australia, Indonesia, Brazil, Mexico |
| Companies Covered | American Greetings Corporation, Betallic, LLC, Creating converting, Meri Meri, OTC Direct, Inc., PartyDeco, Shindigz, Shutterfly, Inc., The Beistle Company, Unique Industries Inc., etc. |
| Customization Scope | 10% Free Customization |
| Post-Sale Analyst Support | 10-12 Weeks |
| Delivery Format | PDF and Excel through Email (We can also provide the editable version of the report in PPT/Word format on special request) |
Key Benefits for Stakeholders:
- IMARC’s report offers a comprehensive quantitative analysis of various market segments, historical and current market trends, market forecasts, and dynamics of the party supplies market from 2020-2034.
- The research study provides the latest information on the market drivers, challenges, and opportunities in the global party supplies market.
- The study maps the leading, as well as the fastest-growing, regional markets. It further enables stakeholders to identify the key country-level markets within each region.
- Porter's Five Forces analysis assists stakeholders in assessing the impact of new entrants, competitive rivalry, supplier power, buyer power, and the threat of substitution. It helps stakeholders to analyze the level of competition within the party supplies industry and its attractiveness.
- Competitive landscape allows stakeholders to understand their competitive environment and provides an insight into the current positions of key players in the market.
Frequently Asked Questions About the Party Supplies Market Report
The party supplies market was valued at USD 16.2 Billion in 2025.
The party supplies market is projected to exhibit a CAGR of 6.20% during 2026-2034, reaching a value of USD 28.0 Billion by 2034.
The party supply market is fueled by rising social events, growing disposable income, increasing adoption of e-commerce, and the power of social media. Consumers demand personalized, themed, and environmentally friendly products. Destination weddings, influencer events, and do it yourself (DIY) party planning are trends that continue to fuel demand, drive innovation, and increase market size.
North America currently dominates the party supplies market, accounting for a share of 30.9%. The market is spurred by high consumer outlays, recurrent social festivities, deep e-commerce penetration, and social media influence. Increasing demand for personalized, themed, and ecofriendly products further drives market growth.
Some of the major players in the party supplies market include American Greetings Corporation, Betallic, LLC, Creating converting, Meri Meri, OTC Direct, Inc., PartyDeco, Shindigz, Shutterfly, Inc., The Beistle Company, Unique Industries Inc., etc.
Need more help?
- Speak to our experienced analysts for insights on the current market scenarios.
- Include additional segments and countries to customize the report as per your requirement.
- Gain an unparalleled competitive advantage in your domain by understanding how to utilize the report and positively impacting your operations and revenue.
- For further assistance, please connect with our analysts.
 Request Customization
 Speak to an Analyst
 Request Brochure
 Inquire Before Buying
Benefits of Customization
- Personalize this research
- Triangulate with your data
- Get data as per your format and definition
- Gain a deeper dive into a specific application, geography, customer, or competitor
- Any level of personalization
Get in Touch With Us
UNITED STATES
Phone: +1-201-971-6302
INDIA
Phone: +91-120-433-0800
UNITED KINGDOM
Phone: +44-753-714-6104
Email: [email protected]
Client Testimonials


.webp)


