
Phenol Prices, Trend, Chart, Demand, Market Analysis, News, Historical and Forecast Data Report 2026 Edition
Phenol Price Trend, Index and Forecast
Track real-time and historical phenol prices across global regions. Updated monthly with market insights, drivers, and forecasts.
Phenol Prices June 2026
| Region | Price (USD/Kg) | Latest Movement |
|---|---|---|
| Northeast Asia | 1.09 | -16.8% ↓ Down |
| Europe | 1.32 | 1.5% ↑ Up |
| Middle East | 1.11 | -0.9% ↓ Down |
| North America | 1.32 | -9.0% ↓ Down |
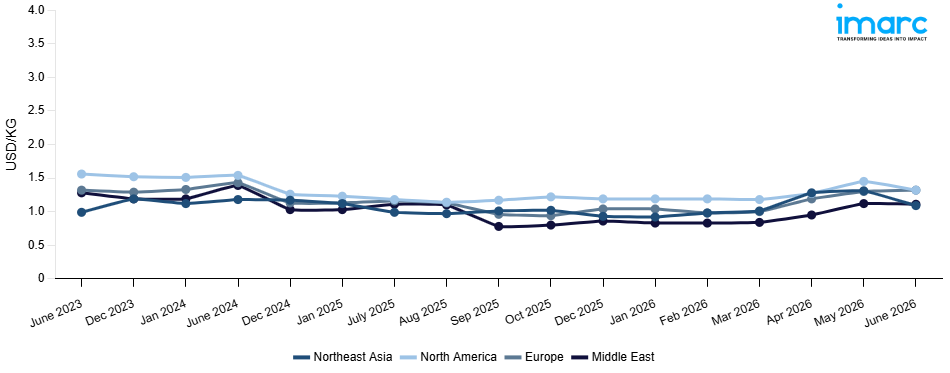
Phenol Price Index (USD/KG):
The chart below highlights monthly phenol prices across different regions.
Get Access to Monthly/Quarterly/Yearly Prices, Request Sample
Market Overview Q1 Ending March 2026
Northeast Asia: The phenol prices in Northeast Asia reached 1.01 USD/KG in March 2026. The upward pricing movement registered between December and March 2026 was 8.6%. Firm demand from the bisphenol A, phenolic resin, and caprolactam manufacturing sectors drove active phenol procurement and reinforced bullish pricing conditions across Northeast Asian markets throughout the review period. Rising upstream cumene feedstock costs at regional production facilities elevated manufacturing expenses and provided consistent upward support to prevailing regional market rates during the quarter. Constrained domestic production availability amid planned maintenance outages at key manufacturing facilities tightened regional supply conditions and intensified competition among downstream chemical and resin buyers for available volumes.
Europe: The phenol prices in Europe reached 1.00 USD/KG in March 2026. The downward pricing movement registered between December and March 2026 was 3.8%. The softening demand for phenol from the bisphenol A, phenolic resin, and specialty chemicals manufacturing industries led to lower purchase volumes and unfavorable pricing trends for phenol in the European market during the review period. The continuous availability of competitively priced import shipments from Asia and the Middle East put downward pressure on prevailing prices in the European market, making it difficult for regional manufacturers to maintain current price levels in the quarter. Lower upstream cumene feedstock costs from regional plants reduced manufacturing costs and lowered the cost base for current phenol prices.
Middle East: The phenol prices in the Middle East reached 0.84 USD/KG in March 2026. The downward pricing movement registered between December and March 2026 was 2.3%. Marginally softening export demand from Asian and European importing regions reduced phenol offtake volumes and contributed to mild bearish pricing conditions across Middle Eastern markets throughout the review period. Adequate regional production output from cumene based manufacturing facilities maintained sufficient supply conditions and placed modest downward pressure on prevailing market rates during the quarter. Slightly declining upstream cumene feedstock costs at regional production facilities lowered manufacturing expenses and reduced the cost floor supporting existing phenol price levels.
North America: The phenol prices in North America reached 1.18 USD/KG in March 2026. The downward pricing movement registered between December and March 2026 was 0.8%. Demand for bisphenol A, phenolic resins, and specialized chemicals was slightly weak during the review period, contributing to slightly bearish conditions in North American markets amid subdued purchasing activity. The availability of adequate local phenol production in cumene based plants in the region led to bearish trends in phenol prices. The falling upstream costs of cumene raw materials in domestic plants led to lower manufacturing costs, which negatively affected the cost support for current phenol prices.
Market Overview Q3 Ending September 2025
Northeast Asia: Phenol prices in Northeast Asia saw moderate growth, supported by stable downstream demand in the bisphenol-A (BPA) and phenolic resins sector. Chinese producers benefitted from robust domestic consumption in the construction and electronics industries, while Japanese and South Korean markets reflected tight availability due to scheduled maintenance shutdowns at key phenol plants. Feedstock benzene prices rose slightly in August, raising production costs. Port handling delays in China’s eastern seaboard and higher international shipping freight rates also increased landed costs. Currency depreciation of the yen against the US dollar made imports costlier in Japan, further driving localized price adjustments.
Europe: European phenol markets faced downward pricing pressure, largely attributed to weak demand from downstream automotive and coatings applications. Rising inventory levels, especially in Germany and the Netherlands, created an oversupply scenario. Meanwhile, benzene feedstock costs in Europe fell sharply in August amid declining crude oil benchmarks, lowering overall production costs. Domestic logistics constraints, such as inland truck shortages, continued to elevate transportation expenses, though this failed to offset the bearish sentiment from sluggish end-use demand. The net effect was a notable double-digit decline in regional phenol prices.
Middle East: The Middle East registered the steepest decline in phenol prices. Ample feedstock benzene availability in Saudi Arabia and Qatar, coupled with high plant operating rates, led to a supply overhang. Export flows were redirected toward Europe and South Asia, but weak downstream demand in phenolic resins and adhesives failed to absorb excess supply. Additionally, the slump in crude oil benchmarks negatively affected benzene values, further reducing phenol production costs. The combination of supply surplus, reduced export demand, and low feedstock costs resulted in sharp price declines across the region.
North America: Phenol prices in North America rose marginally. Stable consumption from the automotive, packaging, and construction sectors supported demand, particularly in the US Gulf Coast markets. Planned plant turnarounds at major facilities in Texas constrained supply, adding upward pressure. Feedstock benzene prices strengthened slightly during July and August due to higher refinery turnarounds, driving production costs higher. However, increasing imports from Asia at competitive rates tempered further gains. Freight rate hikes due to rail congestion and trucking shortages raised inland logistics expenses, further influencing regional cost structures. Despite subdued macroeconomic growth, balanced demand-supply fundamentals maintained a steady upward trajectory for phenol prices across the quarter.
Phenol Price Trend, Market Analysis, and News
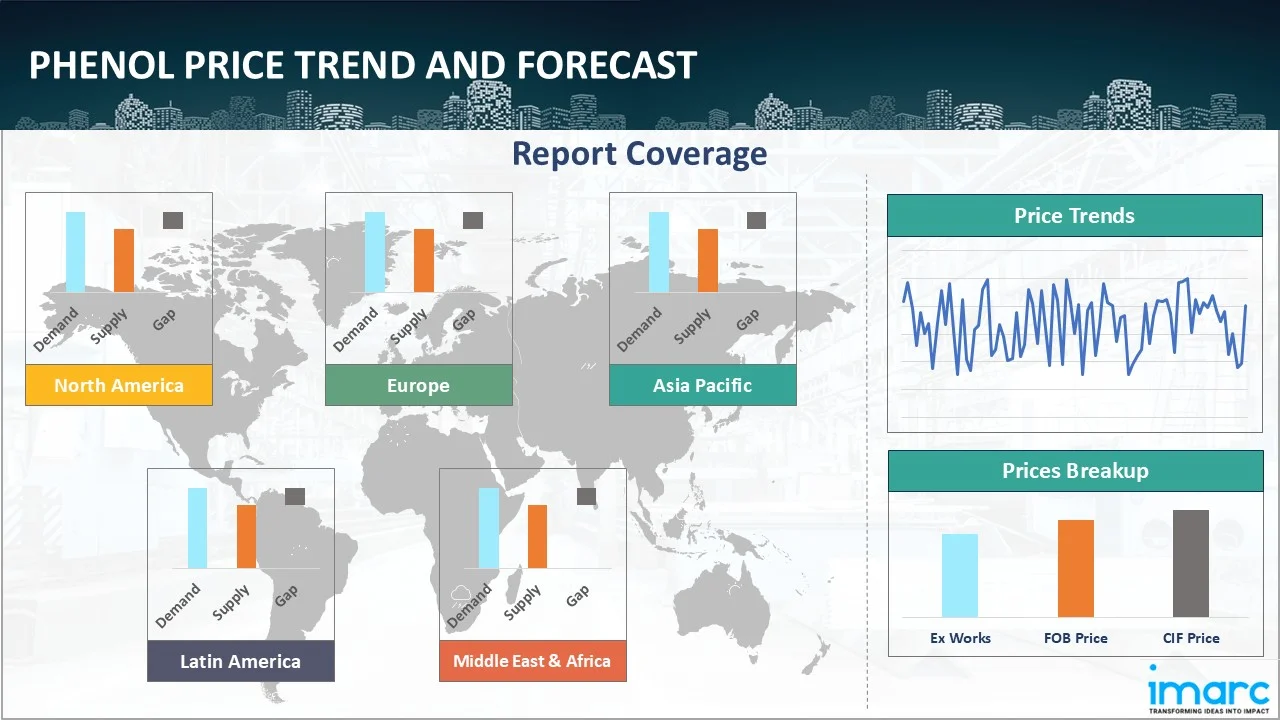
IMARC's latest publication, “Phenol Prices, Trend, Chart, Demand, Market Analysis, News, Historical and Forecast Data Report 2026 Edition,” presents a detailed examination of the phenol market, providing insights into both global and regional trends that are shaping prices. This report delves into the spot price of phenol at major ports and analyzes the composition of prices, including FOB and CIF terms. It also presents detailed phenol prices trend analysis by region, covering North America, Europe, Asia Pacific, Latin America, and Middle East and Africa. The factors affecting phenol pricing, such as the dynamics of supply and demand, geopolitical influences, and sector-specific developments, are thoroughly explored. This comprehensive report helps stakeholders stay informed with the latest market news, regulatory updates, and technological progress, facilitating informed strategic decision-making and forecasting.
Phenol Industry Analysis
The global phenol industry size reached USD 25.3 Billion in 2025. By 2034, IMARC Group expects the market to reach USD 35.2 Billion, at a projected CAGR of 3.65% during 2026-2034. The market is driven by the rising demand for bisphenol-A (BPA) in polycarbonates, expanding applications in phenolic resins for construction and automotive, increasing use in pharmaceuticals, and technological advancements in sustainable production processes.
Latest developments in the Phenol Industry:
- April 2025: The Board of Directors of Deepak Chem Tech Limited (DCTL), a wholly owned subsidiary of Deepak Nitrite Limited (DNL), approved a large-scale investment project aimed at expanding its product portfolio. The plan involved establishing a new facility with capacities of 300 KTA of phenol, 185 KTA of acetone, and 100 KTA of isopropyl alcohol (IPA).
- November 2023: Cepsa Quimica SA produced circular phenol from discarded single-use plastics, such as plastic bags and cutlery, to reduce plastic pollution.
- April 2023: INEOS Phenol acquired Mitsui Phenols Singapore Ltd from Mitsui Chemicals to add Jurong phenol and BPA assets to their existing portfolio.
Product Description
Phenol (C₆H₅OH) is an aromatic organic compound classified as a hydroxybenzene derivative, typically appearing as a colorless to white crystalline solid. It is widely regarded as a key intermediate in global chemical production, owing to its reactivity and versatility. Phenol’s defining property is its hydroxyl group, which enables extensive industrial transformation. Its major applications include the manufacture of bisphenol-A (BPA) used in polycarbonates, phenolic resins for adhesives and laminates, caprolactam for nylon production, and in pharmaceuticals as a precursor for active ingredients. Its role as a fundamental building block ensures its strategic importance across multiple industries worldwide.
Report Coverage
| Key Attributes | Details |
|---|---|
| Product Name | Phenol |
| Report Features | Exploration of Historical Trends and Market Outlook, Industry Demand, Industry Supply, Gap Analysis, Challenges, Phenol Price Analysis, and Segment-Wise Assessment. |
| Currency/Units | US$ (Data can also be provided in local currency) or Metric Tons |
| Region/Countries Covered | The current coverage includes analysis at the global and regional levels only. Based on your requirements, we can also customize the report and provide specific information for the following countries: Asia Pacific: China, India, Indonesia, Pakistan, Bangladesh, Japan, Philippines, Vietnam, Thailand, South Korea, Malaysia, Nepal, Taiwan, Sri Lanka, Hongkong, Singapore, Australia, and New Zealand Europe: Germany, France, United Kingdom, Italy, Spain, Russia, Turkey, Netherlands, Poland, Sweden, Belgium, Austria, Ireland, Switzerland, Norway, Denmark, Romania, Finland, Czech Republic, Portugal and Greece North America: United States and Canada Latin America: Brazil, Mexico, Argentina, Columbia, Chile, Ecuador, and Peru Middle East & Africa: Saudi Arabia, UAE, Israel, Iran, South Africa, Nigeria, Oman, Kuwait, Qatar, Iraq, Egypt, Algeria, and Morocco The list of countries presented is not exhaustive. Information on additional countries can be provided if required by the client. |
| Information Covered for Key Suppliers |
|
| Customization Scope | The report can be customized as per the requirements of the customer |
| Report Price and Purchase Option |
Plan A: Monthly Updates - Annual Subscription
Plan B: Quarterly Updates - Annual Subscription
Plan C: Biannually Updates - Annual Subscription
|
| Post-Sale Analyst Support | 360-degree analyst support after report delivery |
| Delivery Format | PDF and Excel through email (We can also provide the editable version of the report in PPT/Word format on special request) |
Key Benefits for Stakeholders:
- IMARC’s report presents a detailed analysis of phenol pricing, covering global and regional trends, spot prices at key ports, and a breakdown of FOB and CIF prices.
- The study examines factors affecting phenol price trend, including input costs, supply-demand shifts, and geopolitical impacts, offering insights for informed decision-making.
- The competitive landscape review equips stakeholders with crucial insights into the latest market news, regulatory changes, and technological advanphenols, ensuring a well-rounded, strategic overview for forecasting and planning.
- IMARC offers various subscription options, including monthly, quarterly, and biannual updates, allowing clients to stay informed with the latest market trends, ongoing developments, and comprehensive market insights. The phenol price charts ensure our clients remain at the forefront of the industry.
Frequently Asked Questions About the Phenol Price Index Report
The phenol prices in June 2026 were 1.09 USD/KG in Northeast Asia, 1.32 USD/KG in Europe, 1.11 USD/KG in the Middle East, and 1.32 USD/KG in North America.
The phenol pricing data is updated on a monthly basis.
We provide the pricing data primarily in the form of an Excel sheet and a PDF.
Yes, our report includes a forecast for phenol prices.
The regions covered include North America, Europe, Asia Pacific, Middle East, and Latin America. Countries can be customized based on the request (additional charges may be applicable).
Yes, we provide both FOB and CIF prices in our report.
Need more help?
- Speak to our experienced analysts for insights on the current market scenarios.
- Include additional segments and countries to customize the report as per your requirement.
- Gain an unparalleled competitive advantage in your domain by understanding how to utilize the report and positively impacting your operations and revenue.
- For further assistance, please connect with our analysts.
 Request Customization
 Inquire Before Buying
 Speak to an Analyst
 Request Brochure
Benefits of Customization
- Personalize this research
- Triangulate with your data
- Get data as per your format and definition
- Gain a deeper dive into a specific application, geography, customer, or competitor
- Any level of personalization
Get in Touch With Us
UNITED STATES
Phone: +1-201-971-6302
INDIA
Phone: +91-120-433-0800
UNITED KINGDOM
Phone: +44-753-714-6104
Email: [email protected]
Client Testimonials


.webp)


Related Reports
Why Choose Us
IMARC offers trustworthy, data-centric insights into commodity pricing and evolving market trends, enabling businesses to make well-informed decisions in areas such as procurement, strategic planning, and investments. With in-depth knowledge spanning more than 1000 commodities and a vast global presence in over 150 countries, we provide tailored, actionable intelligence designed to meet the specific needs of diverse industries and markets.
1000
+Commodities
150
+Countries Covered
3000
+Clients
20
+Industry
Robust Methodologies & Extensive Resources
IMARC delivers precise commodity pricing insights using proven methodologies and a wealth of data to support strategic decision-making.
Subscription-Based Databases
Our extensive databases provide detailed commodity pricing, import-export trade statistics, and shipment-level tracking for comprehensive market analysis.
Primary Research-Driven Insights
Through direct supplier surveys and expert interviews, we gather real-time market data to enhance pricing accuracy and trend forecasting.
Extensive Secondary Research
We analyze industry reports, trade publications, and market studies to offer tailored intelligence and actionable commodity market insights.
Trusted by 3000+ industry leaders worldwide to drive data-backed decisions. From global manufacturers to government agencies, our clients rely on us for accurate pricing, deep market intelligence, and forward-looking insights.