
Phenolic Resin Prices, Trend, Chart, Demand, Market Analysis, News, Historical and Forecast Data Report 2026 Edition
Phenolic Resin Price Trend, Index and Forecast
Track real-time and historical phenolic resin prices across global regions. Updated monthly with market insights, drivers, and forecasts.
Phenolic Resin Prices July 2026
| Region | Price (USD/Kg) | Latest Movement |
|---|---|---|
| Africa | 2.88 | 18.0% ↑ Up |
| Northeast Asia | 3.13 | 2.0% ↑ Up |
| Europe | 2.16 | -1.8% ↓ Down |
| India | 1.13 | -11.7% ↓ Down |
| South America | 1.44 | 10.8% ↑ Up |
| North America | 1.16 | -14.1% ↓ Down |
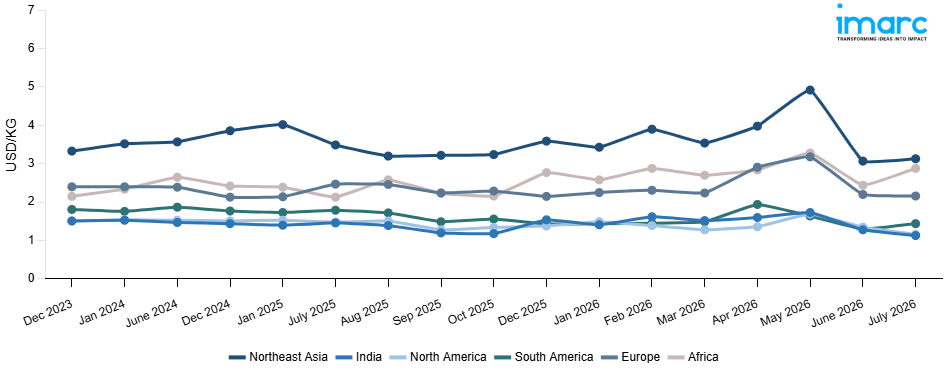
Phenolic Resin Price Index (USD/KG):
The chart below highlights monthly phenolic resin prices across different regions.
Get Access to Monthly/Quarterly/Yearly Prices, Request Sample
Market Overview Q1 Ending March 2026
Africa: The phenolic resin prices in Africa reached 2.70 USD/KG in March 2026. The downward pricing movement registered between December and March 2026 was 2.5%. The softening of demand for wood panels, construction adhesives, and molding compounds led to a decrease in procurement activity, resulting in mild bearish conditions in Africa during the review period. The competitive availability of import cargoes from Asian supplier nations continued to put downward pressure on regional market prices. The decrease in the cost of phenol and formaldehyde feedstocks used for production at key manufacturing plants reduced production costs, further eroding the cost base under prevailing regional prices.
Northeast Asia: The phenolic resin prices in Northeast Asia reached 3.54 USD/KG in March 2026. The downward pricing movement registered between December and March 2026 was 1.4%. Marginally weakened demand from the plywood, friction material, and insulation board manufacturing sectors tempered procurement activity and contributed to mild bearish conditions across Northeast Asian markets throughout the review period. Ample domestic production from Chinese phenolic resin facilities provided sufficient supply and placed modest downward pressure on prevailing regional market rates during the quarter. Slightly declining upstream phenol and formaldehyde feedstock costs at key producing facilities reduced manufacturing expenses and weakened the cost support for existing regional price levels.
Europe: The phenolic resin prices in Europe reached 2.24 USD/KG in March 2026. The upward pricing movement registered between December and March 2026 was 4.2%. Strong buying interest from the wood composite, automotive friction material, and insulation industry segments helped drive active procurement of phenolic resins, which in turn maintained bullish prices in European markets. Higher upstream costs of phenol and formaldehyde used in regional phenolic resin production helped support prevailing European market prices upward. Limited regional availability of phenolic resins due to maintenance activities in regional industrial plants helped drive solid buying interest in regional markets.
India: The phenolic resin prices in India reached 1.52 USD/KG in March 2026. The downward pricing movement registered between December and March 2026 was 1.3%. Marginally softening demand from the plywood, laminates, and molding compound manufacturing sectors tempered procurement activity and contributed to mild bearish conditions across Indian markets throughout the review period. Adequate import cargo availability from Asian supplying regions maintained sufficient domestic supply conditions and placed modest downward pressure on prevailing Indian market rates during the quarter. Slightly declining upstream phenol and formaldehyde feedstock costs at domestic production facilities reduced manufacturing expenses and weakened the cost support for existing price levels.
South America: The phenolic resin prices in South America reached 1.49 USD/KG in March 2026. The upward pricing movement registered between December and March 2026 was 4.2%. Firm demand from the wood panel, construction adhesive, and automotive component manufacturing sectors drove active phenolic resin procurement and reinforced bullish pricing conditions across South American markets throughout the review period. Rising upstream phenol and formaldehyde feedstock costs at regional and importing production facilities elevated manufacturing expenses and provided consistent upward support to prevailing market rates during the quarter. Constrained import cargo availability from key Asian and North American supplying regions tightened overall South American supply conditions and reinforced firm buying interest among downstream industrial purchasers.
North America: The phenolic resin prices in North America reached 1.28 USD/KG in March 2026. The downward pricing movement registered between December and March 2026 was 7.2%. A significant reduction in demand from the wood composite, insulation board, and automotive friction material industries led to a decline in procurement activity, further fueling the bearish trend in the phenolic resin market in the North American region. Domestic production from regional facilities was sufficiently high, thereby increasing market price competitiveness. The significant decline in upstream costs of raw materials such as phenol and formaldehyde at domestic production facilities reduced production costs, further eroding support for phenolic resin prices.
Market Overview Q4 Ending December 2025
Africa: The phenolic resin prices in Africa reached 2.77 USD/KG in December 2025. The upward pricing movement registered between September and December 2025 was 24.3%. The substantial price appreciation was primarily driven by tighter supply conditions stemming from constrained domestic production capacity and reduced import availability, which significantly limited regional volumes. Robust demand from the construction plywood and abrasive bonding sectors intensified procurement competition amid limited spot market availability. Escalating upstream costs for phenol and formaldehyde feedstocks further elevated production expenses for regional manufacturers. Additionally, heightened consumption in the friction material and insulation segments amplified off take pressure, while logistical bottlenecks in distribution networks restricted timely replenishment of supply.
Northeast Asia: The phenolic resin prices in Northeast Asia reached 3.59 USD/KG in December 2025. The upward pricing movement registered between September and December 2025 was 11.6%. Firm upstream phenol and formaldehyde feedstock costs drove a considerable price increase, sharply increasing area firms' production costs over the course of the quarter. Strong demand from the industries that manufacture friction materials, foundry binder, and plywood glue boosted procurement activity as downstream production schedules expanded. Regional availability was further limited by tight supply conditions driven by the large producers' output discipline and planned maintenance shutdowns at critical plants. Strong offtake fundamentals were also maintained by increased consumption in the laminate and insulation board segments, while downstream fabricators' strategic stockpiling in anticipation of ongoing supply constraints increased procurement competition and sustained strong bullish pricing momentum throughout the quarter.
Europe: The phenolic resin prices in Europe reached 2.15 USD/KG in December 2025. The downward pricing movement registered between September and December 2025 was 3.9%. The price softening was primarily attributed to weaker demand from the construction, automotive, and wood composite manufacturing sectors amid a broader industrial slowdown across the region. Declining upstream valuations of phenol feedstock reduced production cost benchmarks for domestic producers, diminishing baseline pricing support across the supply chain. Adequate supply availability from established manufacturers maintained comfortable inventory levels, while increased import competition from competitively priced cargoes exerted additional downward pressure on prevailing market rates.
India: The phenolic resin prices in India reached 1.54 USD/KG in December 2025. The upward pricing movement registered between September and December 2025 was 27.9%. Acute supply constraints stemming from limited domestic production capacity and reduced feedstock availability significantly restricted market quantities, which, in turn, led to the extreme price spike. Strong demand for brake linings, plywood adhesives, and abrasives increased procurement competition amid severely constrained spot availability. Regional firms' production costs were further increased by rising upstream costs for phenol and formaldehyde feedstock. Furthermore, increased demand from the growing construction and automotive component sectors put pressure on offtake, while logistical challenges and high transportation costs hindered prompt replenishment, maintaining strong bullish pricing momentum over the quarter.
South America: The phenolic resin prices in South America reached 1.43 USD/KG in December 2025. The downward pricing movement registered between September and December 2025 was 4.1%. The price correction was primarily attributed to subdued demand from the plywood, friction material, and foundry binder manufacturing sectors amid moderating industrial activity and cautious spending patterns across the region. Softening upstream phenol and formaldehyde feedstock costs reduced production costs, improving benchmark pricing for regional suppliers and enabling downward pricing adjustments. Increased import availability from competitively priced cargoes exerted additional downward pressure on prevailing market rates, while elevated stockpile positions among key distributors dampened restocking urgency.
North America: The phenolic resin prices in North America reached 1.38 USD/KG in December 2025. The upward pricing movement registered between September and December 2025 was 8.1%. Durable demand from the friction material, wood composite, and insulation board manufacturing industries, which maintained strong procurement volumes throughout the quarter, was the primary driver of the considerable price increase. For domestic manufacturers, high upstream phenol and formaldehyde feedstock costs increased manufacturing costs, supporting firm pricing. Downstream users' procurement rivalry was heightened by tighter supply conditions resulting from capacity constraints at specific production sites. Strong offtake fundamentals were maintained throughout the quarter by consistent consumption from the foundry binder and abrasive bonding industries, while higher logistics and transportation costs further supported delivered pricing levels and somewhat optimistic pricing momentum.
Market Overview Q3 Ending September 2025
Africa: Demand for laminates, plywood adhesives, and coatings slowed as construction projects in Nigeria, Kenya, and South Africa faced financing constraints and inflation-driven cost overruns. However, port congestion combined with inland trucking delays raised distribution expenses across Eastern and Southern Africa. Currency depreciation against the US dollar increased the landed cost of imports, further squeezing margins for local distributors. Additionally, regulatory compliance costs for fire-resistant building materials, particularly in South Africa, contributed to higher end-use costs but failed to translate into higher resin prices due to weak demand.
Northeast Asia: In Northeast Asia, phenolic resin prices remained relatively stable with a marginal upward trajectory, supported by mixed demand and higher feedstock costs. In China, strong operating rates in resin plants ensured steady supply, but exports weakened as global demand for engineered wood and laminates slowed. Domestic consumption in the construction sector held firm, while environmental compliance regulations raised production costs. In Japan, moderate demand from the automotive sector supported resin consumption for brake pads and insulation components, though the electronics sector showed signs of stagnation.
Europe: Europe experienced a pronounced decline in phenolic resin prices largely due to demand erosion across key industries such as automotive, furniture, and construction. Western Europe, particularly Germany and France, reported weak automotive output, which suppressed resin usage in brake linings, adhesives, and coatings. Energy price volatility, especially for natural gas, elevated resin production costs across Central Europe, but producers were unable to pass on these increases due to soft demand. In Eastern Europe, ongoing construction stagnation and reduced plywood exports further weakened consumption.
India: Phenolic resin prices fell sharply primarily due to reduced downstream demand from laminates, plywood, and construction applications. Seasonal monsoon rains curtailed building activities, leading to weaker offtake from the construction sector, which is a major consumer of phenolic resins. The domestic furniture and plywood industries also slowed, with exports facing pressure from reduced orders in Europe and the Middle East. On the supply side, local producers maintained steady operations, supported by the stable availability of feedstock phenol and formaldehyde.
South America: Phenolic resin pricing in South America trended lower, underpinned by sluggish industrial activity in Brazil and Argentina. Demand from the construction sector, traditionally the largest end-user of resins, contracted due to high borrowing costs and inflationary pressure on building materials. In Brazil, weaker consumption of laminates and wood products added to the decline, while Argentina struggled with currency instability that raised the landed cost of imports and disrupted purchasing activity. On the supply side, South America remained heavily reliant on imports from Asia, exposing markets to fluctuations in international freight rates.
North America: North America recorded the steepest decline in phenolic resin prices, with downward pressure stemming from weak demand and oversupply conditions. Gulf Coast producers maintained high operating rates, resulting in an abundance of resin despite sluggish downstream consumption in construction, automotive, and plywood industries. US construction activity slowed, particularly in the housing sector, where high interest rates dampened new building projects. Automotive output, a critical consumer of phenolic resins in brake and under-hood applications, remained below expectations, further reducing demand. Import competition from Asian suppliers, coupled with stable feedstock phenol costs, created additional pricing pressure.
Phenolic Resin Price Trend, Market Analysis, and News
IMARC's latest publication, “Phenolic Resin Prices, Trend, Chart, Demand, Market Analysis, News, Historical and Forecast Data Report 2026 Edition,” presents a detailed examination of the phenolic resin market, providing insights into both global and regional trends that are shaping prices. This report delves into the spot price of phenolic resin at major ports and analyzes the composition of prices, including FOB and CIF terms. It also presents detailed phenolic resin prices trend analysis by region, covering North America, Europe, Asia Pacific, Latin America, and Middle East and Africa. The factors affecting phenolic resin pricing, such as the dynamics of supply and demand, geopolitical influences, and sector-specific developments, are thoroughly explored. This comprehensive report helps stakeholders stay informed with the latest market news, regulatory updates, and technological progress, facilitating informed strategic decision-making and forecasting.
Phenolic Resin Industry Analysis
The global phenolic resin industry size reached USD 16.9 Billion in 2025. By 2034, IMARC Group expects the market to reach USD 24.5 Billion, at a projected CAGR of 4.23% during 2026-2034. The market is driven by the rising use of phenolic resins in automotive lightweighting, demand for fire resistant laminates, expansion of construction and plywood industries, and increasing applications in coatings and electronics.
Latest developments in the Phenolic Resin Industry:
- January 2025: Mitsui Chemicals and Mitsubishi Chemical Corporation initiated a joint study aimed at ensuring the stable supply of phenol-related products. These included phenol, acetone, α-methylstyrene, bisphenol A, and methyl isobutyl ketone, which served as essential raw materials for a wide range of downstream applications such as polycarbonate resins, phenolic resins, methyl methacrylate, epoxy resins, paints, etc.
- March 2024: DIC Corporation announced that its subsidiary, IDEAL CHEMI PLAST PRIVATE LTD. in Maharashtra, India, commenced operations at a new coating resins production facility in the Supa Japanese Industrial Zone. This facility tripled IDEAL CHEMI PLAST's production capacity for coating resins, positioning it to expand its business in India, South Asia, and the Middle East.
- August 2023: Bakelite Synthetics announced that it has entered into an agreement to acquire LRBG Chemicals, Inc., a Canadian resin manufacturer. This acquisition will enhance Bakelite's product portfolio, customer base, and growth strategy, aligning with its commitment to innovative solutions.
Product Description
Phenolic resin is a synthetic polymer derived primarily from phenol and formaldehyde, classified as a thermosetting resin. It is widely valued for its high mechanical strength, thermal stability, and flame resistance, making it an essential material in industrial production. Globally, it plays a significant role in adhesives, molding compounds, laminates, and insulation foams. In the construction sector, phenolic resin enhances durability and fire resistance of wood products and laminates, while in automotive and electronics industries, it improves structural integrity and thermal resistance. Its versatile performance characteristics ensure its position as a critical material across multiple manufacturing domains.
Report Coverage
| Key Attributes | Details |
|---|---|
| Product Name | Phenolic Resin |
| Report Features | Exploration of Historical Trends and Market Outlook, Industry Demand, Industry Supply, Gap Analysis, Challenges, Phenolic Resin Price Analysis, and Segment-Wise Assessment. |
| Currency/Units | US$ (Data can also be provided in local currency) or Metric Tons |
| Region/Countries Covered | The current coverage includes analysis at the global and regional levels only. Based on your requirements, we can also customize the report and provide specific information for the following countries: Asia Pacific: China, India, Indonesia, Pakistan, Bangladesh, Japan, Philippines, Vietnam, Thailand, South Korea, Malaysia, Nepal, Taiwan, Sri Lanka, Hongkong, Singapore, Australia, and New Zealand Europe: Germany, France, United Kingdom, Italy, Spain, Russia, Turkey, Netherlands, Poland, Sweden, Belgium, Austria, Ireland, Switzerland, Norway, Denmark, Romania, Finland, Czech Republic, Portugal and Greece North America: United States and Canada Latin America: Brazil, Mexico, Argentina, Columbia, Chile, Ecuador, and Peru Middle East & Africa: Saudi Arabia, UAE, Israel, Iran, South Africa, Nigeria, Oman, Kuwait, Qatar, Iraq, Egypt, Algeria, and Morocco The list of countries presented is not exhaustive. Information on additional countries can be provided if required by the client. |
| Information Covered for Key Suppliers |
|
| Customization Scope | The report can be customized as per the requirements of the customer |
| Report Price and Purchase Option |
Plan A: Monthly Updates - Annual Subscription
Plan B: Quarterly Updates - Annual Subscription
Plan C: Biannually Updates - Annual Subscription
|
| Post-Sale Analyst Support | 360-degree analyst support after report delivery |
| Delivery Format | PDF and Excel through email (We can also provide the editable version of the report in PPT/Word format on special request) |
Key Benefits for Stakeholders:
- IMARC’s report presents a detailed analysis of phenolic resin pricing, covering global and regional trends, spot prices at key ports, and a breakdown of Ex Works, FOB, and CIF prices.
- The study examines factors affecting phenolic resin price trend, including raw material costs, supply-demand shifts, geopolitical impacts, and industry developments, offering insights for informed decision-making.
- The competitive landscape review equips stakeholders with crucial insights into the latest market news, regulatory changes, and technological advancements, ensuring a well-rounded, strategic overview for forecasting and planning.
- IMARC offers various subscription options, including monthly, quarterly, and biannual updates, allowing clients to stay informed with the latest market trends, ongoing developments, and comprehensive market insights. The phenolic resin price charts ensure our clients remain at the forefront of the industry.
Frequently Asked Questions About the Phenolic Resin Prices Report
The phenolic resin price in July 2026 were 2.88 USD/KG in Africa, 3.13 USD/KG in Northeast Asia, 2.16 USD/KG in Europe, 1.13 USD/KG in India, 1.44 USD/KG in South America, and 1.16 USD/KG in North America.
The phenolic resin pricing data is updated on a monthly basis.
We provide the pricing data primarily in the form of an Excel sheet and a PDF.
Yes, our report includes a forecast for phenolic resin prices.
The regions covered include North America, Europe, Asia Pacific, Middle East, and Latin America. Countries can be customized based on the request (additional charges may be applicable).
Yes, we provide both FOB and CIF prices in our report.
Need more help?
- Speak to our experienced analysts for insights on the current market scenarios.
- Include additional segments and countries to customize the report as per your requirement.
- Gain an unparalleled competitive advantage in your domain by understanding how to utilize the report and positively impacting your operations and revenue.
- For further assistance, please connect with our analysts.
 Request Customization
 Inquire Before Buying
 Speak to an Analyst
 Request Brochure
Benefits of Customization
- Personalize this research
- Triangulate with your data
- Get data as per your format and definition
- Gain a deeper dive into a specific application, geography, customer, or competitor
- Any level of personalization
Get in Touch With Us
UNITED STATES
Phone: +1-201-971-6302
INDIA
Phone: +91-120-433-0800
UNITED KINGDOM
Phone: +44-753-714-6104
Email: [email protected]
Client Testimonials


.webp)


Related Reports
Why Choose Us
IMARC offers trustworthy, data-centric insights into commodity pricing and evolving market trends, enabling businesses to make well-informed decisions in areas such as procurement, strategic planning, and investments. With in-depth knowledge spanning more than 1000 commodities and a vast global presence in over 150 countries, we provide tailored, actionable intelligence designed to meet the specific needs of diverse industries and markets.
1000
+Commodities
150
+Countries Covered
3000
+Clients
20
+Industry
Robust Methodologies & Extensive Resources
IMARC delivers precise commodity pricing insights using proven methodologies and a wealth of data to support strategic decision-making.
Subscription-Based Databases
Our extensive databases provide detailed commodity pricing, import-export trade statistics, and shipment-level tracking for comprehensive market analysis.
Primary Research-Driven Insights
Through direct supplier surveys and expert interviews, we gather real-time market data to enhance pricing accuracy and trend forecasting.
Extensive Secondary Research
We analyze industry reports, trade publications, and market studies to offer tailored intelligence and actionable commodity market insights.
Trusted by 3000+ industry leaders worldwide to drive data-backed decisions. From global manufacturers to government agencies, our clients rely on us for accurate pricing, deep market intelligence, and forward-looking insights.