
Philippines Children’s Entertainment Centers Market Size, Share, Trends and Forecast by Visitor Demographics, Facility Size, Revenue Source, Activity Area, and Region, 2026-2034
Philippines Children’s Entertainment Centers Market Overview:
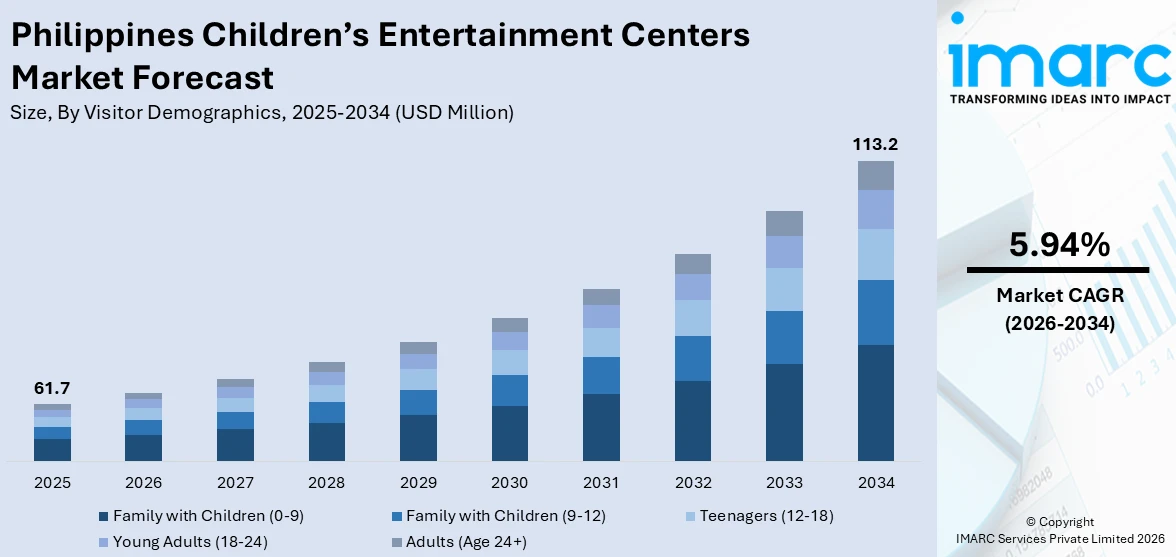
The Philippines children’s entertainment centers market size reached USD 61.7 Million in 2025. Looking forward, IMARC Group expects the market to reach USD 113.2 Million by 2034, exhibiting a growth rate (CAGR) of 5.94% during 2026-2034. Urbanization, rising disposable income, and growing middle-class families are some of the factors contributing to the Philippines children’s entertainment centers market share. Tourism, mall expansion, and technological integration, such as VR/AR experiences, also drive growth. Increased focus on family leisure activities and interactive play zones strengthens market potential.
|
Report Attribute
|
Key Statistics
|
|---|---|
|
Base Year
|
2025
|
|
Forecast Years
|
2026-2034
|
|
Historical Years
|
2020-2025
|
| Market Size in 2025 | USD 61.7 Million |
| Market Forecast in 2034 | USD 113.2 Million |
| Market Growth Rate 2026-2034 | 5.94% |
Philippines Children’s Entertainment Centers Market Trends:
Tech-Integrated Interactive Play Zones
Children's amusement facilities in the Philippines are using interactive technology to provide immersive play experiences. Augmented reality (AR) and virtual reality (VR) zones are gaining popularity, changing traditional play spaces into digital playgrounds where children can interact with characters, solve puzzles, and explore simulated worlds. Touch-sensitive walls, projection-based games, and motion sensor activities are being implemented to increase diversity and keep youngsters interested for longer periods of time. This transition is being driven in part by Filipino families' growing technological sophistication and a desire for distinctive, memorable experiences that go beyond the typical rides or ball pit. Many centers are also implementing RFID wristbands and digital reward systems to enable parents to track game progress and spending. These improvements not only boost entertainment value but also consumer loyalty, as families seek out modern venues that combine fun and engaging learning. This trend indicates an increasing investment in technology as a major differentiator for entertainment venues seeking to remain competitive in metropolitan hubs such as Metro Manila and Cebu. These factors are intensifying the Philippines children’s entertainment centers market growth.
To get more information on this market Request Sample
Educational and Themed Play Concepts
Another major trend in the Philippines’ children’s entertainment sector is the focus on themed and educational play. Centers are shifting from purely recreational setups to those that promote cognitive development, teamwork, and creativity. Concepts such as mini-cities, where kids role-play various professions like doctors, firefighters, or pilots, are gaining popularity. These “edutainment” centers emphasize life skills and problem-solving activities that appeal to parents seeking value-driven experiences for their children. Local cultural elements and Filipino folklore are also being incorporated into play zones and storytelling sessions, offering a distinct, culturally resonant appeal. Indoor farms and nature-inspired play areas are emerging as well, encouraging children to learn about sustainability and the environment. Partnerships with schools for educational field trips and interactive workshops are further expanding the market. This trend is creating a space where entertainment meets meaningful learning, making these centers attractive not just for weekend outings but also for organized group activities.
Philippines Children’s Entertainment Centers Market Segmentation:
IMARC Group provides an analysis of the key trends in each segment of the market, along with forecasts at the country and regional levels for 2026-2034. Our report has categorized the market based on visitor demographics, facility size, revenue source, and activity area.
Visitor Demographics Insights:
- Family with Children (0-9)
- Family with Children (9-12)
- Teenagers (12-18)
- Young Adults (18-24)
- Adults (Age 24+)
The report has provided a detailed breakup and analysis of the market based on the visitor demographics. This includes family with children (0-9), family with children (9-12), teenagers (12-18), young adults (18-24), and adults (age 24+).
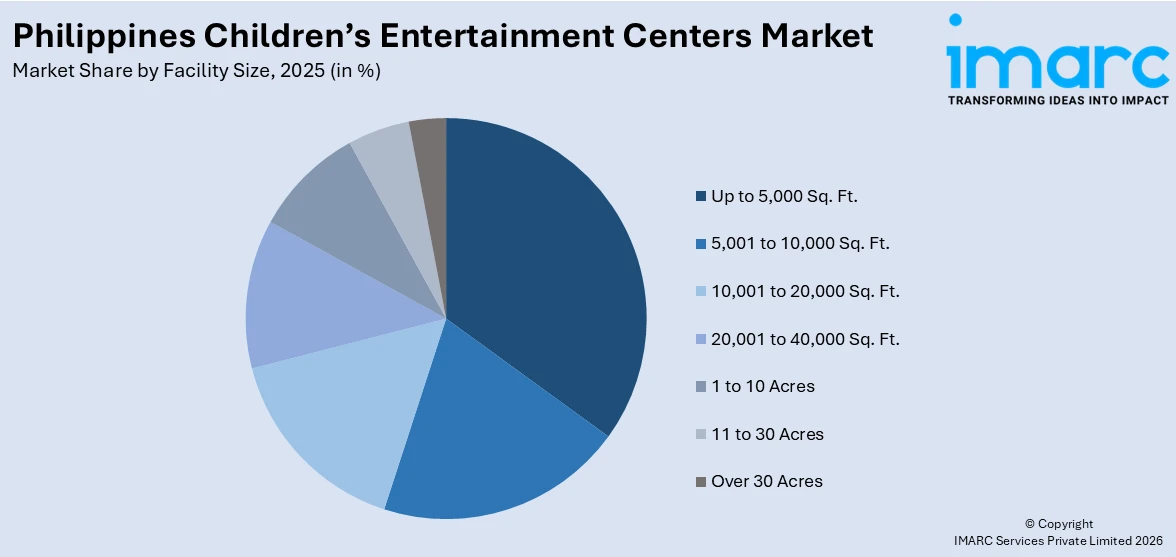
Facility Size Insights:
Access the comprehensive market breakdown Request Sample
- Up to 5,000 Sq. Ft.
- 5,001 to 10,000 Sq. Ft.
- 10,001 to 20,000 Sq. Ft.
- 20,001 to 40,000 Sq. Ft.
- 1 to 10 Acres
- 11 to 30 Acres
- Over 30 Acres
The report has provided a detailed breakup and analysis of the market based on the facility size. This includes up to 5,000 sq. ft., 5,001 to 10,000 sq. ft., 10,001 to 20,000 sq. ft., 20,001 to 40,000 sq. ft., 1 to 10 acres, 11 to 30 acres, and over 30 acres.
Revenue Source Insights:
- Entry Fees and Ticket Sales
- Food and Beverages
- Merchandising
- Advertising
- Others
The report has provided a detailed breakup and analysis of the market based on the revenue source. This includes entry fees and ticket sales, food and beverages, merchandising, advertising, and others.
Activity Area Insights:
- Arcade Studios
- AR and VR Gaming Zone
- Physical Play Activities
- Skill/Competition Games
- Others
A detailed breakup and analysis of the market based on the activity area have also been provided in the report. This includes arcade studios, AR and VR gaming zone, physical play activities, skill/competition games, and others.
Regional Insights:
- Luzon
- Visayas
- Mindanao
The report has also provided a comprehensive analysis of all the major regional markets, which include Luzon, Visayas, and Mindanao.
Competitive Landscape:
The market research report has also provided a comprehensive analysis of the competitive landscape. Competitive analysis such as market structure, key player positioning, top winning strategies, competitive dashboard, and company evaluation quadrant has been covered in the report. Also, detailed profiles of all major companies have been provided.
Philippines Children’s Entertainment Centers Market News:
- In March 2025, PlayPH Entertainment opened a 4,000‑sq‑m facility in Davao City, Mindanao. The site adds tech-driven attractions, such as a Family Interactive Arena, Creative Play Spaces, and a Family Challenge Zone. Weekly “Family Game Workshop” sessions aim to boost learning and bonding. The model blends interactive tech with family values, signaling rising investment beyond Manila.
Philippines Children’s Entertainment Centers Market Report Coverage:
| Report Features | Details |
|---|---|
| Base Year of the Analysis | 2025 |
| Historical Period | 2020-2025 |
| Forecast Period | 2026-2034 |
| Units | Million USD |
| Scope of the Report |
Exploration of Historical Trends and Market Outlook, Industry Catalysts and Challenges, Segment-Wise Historical and Future Market Assessment:
|
| Visitor Demographics Covered | Family With Children (0-9), Family With Children (9-12), Teenagers (12-18), Young Adults (18-24), Adults (Age 24+) |
| Facility Sizes Covered | Up to 5,000 Sq. Ft., 5,001 to 10,000 Sq. Ft., 10,001 to 20,000 Sq. Ft., 20,001 to 40,000 Sq. Ft., 1 to 10 Acres, 11 to 30 Acres, Over 30 Acres |
| Revenue Sources Covered | Entry Fees and Ticket Sales, Food and Beverages, Merchandising, Advertising, Others |
| Activity Areas Covered | Arcade Studios, AR and VR Gaming Zone, Physical Play Activities, Skill/Competition Games, Others |
| Regions Covered | Luzon, Visayas, Mindanao |
| Customization Scope | 10% Free Customization |
| Post-Sale Analyst Support | 10-12 Weeks |
| Delivery Format | PDF and Excel through Email (We can also provide the editable version of the report in PPT/Word format on special request) |
Key Questions Answered in This Report:
- How has the Philippines children’s entertainment centers market performed so far and how will it perform in the coming years?
- What is the breakup of the Philippines children’s entertainment centers market on the basis of visitor demographics?
- What is the breakup of the Philippines children’s entertainment centers market on the basis of facility size?
- What is the breakup of the Philippines children’s entertainment centers market on the basis of revenue source?
- What is the breakup of the Philippines children’s entertainment centers market on the basis of activity area?
- What is the breakup of the Philippines children’s entertainment centers market on the basis of region?
- What are the various stages in the value chain of the Philippines children’s entertainment centers market?
- What are the key driving factors and challenges in the Philippines children’s entertainment centers market?
- What is the structure of the Philippines children’s entertainment centers market and who are the key players?
- What is the degree of competition in the Philippines children’s entertainment centers market?
Key Benefits for Stakeholders:
- IMARC’s industry report offers a comprehensive quantitative analysis of various market segments, historical and current market trends, market forecasts, and dynamics of the Philippines children’s entertainment centers market from 2020-2034.
- The research report provides the latest information on the market drivers, challenges, and opportunities in the Philippines children’s entertainment centers market.
- Porter's five forces analysis assist stakeholders in assessing the impact of new entrants, competitive rivalry, supplier power, buyer power, and the threat of substitution. It helps stakeholders to analyze the level of competition within the Philippines children’s entertainment centers industry and its attractiveness.
- Competitive landscape allows stakeholders to understand their competitive environment and provides an insight into the current positions of key players in the market.
Need more help?
- Speak to our experienced analysts for insights on the current market scenarios.
- Include additional segments and countries to customize the report as per your requirement.
- Gain an unparalleled competitive advantage in your domain by understanding how to utilize the report and positively impacting your operations and revenue.
- For further assistance, please connect with our analysts.
 Request Customization
 Speak to an Analyst
 Request Brochure
 Inquire Before Buying
Benefits of Customization
- Personalize this research
- Triangulate with your data
- Get data as per your format and definition
- Gain a deeper dive into a specific application, geography, customer, or competitor
- Any level of personalization
Get in Touch With Us
UNITED STATES
Phone: +1-201-971-6302
INDIA
Phone: +91-120-433-0800
UNITED KINGDOM
Phone: +44-753-714-6104
Email: [email protected]
Client Testimonials


.webp)


