
Phosphoric Acid Prices, Trend, Chart, Demand, Market Analysis, News, Historical and Forecast Data Report 2026 Edition
Phosphoric Acid Price Trend, Index and Forecast
Track real-time and historical phosphoric acid prices across global regions. Updated monthly with market insights, drivers, and forecasts.
Phosphoric Acid Prices June 2026
| Region | Price (USD/Kg) | Latest Movement |
|---|---|---|
| Africa | 0.87 | -9.4% ↓ Down |
| Northeast Asia | 1.49 | 15.5% ↑ Up |
| Europe | 1.43 | -6.5% ↓ Down |
| North America | 1.23 | Unchanged |
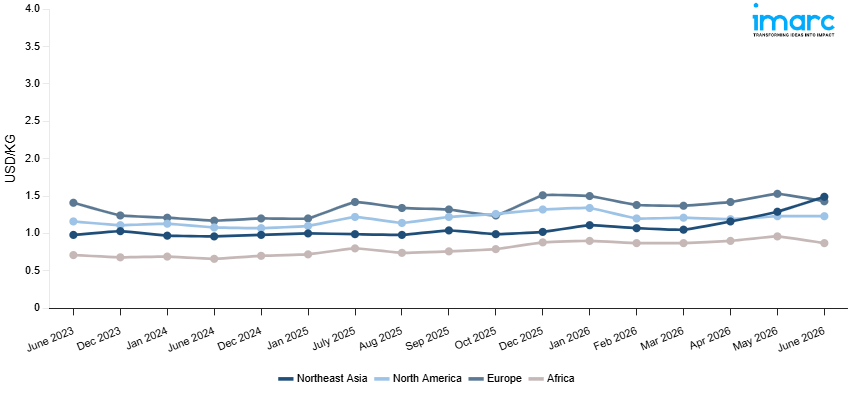
Phosphoric Acid Price Index (USD/KG):
The chart below highlights monthly phosphoric acid prices across different regions.
Get Access to Monthly/Quarterly/Yearly Prices, Request Sample
Market Overview Q1 Ending March 2026
Africa: The phosphoric acid prices in Africa reached 0.87 USD/KG in March 2026. The downward pricing movement registered between December and March 2026 was 1.1%. There was only a slight weakening in demand for fertilizers, food processing, and water treatment, leading to reduced buying activity and a slightly bearish sentiment in African markets during the review period. There was sufficient availability of import cargo in the North Africa and Middle East supplier regions, which kept the supply situation favorable and led to a slight decline in market prices for phosphoric acid in the region. A slight drop in the upstream costs of phosphate rock and sulfuric acid raw materials at the production plants lowered production costs and supported a decline in prevailing market prices.
Northeast Asia: The phosphoric acid prices in Northeast Asia reached 1.05 USD/KG in March 2026. The upward pricing movement registered between December and March 2026 was 2.9%. Marginally firming demand from the fertilizer manufacturing, food additive, and electronic chemical sectors provided modest procurement support and contributed to mildly bullish conditions across Northeast Asian markets during the review period. Slightly elevated upstream phosphate rock and sulfuric acid feedstock costs at regional production facilities placed incremental upward pressure on phosphoric acid manufacturing expenses and supported the prevailing marginal price increase throughout the quarter. Steady import cargo availability from key supplying regions maintained adequate supply conditions and limited the extent of upward price movement during the period.
Europe: The phosphoric acid prices in Europe reached 1.37 USD/KG in March 2026. The downward pricing movement registered between December and March 2026 was 9.3%. Weakened demand from the fertilizer, food and beverage, and industrial cleaning sectors reduced procurement activity and contributed to bearish phosphoric acid market conditions across European markets throughout the review period. Competitive import cargo availability from North African and Middle Eastern supplying nations exerted consistent downward pressure on prevailing European market rates, limiting regional producers' ability to sustain existing price levels during the quarter. Declining upstream phosphate rock and sulfuric acid feedstock costs at key producing facilities reduced manufacturing expenses and eroded the cost floor supporting prevailing regional price levels.
North America: The phosphoric acid prices in North America reached 1.21 USD/KG in March 2026. The downward pricing movement registered between December and March 2026 was 8.3%. A significant decline in demand from fertilizer mixing, food processing, and industrial chemicals led to lower purchases and contributed to bearishness in the phosphoric acid market in North America during the review period. Sufficient local production from phosphate mines and processing facilities led to excess supply and price competition among producers. Major decreases in input costs, such as phosphate rock and sulfuric acid used in local phosphoric acid production facilities, lowered manufacturing costs and weakened support for current phosphoric acid prices during the period. Reduced purchasing activity among downstream consumers, along with expectations of lower prices, supported the downward price trend during the review period.
Market Overview Q3 Ending September 2025
Africa: The upward trend was influenced by higher import costs from Morocco and Tunisia, the region’s key producers. Demand growth in fertilizer applications, particularly in Sub-Saharan countries reliant on phosphate-based inputs for maize and rice cultivation, supported the bullish momentum. Currency depreciation against the US dollar in Nigeria and South Africa further inflated the landed costs of imported acid. Logistics inefficiencies, including port congestion at Durban and Mombasa, compounded delivery delays, tightening local availability. Additionally, rising compliance costs related to handling hazardous chemicals added to distributors’ overheads, pushing prices upward across inland African markets.
Northeast Asia: China’s reduced export allocations due to domestic fertilizer prioritization constrained international supplies. Meanwhile, Taiwan and South Korea faced higher input costs for ammonia and sulfur, critical raw materials for acid production. Seasonal demand upticks from food-grade processors and lithium iron phosphate (LFP) battery manufacturers in China and Japan contributed to robust consumption. Freight charges from Chinese ports to Southeast Asian buyers also climbed, driven by capacity constraints in container shipping. Regulatory compliance costs on environmental standards for Chinese producers further elevated domestic production expenses, feeding into global price escalations across the region.
Europe: The decline was mainly attributed to subdued fertilizer demand in Western Europe amid persistent inflation and higher borrowing costs limiting agricultural spending. Additionally, cheaper imports from North Africa and the Middle East exerted downward pressure on domestic pricing. However, high energy costs across Germany, France, and Italy continued to weigh on local production economics, particularly given the dependency on sulfur imports. Port handling bottlenecks in Rotterdam and Antwerp raised distribution costs, though oversupply from Morocco and Tunisia offset upward pricing pressures. The regional slowdown in demand from detergents and food-grade applications further contributed to the bearish market trend.
North America: The upward trajectory was underpinned by robust fertilizer demand in the US Midwest, where favorable weather spurred strong corn and soybean planting. Tight supply conditions were exacerbated by reduced import flows from Morocco due to geopolitical disruptions and shipping route diversions. Domestic producers in Florida and Louisiana contended with high raw material and energy costs, further pushing up production costs. Currency fluctuations between the Canadian dollar and US dollar slightly increased import burdens for Canadian buyers. Rising compliance requirements under hazardous substance regulations in the US also contributed to higher distribution costs for food- and pharma-grade applications.
Phosphoric Acid Price Trend, Market Analysis, and News
IMARC's latest publication, “Phosphoric Acid Prices, Trend, Chart, Demand, Market Analysis, News, Historical and Forecast Data Report 2026 Edition,” presents a detailed examination of the phosphoric acid market, providing insights into both global and regional trends that are shaping prices. This report delves into the spot price of phosphoric acid at major ports and analyzes the composition of prices, including FOB and CIF terms. It also presents detailed phosphoric acid prices trend analysis by region, covering North America, Europe, Asia Pacific, Latin America, and Middle East and Africa. The factors affecting phosphoric acid pricing, such as the dynamics of supply and demand, geopolitical influences, and sector-specific developments, are thoroughly explored. This comprehensive report helps stakeholders stay informed with the latest market news, regulatory updates, and technological progress, facilitating informed strategic decision-making and forecasting.
.webp)
Phosphoric Acid Industry Analysis
The global phosphoric acid industry size reached USD 50.8 Billion in 2025. By 2034, IMARC Group expects the market to reach USD 72.6 Billion, at a projected CAGR of 3.92% during 2026-2034. The market is driven by expanding fertilizer demand in emerging economies, increasing use of food grade phosphoric acid in beverages, rising deployment in lithium iron phosphate batteries for EVs, and growing applications in pharmaceuticals and detergents.
Latest developments in the Phosphoric Acid Industry:
- May 2025: Caitlyn India Private Limited (CIPL) announced an investment of Rs. 400 crores to establish an integrated phosphoric acid plant in India with a planned capacity of 50,000 tonnes per annum (TPA). The proposed facility is to be located in a port-accessible industrial zone, with the company assessing potential sites in southern India.
- October 2020: ICL signed an agreement to acquire Fertilaqua, a prominent Brazilian company in the plant nutrition industry. This acquisition showcases ICL's strategic move to expand its presence and offerings in the agriculture industry, particularly in Brazil enhancing its position in the lucrative specialty plant nutrition market.
- August 2020: EMAPHOS launched a new facility to produce purified phosphoric acid. The company expects to double its production capacity with a new plant with a target to reach 2,80,000 tons of annual output by 2022. The expansion will position EMAPHOS as leaders in purified wet process phosphoric acid production, aligning with market shifts and emphasizing downstream integration for high-value-added products.
Product Description
Phosphoric acid (H₃PO₄) is a transparent, odorless, inorganic mineral acid widely used in industrial and food applications. Classified as a non-volatile, moderately strong acid, it plays a critical role in the global phosphate value chain, ranking among the most consumed acids worldwide. Its defining properties include high solubility in water and strong reactivity with alkaline compounds, making it essential in fertilizer production. Industrial applications include its role as a key input in phosphate fertilizers, rust removal formulations, detergents, and water treatment chemicals. In the food and beverage sector, it is widely used as an acidity regulator and flavor enhancer, while in energy storage, it supports the performance of lithium iron phosphate (LFP) batteries.
Report Coverage
| Key Attributes | Details |
|---|---|
| Product Name | Phosphoric Acid |
| Report Features | Exploration of Historical Trends and Market Outlook, Industry Demand, Industry Supply, Gap Analysis, Challenges, Phosphoric Acid Price Analysis, and Segment-Wise Assessment. |
| Currency/Units | US$ (Data can also be provided in local currency) or Metric Tons |
| Region/Countries Covered | The current coverage includes analysis at the global and regional levels only. Based on your requirements, we can also customize the report and provide specific information for the following countries: Asia Pacific: China, India, Indonesia, Pakistan, Bangladesh, Japan, Philippines, Vietnam, Thailand, South Korea, Malaysia, Nepal, Taiwan, Sri Lanka, Hongkong, Singapore, Australia, and New Zealand Europe: Germany, France, United Kingdom, Italy, Spain, Russia, Turkey, Netherlands, Poland, Sweden, Belgium, Austria, Ireland, Switzerland, Norway, Denmark, Romania, Finland, Czech Republic, Portugal and Greece North America: United States and Canada Latin America: Brazil, Mexico, Argentina, Columbia, Chile, Ecuador, and Peru Middle East & Africa: Saudi Arabia, UAE, Israel, Iran, South Africa, Nigeria, Oman, Kuwait, Qatar, Iraq, Egypt, Algeria, and Morocco The list of countries presented is not exhaustive. Information on additional countries can be provided if required by the client. |
| Information Covered for Key Suppliers |
|
| Customization Scope | The report can be customized as per the requirements of the customer |
| Report Price and Purchase Option |
Plan A: Monthly Updates - Annual Subscription
Plan B: Quarterly Updates - Annual Subscription
Plan C: Biannually Updates - Annual Subscription
|
| Post-Sale Analyst Support | 360-degree analyst support after report delivery |
| Delivery Format | PDF and Excel through email (We can also provide the editable version of the report in PPT/Word format on special request) |
Key Benefits for Stakeholders:
- IMARC’s report presents a detailed analysis of phosphoric acid pricing, covering global and regional trends, spot prices at key ports, and a breakdown of Ex Works, FOB, and CIF prices.
- The study examines factors affecting phosphoric acid price trend, including raw material costs, supply-demand shifts, geopolitical impacts, and industry developments, offering insights for informed decision-making.
- The competitive landscape review equips stakeholders with crucial insights into the latest market news, regulatory changes, and technological advancements, ensuring a well-rounded, strategic overview for forecasting and planning.
- IMARC offers various subscription options, including monthly, quarterly, and biannual updates, allowing clients to stay informed with the latest market trends, ongoing developments, and comprehensive market insights. The phosphoric acid price charts ensure our clients remain at the forefront of the industry.
Frequently Asked Questions About the Phosphoric Acid Prices Report
The phosphoric acid prices in June 2026 were 0.87 USD/KG in Africa, 1.49 USD/KG in Northeast Asia, 1.43 USD/KG in Europe, and 1.23 USD/KG in North America.
The phosphoric acid pricing data is updated on a monthly basis.
We provide the pricing data primarily in the form of an Excel sheet and a PDF.
Yes, our report includes a forecast for phosphoric acid prices.
The regions covered include North America, Europe, Asia Pacific, Middle East, and Latin America. Countries can be customized based on the request (additional charges may be applicable).
Yes, we provide both FOB and CIF prices in our report.
Need more help?
- Speak to our experienced analysts for insights on the current market scenarios.
- Include additional segments and countries to customize the report as per your requirement.
- Gain an unparalleled competitive advantage in your domain by understanding how to utilize the report and positively impacting your operations and revenue.
- For further assistance, please connect with our analysts.
 Request Customization
 Inquire Before Buying
 Speak to an Analyst
 Request Brochure
Benefits of Customization
- Personalize this research
- Triangulate with your data
- Get data as per your format and definition
- Gain a deeper dive into a specific application, geography, customer, or competitor
- Any level of personalization
Get in Touch With Us
UNITED STATES
Phone: +1-201-971-6302
INDIA
Phone: +91-120-433-0800
UNITED KINGDOM
Phone: +44-753-714-6104
Email: [email protected]
Client Testimonials


.webp)


Related Reports
Why Choose Us
IMARC offers trustworthy, data-centric insights into commodity pricing and evolving market trends, enabling businesses to make well-informed decisions in areas such as procurement, strategic planning, and investments. With in-depth knowledge spanning more than 1000 commodities and a vast global presence in over 150 countries, we provide tailored, actionable intelligence designed to meet the specific needs of diverse industries and markets.
1000
+Commodities
150
+Countries Covered
3000
+Clients
20
+Industry
Robust Methodologies & Extensive Resources
IMARC delivers precise commodity pricing insights using proven methodologies and a wealth of data to support strategic decision-making.
Subscription-Based Databases
Our extensive databases provide detailed commodity pricing, import-export trade statistics, and shipment-level tracking for comprehensive market analysis.
Primary Research-Driven Insights
Through direct supplier surveys and expert interviews, we gather real-time market data to enhance pricing accuracy and trend forecasting.
Extensive Secondary Research
We analyze industry reports, trade publications, and market studies to offer tailored intelligence and actionable commodity market insights.
Trusted by 3000+ industry leaders worldwide to drive data-backed decisions. From global manufacturers to government agencies, our clients rely on us for accurate pricing, deep market intelligence, and forward-looking insights.