Polyethylene Glycol Prices, Trend, Chart, Demand, Market Analysis, News, Historical and Forecast Data Report 2025 Edition
Polyethylene Glycol Price Trend, Index and Forecast
Track the latest insights on polyethylene glycol price trend and forecast with detailed analysis of regional fluctuations and market dynamics across North America, Latin America, Central Europe, Western Europe, Eastern Europe, Middle East, North Africa, West Africa, Central and Southern Africa, Central Asia, Southeast Asia, South Asia, East Asia, and Oceania.
Polyethylene Glycol Prices Outlook Q3 2025
- USA: USD 1100/MT
- China: USD 1097/MT
- Belgium: USD 1232/MT
- Saudi Arabia: USD 968/MT
- Germany: USD 1226/MT
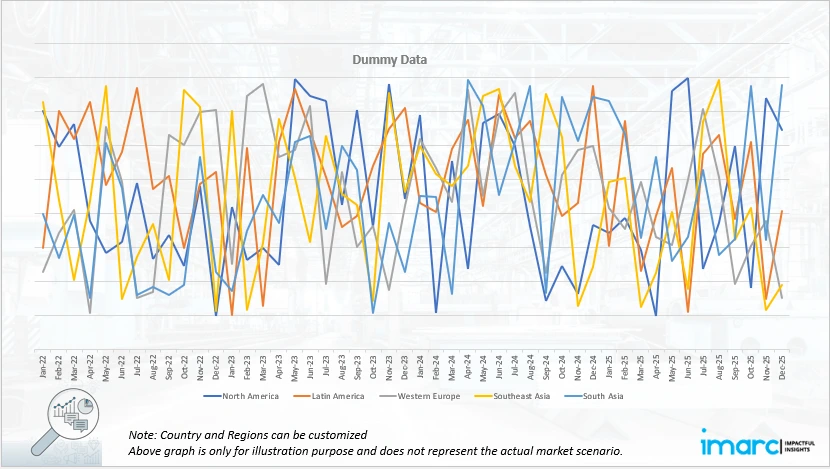
Polyethylene Glycol Price Chart

Get real-time access to monthly/quaterly/yearly prices, Request Sample
During the third quarter of 2025, the polyethylene glycol prices in the USA reached 1100 USD/MT in September. The price movement reflected a moderate decline relative to the prior quarter, signaling softening demand in certain downstream sectors such as industrial lubricants. Supply-side conditions remained stable, though logistics and feedstock costs contributed a fraction of upward cost pressure. In addition, currency‐exchange headwinds and an increase in imported feedstock shipments subtly influenced landed costs.
During the third quarter of 2025, the polyethylene glycol prices in China reached 1097 USD/MT in September. In China, the modest uptick from the previous quarter indicated that incremental demand from personal care and pharmaceutical-grade applications regained some strength. Domestic production capacity remained healthy, and imports of feedstocks were steady, limiting major supply disruptions. However, elevated logistics and port handling challenges, as well as regulatory compliance costs for high‐purity grades, applied upward pressure.
During the third quarter of 2025, the polyethylene glycol prices in Belgium reached 1232 USD/MT in September. The pricing in Belgium rose modestly, underpinned by relatively stable demand from European personal-care and pharmaceutical sectors. On the supply side, higher energy and compliance costs (including EU chemical regulations) increased the production cost base. Transportation and intra-European logistics costs remained elevated compared with prior periods, which contributed to the cost pass-through into final pricing.
During the third quarter of 2025, the polyethylene glycol prices in Saudi Arabia reached 968 USD/MT in September. In Saudi Arabia, prices moved downward despite global cost pressures; regional demand softness in industrial and construction‐related polymer derivatives weighed on uptake. On the supply side, local producers were able to keep margins stable via feedstock advantages, so competitiveness remained strong. Domestic logistics and export port‐handling costs rose, though not enough to offset the lower demand environment.
During the third quarter of 2025, the polyethylene glycol prices in Germany reached 1226 USD/MT in September. In Germany, prices decreased modestly compared with the prior quarter, reflecting a combination of softer downstream demand, particularly in automotive coatings and industrial polymers and increased cost control measures by buyers. On the supply side, regulatory and energy cost burdens remained high, but producers moderated price increases. Logistics and customs costs for higher purity grades also increased, yet competitive pressure inhibited full cost pass-through into market pricing.
Polyethylene Glycol Prices Outlook Q2 2025
- USA: USD 1125/MT
- China: USD 1085/MT
- Belgium: USD 1210/MT
- Saudi Arabia: USD 985/MT
- Germany: USD 1248/MT
During the second quarter of 2025, the polyethylene glycol prices in the USA reached 1125 USD/MT in June. At that time, demand from pharmaceutical and personal-care applications remained comparatively firm, but industrial end-use sectors showed signs of contraction, which weighed on pricing. Raw material (ethylene oxide) cost fluctuations and higher feedstock import logistics applied upward cost pressure, but competitive dynamics constrained full cost pass-through.
During the second quarter of 2025, the polyethylene glycol prices in China reached 1085 USD/MT in June. China’s market during Q2 faced mild headwinds in industrial polymer consumption, which limited pricing upside. On the supply side, robust domestic capacity and steady feedstock availability prevented major shortages, and logistics from seaports experienced moderate delays that impacted landed costs.
During the second quarter of 2025, the polyethylene glycol prices in Belgium reached 1210 USD/MT in June. In Belgium, the market reflected moderate downwards pressure as buyer sentiment in Europe’s personal-care and pharmaceutical sectors became more cautious. Energy and compliance costs for production plants in the region increased, but producers exhibited restraint in raising prices; moreover, logistics within Europe became slightly tighter, increasing transport surcharges.
During the second quarter of 2025, the polyethylene glycol prices in Saudi Arabia reached 985 USD/MT in June. In Saudi Arabia, the price reduction in Q2 was driven by lower industrial and polymer derivative demand, particularly from regional construction and manufacturing sectors. While feedstock supply remained competitive, export logistics and port handling costs rose slightly. Domestic cost structures were under pressure from energy and regulatory compliance, but the weaker demand environment dominated, resulting in the price decline.
During the second quarter of 2025, the polyethylene glycol prices in Germany reached 1248 USD/MT in June. Germany’s Q2 pricing reflected a sharper downward movement, owing to significant softness in downstream coatings, adhesives, and automotive segments. Production cost pressures from energy and regulatory compliance persisted, but competitive market dynamics and cautious buyer sentiment limited pricing resilience.
Regional Coverage
The report provides a detailed analysis of the market across different regions, each with unique pricing dynamics influenced by localized market conditions, supply chain intricacies, and geopolitical factors. This includes price trends, price forecast and supply and demand trends for each region, along with spot prices by major ports. The report also provides coverage of FOB and CIF prices, as well as the key factors influencing polyethylene glycol prices.
Europe Polyethylene Glycol Price Trend
Q3 2025:
In Q3 2025, the polyethylene glycol price index reflected a mixed movement across the continent, though individual countries varied. Demand from the pharmaceutical and personal-care sectors remained stable while industrial polymer applications showed softness. On the supply side, energy and regulatory compliance costs increased for production facilities, and rising logistics and intra-European transport surcharges weighed on margins. Import feedstock pricing and port-handling delays further added to the cost base, but competitive market dynamics prevented aggressive price hikes.
Q2 2025:
In Q2 2025, the polyethylene glycol price index in Europe showed a more pronounced decline, reflecting weaker industrial polymer demand and cautious buyer behavior in personal care and pharmaceutical sectors. Production cost pressures stemming from energy and regulatory burdens were present but not fully passed through to customers due to stagnating demand. Logistics constraints and elevated transport surcharges added cost, but competitive forces prevented major price hikes. The net effect was modest downward pricing in this region during the quarter.
This analysis can be extended to include detailed polyethylene glycol price information for a comprehensive list of countries.
| Region | Countries Covered |
|---|---|
| Europe | Germany, France, United Kingdom, Italy, Spain, Russia, Turkey, Netherlands, Poland, Sweden, Belgium, Austria, Ireland, Switzerland, Norway, Denmark, Romania, Finland, Czech Republic, Portugal, and Greece, among other European countries. |
North America Polyethylene Glycol Price Trend
Q3 2025:
In Q3 2025, the polyethylene glycol price index in North America experienced a marginal decline despite cost pressure increases. While the pharmaceutical and personal-care demand remained solid, industrial polymer demand softened and logistics and raw-material cost escalation constrained producers’ flexibility. Currency and import feedstock dynamics added cost unpredictable elements. Manufacturers moderated pricing actions to retain market share, which limited price increases. The net result was a modest downward trend overall for PEG pricing in North America during the quarter.
Q2 2025:
In Q2 2025, North America’s polyethylene glycol pricing followed a downward trend as industrial applications such as coatings and polymers contracted, and demand from personal-care sectors remained flat. Rising feedstock and import logistics costs increased challenges, but producers absorbed much of the cost burden to maintain market share. Currency and trade dynamics added uncertainty. The net pricing movement was a moderate decline across the region for PEG.
Specific polyethylene glycol historical data within the United States and Canada can also be provided.
| Region | Countries Covered |
|---|---|
| North America | United States and Canada |
Middle East and Africa Polyethylene Glycol Price Trend
Q3 2025:
In Q3 2025, the Middle East and Africa region saw price softening for polyethylene glycol driven by weaker construction and manufacturing end-use demand, especially in petrochemical‐derivative and polymer sectors. Supply advantages in local feedstock meant producers could offset cost increases, so competitive pricing emerged. Export logistics and port‐handling charges rose, but the weaker regional demand environment dominated. Thus, PEG prices in the region trended downwards rather than reflecting full cost‐pass-through.
Q2 2025:
In Q2 2025, the Middle East and Africa region recorded declining polyethylene glycol prices due to subdued demand in petrochemical‐derivative and construction sectors. Local feedstock availability remained advantageous, limiting supply constraints, yet export logistics and rising port handling costs grew. Buyers remained cautious and competitive behavior among producers applied downward pricing pressure. The region thus saw a modest decline in PEG prices in the quarter.
In addition to region-wise data, information on polyethylene glycol prices for countries can also be provided.
| Region | Countries Covered |
|---|---|
| Middle East & Africa | Saudi Arabia, UAE, Israel, Iran, South Africa, Nigeria, Oman, Kuwait, Qatar, Iraq, Egypt, Algeria, and Morocco, among other Middle Eastern and African countries. |
Asia Pacific Polyethylene Glycol Price Trend
Q3 2025:
In Q3 2025, Asia Pacific experienced modest upward movement in polyethylene glycol pricing due to recovering demand in pharmaceutical and personal-care markets, especially in large economies such as China and India. Domestic manufacturing capacity remained robust; however, rising logistics and import‐feedstock costs exerted upward pressure. Industrial polymer demand remained mixed, but the stable consumption in higher‐grade applications allowed producers to increment prices. The regional effect was limited but positive for PEG pricing.
Q2 2025:
In Q2 2025, Asia Pacific’s polyethylene glycol prices trended downward or were flat as industrial polymer consumption remained weak, though higher-grade pharmaceutical and personal-care demand held firmer. Domestic manufacturing capacity excesses and import logistics challenges weighed on price resilience. Rising energy and compliance costs for production plants added upward cost, but weak demand prevented full pass-through, resulting in overall downward pricing pressure.
This polyethylene glycol price analysis can be expanded to include a comprehensive list of countries within the region.
| Region | Countries Covered |
|---|---|
| Asia Pacific | China, India, Indonesia, Pakistan, Bangladesh, Japan, Philippines, Vietnam, Thailand, South Korea, Malaysia, Nepal, Taiwan, Sri Lanka, Hongkong, Singapore, Australia, and New Zealand, among other Asian countries. |
Latin America Polyethylene Glycol Price Trend
Q3 2025:
Latin America's polyethylene glycol market is predominantly influenced by its rich natural reserves, particularly in countries like Chile and Brazil. However, political instability and inconsistent regulatory frameworks can lead to significant volatility in polyethylene glycol prices.
Q2 2025:
Infrastructure challenges and logistical inefficiencies often impact the supply chain, affecting the region's ability to meet international demand consistently. Moreover, the polyethylene glycol price index, economic fluctuations, and currency devaluation are critical factors that need to be considered when analyzing polyethylene glycol pricing trends in this region.
This comprehensive review can be extended to include specific countries within the region.
| Region | Countries Covered |
|---|---|
| Latin America | Brazil, Mexico, Argentina, Columbia, Chile, Ecuador, and Peru, among other Latin American countries. |
Polyethylene Glycol Price Trend, Market Analysis, and News
IMARC's latest publication, “Polyethylene Glycol Prices, Trend, Chart, Demand, Market Analysis, News, Historical and Forecast Data Report 2025 Edition,” presents a detailed examination of the polyethylene glycol market, providing insights into both global and regional trends that are shaping prices. This report delves into the spot price of polyethylene glycol at major ports and analyzes the composition of prices, including FOB and CIF terms. It also presents detailed polyethylene glycol prices trend analysis by region, covering North America, Europe, Asia Pacific, Latin America, and Middle East and Africa. The factors affecting polyethylene glycol pricing, such as the dynamics of supply and demand, geopolitical influences, and sector-specific developments, are thoroughly explored. This comprehensive report helps stakeholders stay informed with the latest market news, regulatory updates, and technological progress, facilitating informed strategic decision-making and forecasting.

Polyethylene Glycol Industry Analysis
The global polyethylene glycol market size reached USD 5.67 Billion in 2025. By 2034, IMARC Group expects the market to reach USD 9.63 Billion, at a projected CAGR of 6.05% during 2026-2034. The market is primarily driven by the heightened demand from pharmaceutical, personal-care and industrial applications, rising healthcare expenditure, expanding personal‐care consumption and evolving industrial polymer uses.
Latest News and Developments:
- May 2025: BASF announced the launch of Pluriol A 2400 I, a new reactive polyethylene glycol (PEG) grade, for the European market. The product is designed for use in polycarboxylate ether (PCE) superplasticizers, specifically third-generation solutions for concrete admixtures.
Product Description
Polyethylene glycol (PEG) is a water-soluble polymer produced by polymerizing ethylene oxide, available in a range of molecular weights and physical forms, including liquids, waxy solids and powders. Its unique attributes include excellent solubility in water and many organic solvents, biocompatibility, chemical stability and low toxicity, making it a key material in global production hierarchies of excipients, emollients and industrial additives. In the pharmaceutical industry, PEG is widely used as a binder, solvent, stabilizer and in drug delivery formulations (including PEGylated therapeutics) where it improves bioavailability and stability. In personal-care products it functions as a humectant, emulsifier and lubricant in creams, lotions, shampoos and toothpastes. In industrial applications, PEG is applied as a lubricant, plasticizer, surfactant, anti-foaming agent and in coatings, adhesives and polymer modification. Its versatility across sectors underpins its strategic importance in manufacturing and formulation processes.
Report Coverage
| Key Attributes | Details |
|---|---|
| Product Name | Polyethylene Glycol |
| Report Features | Exploration of Historical Trends and Market Outlook, Industry Demand, Industry Supply, Gap Analysis, Challenges, Polyethylene Glycol Price Analysis, and Segment-Wise Assessment. |
| Currency/Units | US$ (Data can also be provided in local currency) or Metric Tons |
| Region/Countries Covered | The current coverage includes analysis at the global and regional levels only. Based on your requirements, we can also customize the report and provide specific information for the following countries: Asia Pacific: China, India, Indonesia, Pakistan, Bangladesh, Japan, Philippines, Vietnam, Thailand, South Korea, Malaysia, Nepal, Taiwan, Sri Lanka, Hongkong, Singapore, Australia, and New Zealand* Europe: Germany, France, United Kingdom, Italy, Spain, Russia, Turkey, Netherlands, Poland, Sweden, Belgium, Austria, Ireland, Switzerland, Norway, Denmark, Romania, Finland, Czech Republic, Portugal and Greece* North America: United States and Canada Latin America: Brazil, Mexico, Argentina, Columbia, Chile, Ecuador, and Peru* Middle East & Africa: Saudi Arabia, UAE, Israel, Iran, South Africa, Nigeria, Oman, Kuwait, Qatar, Iraq, Egypt, Algeria, and Morocco* *The list of countries presented is not exhaustive. Information on additional countries can be provided if required by the client. |
| Information Covered for Key Suppliers |
|
| Customization Scope | The report can be customized as per the requirements of the customer |
| Report Price and Purchase Option |
Plan A: Monthly Updates - Annual Subscription
Plan B: Quarterly Updates - Annual Subscription
Plan C: Biannually Updates - Annual Subscription
|
| Post-Sale Analyst Support | 360-degree analyst support after report delivery |
| Delivery Format | PDF and Excel through email (We can also provide the editable version of the report in PPT/Word format on special request) |
Key Benefits for Stakeholders:
- IMARC’s report presents a detailed analysis of polyethylene glycol pricing, covering global and regional trends, spot prices at key ports, and a breakdown of Ex Works, FOB, and CIF prices.
- The study examines factors affecting polyethylene glycol price trend, including raw material costs, supply-demand shifts, geopolitical impacts, and industry developments, offering insights for informed decision-making.
- The competitive landscape review equips stakeholders with crucial insights into the latest market news, regulatory changes, and technological advancements, ensuring a well-rounded, strategic overview for forecasting and planning.
- IMARC offers various subscription options, including monthly, quarterly, and biannual updates, allowing clients to stay informed with the latest market trends, ongoing developments, and comprehensive market insights. The polyethylene glycol price charts ensure our clients remain at the forefront of the industry.
Need more help?
- Speak to our experienced analysts for insights on the current market scenarios.
- Include additional segments and countries to customize the report as per your requirement.
- Gain an unparalleled competitive advantage in your domain by understanding how to utilize the report and positively impacting your operations and revenue.
- For further assistance, please connect with our analysts.
Why Choose Us
IMARC offers trustworthy, data-centric insights into commodity pricing and evolving market trends, enabling businesses to make well-informed decisions in areas such as procurement, strategic planning, and investments. With in-depth knowledge spanning more than 1000 commodities and a vast global presence in over 150 countries, we provide tailored, actionable intelligence designed to meet the specific needs of diverse industries and markets.
1000
+Commodities
150
+Countries Covered
3000
+Clients
20
+Industry
Robust Methodologies & Extensive Resources
IMARC delivers precise commodity pricing insights using proven methodologies and a wealth of data to support strategic decision-making.
Subscription-Based Databases
Our extensive databases provide detailed commodity pricing, import-export trade statistics, and shipment-level tracking for comprehensive market analysis.
Primary Research-Driven Insights
Through direct supplier surveys and expert interviews, we gather real-time market data to enhance pricing accuracy and trend forecasting.
Extensive Secondary Research
We analyze industry reports, trade publications, and market studies to offer tailored intelligence and actionable commodity market insights.
Trusted by 3000+ industry leaders worldwide to drive data-backed decisions. From global manufacturers to government agencies, our clients rely on us for accurate pricing, deep market intelligence, and forward-looking insights.
 Request Customization
 Inquire Before Buying
 Speak to an Analyst
 Request Brochure


.webp)


.webp)


