
Polylactic Acid Prices, Trend, Chart, Demand, Market Analysis, News, Historical and Forecast Data Report 2026 Edition
Polylactic Acid (PLA) Price Trend, Index and Forecast
Track real-time and historical polylactic acid (PLA) prices across global regions. Updated monthly with market insights, drivers, and forecasts.
Polylactic Acid (PLA) Prices July 2026
| Region | Price (USD/Kg) | Latest Movement |
|---|---|---|
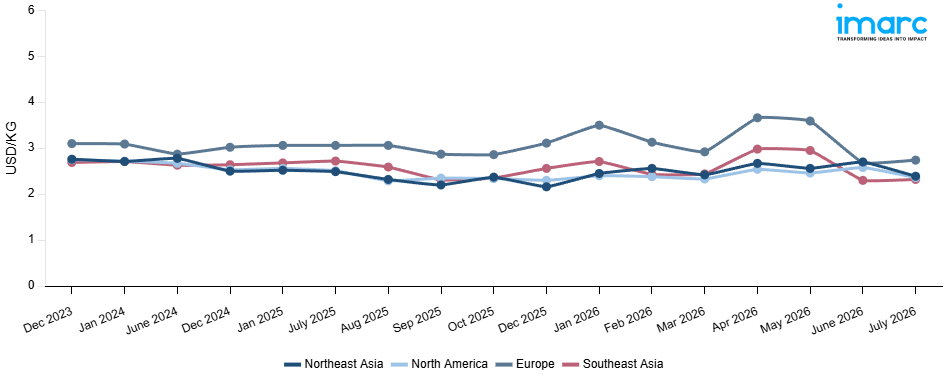
| Northeast Asia | 2.39 | -11.5% ↓ Down |
| Europe | 2.74 | 2.2% ↑ Up |
| Southeast Asia | 2.32 | 0.9% ↑ Up |
| North America | 2.36 | -8.5% ↓ Down |
Polylactic Acid (PLA) Price Index (USD/KG):
The chart below highlights monthly polylactic acid (PLA) prices across different regions.
Get Access to Monthly/Quarterly/Yearly Prices, Request Sample
Market Overview Q1 Ending March 2026
Northeast Asia: The polylactic acid (PLA) prices in Northeast Asia reached 2.42 USD/KG in March 2026. The upward pricing movement registered between December and March 2026 was 12.0%. Strong demand from the biodegradable packaging, disposable service ware, and specialty fiber manufacturing sectors drove robust PLA procurement activity and reinforced bullish pricing conditions across Northeast Asian markets throughout the review period. Rising upstream lactic acid and lactide feedstock costs at regional production facilities elevated manufacturing expenses significantly and sustained upward pressure on prevailing regional market rates during the quarter.
Europe: The polylactic acid (PLA) prices in Europe reached 2.92 USD/KG in March 2026. The downward pricing movement registered between December and March 2026 was 6.1%. Reduced buying interest from segments of the industry, such as biodegradable packaging, agricultural films, and specialty fibers, led to a decline in purchase interest, resulting in poor market performance for PLA in European markets during the review period. Competing cargo shipments from Asian supplier countries had been continually putting downward pressure on European market prices, making it difficult for local suppliers to sustain current market prices during the quarter.
Southeast Asia: The polylactic acid (PLA) prices in Southeast Asia reached 2.44 USD/KG in March 2026. The downward pricing movement registered between December and March 2026 was 4.7%. Softening demand from the biodegradable packaging, disposable product, and specialty fiber manufacturing sectors reduced procurement activity and contributed to bearish PLA market conditions across Southeast Asian markets throughout the review period. Adequate import cargo availability from Northeast Asian and European supplying regions maintained sufficient domestic supply conditions and placed consistent downward pressure on prevailing regional market rates during the quarter. Declining upstream lactic acid feedstock and biopolymer processing costs at key producing facilities reduced manufacturing expenses and weakened the cost support for existing polylactic acid price levels throughout the period.
North America: The polylactic acid (PLA) prices in North America reached 2.33 USD/KG in March 2026. The upward pricing movement registered between December and March 2026 was 1.3%. The demand for sustainable packaging, disposable serve ware, and biomedical manufacturing was relatively stable, offering moderate buying power and resulting in slightly positive market sentiments in North America during the reporting period. The rise in input prices for lactic acid and lactides at local and imported production units added slightly to PLA manufacturing costs and helped maintain the existing marginal price hikes during the quarter. The stability in import cargoes from Asian source countries ensured sufficient supply levels and prevented any major price hikes during the period.
Market Overview Q3 Ending September 2025
Northeast Asia: In Northeast Asia, PLA prices declined as weaker demand from packaging and textile applications weighed on market sentiment. The keyword price index reflected sluggish procurement, with downstream processors reducing orders amid sufficient stock availability. Ample feedstock supplies from corn-based lactic acid production also added to oversupply conditions. Limited export demand and subdued domestic consumption further reinforced bearish pricing, with suppliers unable to secure stronger margins during the quarter.
Europe: In Europe, PLA prices fell sharply, driven by muted consumption from packaging, consumer goods, and bioplastic converters. The keyword price index dropped as excess inventory levels across distributors coincided with weaker seasonal buying. Additionally, competitive imports placed downward pressure on domestic suppliers, while lower raw material costs added to the bearish momentum. Despite policy support for sustainable materials, short-term demand contraction limited any upward push on values.
Southeast Asia: In Southeast Asia, PLA prices recorded the steepest decline, as downstream demand from packaging and industrial users remained subdued. The keyword price index trended lower amid abundant supply and weak procurement activity from local converters. While feedstock production was steady, slowing export opportunities and cautious inventory management by processors compounded bearish sentiment. Market participants adopted a wait-and-watch approach, further intensifying the downward trajectory in regional prices.
North America: In North America, PLA prices rose moderately as packaging and bioplastic applications experienced stronger seasonal demand. The keyword price index moved higher, supported by increased procurement from consumer goods and food packaging sectors. While supply availability remained sufficient, higher interest in bio-based and sustainable materials added upward momentum. Improved demand fundamentals in domestic markets helped regional producers achieve firmer price realizations compared to bearish global trends.
Polylactic Acid (PLA) Price Trend, Market Analysis, and News
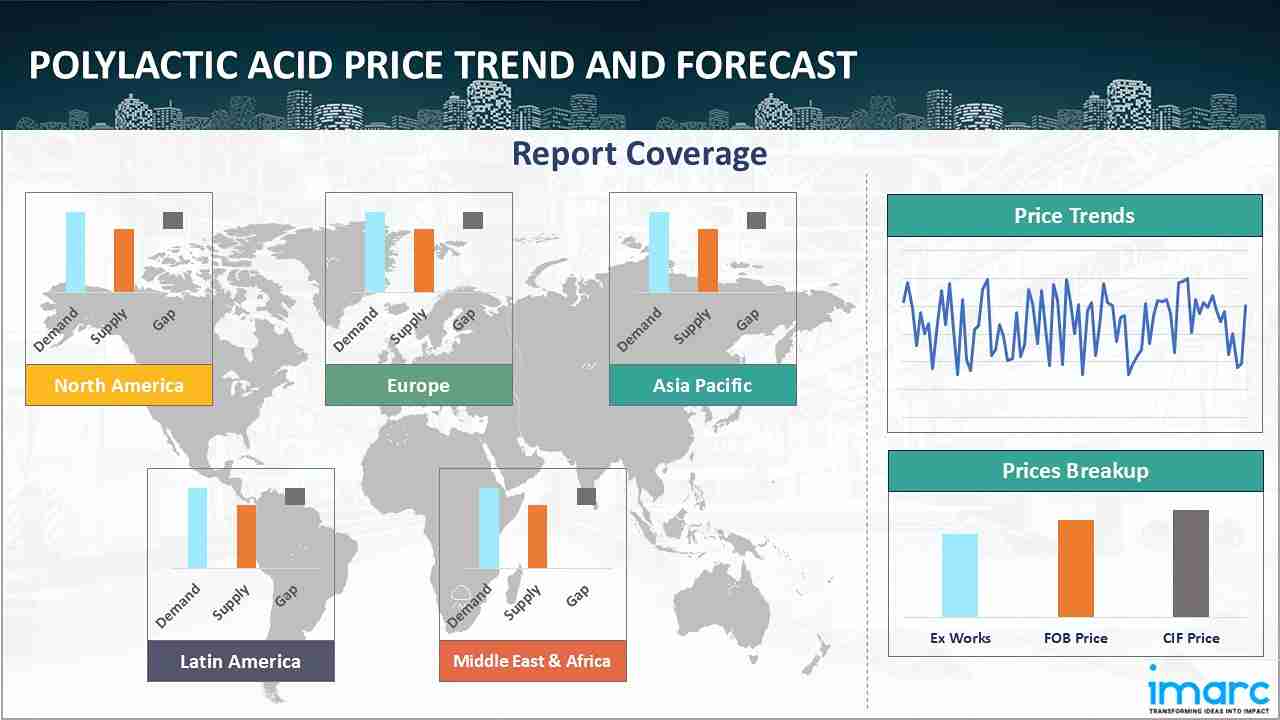
IMARC's latest publication, “Polylactic Acid (PLA) Prices, Trend, Chart, Demand, Market Analysis, News, Historical and Forecast Data Report 2026 Edition,” presents a detailed examination of the polylactic acid (PLA) market, providing insights into both global and regional trends that are shaping prices. This report delves into the spot price of polylactic acid (PLA) at major ports and analyzes the composition of prices, including FOB and CIF terms. It also presents detailed polylactic acid (PLA) prices trend analysis by region, covering North America, Europe, Asia Pacific, Latin America, and Middle East and Africa. The factors affecting polylactic acid (PLA) pricing, such as the dynamics of supply and demand, geopolitical influences, and sector-specific developments, are thoroughly explored. This comprehensive report helps stakeholders stay informed with the latest market news, regulatory updates, and technological progress, facilitating informed strategic decision-making and forecasting.
Polylactic Acid (PLA) Industry Analysis
The global polylactic acid (PLA) industry size reached USD 12,98.0 Million in 2025. By 2034, IMARC Group expects the market to reach USD 4,155.4 Million, at a projected CAGR of 13.39% during 2026-2034. Growth is driven by rising demand for biodegradable plastics, regulatory support for sustainable packaging solutions, increasing consumer preference for bio based alternatives, and expanding applications in textiles, agriculture, and medical devices.
Latest developments in the Polylactic Acid (PLA) Industry:
- March 2025: NatureWorks introduced Ingeo™ Extend 4950D, a new PLA polymer grade enabling biaxial oriented PLA (BOPLA) film manufacturers to achieve up to 7× transverse direction stretch on equipment originally meant for polymers like polypropylene. The product is designed to lower production costs, improve efficiency, and offer faster biodegradability while meeting performance needs for packaging like coffee capsules, candy wrappers, sachets, and condiment packaging.
- December 2024: Emirates Biotech entered into an alliance with Sulzer to establish the globe's biggest PLA manufacturing facility in the UAE. The facility, which will be developed in two stages, is anticipated to achieve an annual production capacity of 160,000 tonnes on completion, with every stage capable of producing 80,000 tonnes every year. The construction is scheduled to start in 2025, with operations expected to start by early 2028.
- January 2024: PsiQuantum, Mitsubishi UFJ Financial Group, and Mitsubishi Chemical entered a partnership to design energy-efficient materials using PsiQuantum’s fault-tolerant quantum computer, with a focus on computational studies in chemistry and materials. The aim is to accelerate innovation in materials research, including in areas such as PLA and other bio-based materials.
- March 2023: TotalEnergies Corbion, POSCO International, and ESOL signed an alliance to develop PLA recycling capabilities and technology in South Korea. The alliance is also forecasted to serve South Korea's national Carbon Neutrality policy.
- April 2023: NatureWorks LLC and Jabil Inc. have launched a cutting-edge powder created using Ingeo PLA for the selective laser sintering (SLS) 3D printing platforms. This affordable solution has a reduced sintering temperature and has a carbon footprint that is 89% less than the traditional PA-12 material.
Product Description
Polylactic Acid (PLA) is a biodegradable thermoplastic polymer derived from renewable feedstocks such as corn starch, sugarcane, and cassava. It is produced through the polymerization of lactic acid or lactide, offering a sustainable alternative to conventional petroleum-based plastics. PLA exhibits high strength, transparency, and processability, making it suitable for extrusion, injection molding, and 3D printing. It is widely used in packaging, disposable cutlery, films, textiles, and agricultural applications. In the medical sector, PLA is applied in sutures, implants, and drug delivery systems due to its biocompatibility and controlled biodegradability. As global industries shift toward eco-friendly materials, PLA’s recyclability and compostability reinforce its importance in sustainable manufacturing practices.
Report Coverage
| Key Attributes | Details |
|---|---|
| Product Name | Polylactic Acid |
| Report Features | Exploration of Historical Trends and Market Outlook, Industry Demand, Industry Supply, Gap Analysis, Challenges, Polylactic Acid Price Analysis, and Segment-Wise Assessment. |
| Currency/Units | US$ (Data can also be provided in local currency) or Metric Tons |
| Region/Countries Covered | The current coverage includes analysis at the global and regional levels only. Based on your requirements, we can also customize the report and provide specific information for the following countries: Asia Pacific: China, India, Indonesia, Pakistan, Bangladesh, Japan, Philippines, Vietnam, Thailand, South Korea, Malaysia, Nepal, Taiwan, Sri Lanka, Hongkong, Singapore, Australia, and New Zealand Europe: Germany, France, United Kingdom, Italy, Spain, Russia, Turkey, Netherlands, Poland, Sweden, Belgium, Austria, Ireland, Switzerland, Norway, Denmark, Romania, Finland, Czech Republic, Portugal and Greece North America: United States and Canada Latin America: Brazil, Mexico, Argentina, Columbia, Chile, Ecuador, and Peru Middle East & Africa: Saudi Arabia, UAE, Israel, Iran, South Africa, Nigeria, Oman, Kuwait, Qatar, Iraq, Egypt, Algeria, and Morocco The list of countries presented is not exhaustive. Information on additional countries can be provided if required by the client. |
| Information Covered for Key Suppliers |
|
| Customization Scope | The report can be customized as per the requirements of the customer |
| Report Price and Purchase Option |
Plan A: Monthly Updates - Annual Subscription
Plan B: Quarterly Updates - Annual Subscription
Plan C: Biannually Updates - Annual Subscription
|
| Post-Sale Analyst Support | 360-degree analyst support after report delivery |
| Delivery Format | PDF and Excel through email (We can also provide the editable version of the report in PPT/Word format on special request) |
Key Benefits for Stakeholders:
- IMARC’s report presents a detailed analysis of polylactic acid pricing, covering global and regional trends, spot prices at key ports, and a breakdown of FOB and CIF prices.
- The study examines factors affecting polylactic acid price trend, including input costs, supply-demand shifts, and geopolitical impacts, offering insights for informed decision-making.
- The competitive landscape review equips stakeholders with crucial insights into the latest market news, regulatory changes, and technological advancements, ensuring a well-rounded, strategic overview for forecasting and planning.
- IMARC offers various subscription options, including monthly, quarterly, and biannual updates, allowing clients to stay informed with the latest market trends, ongoing developments, and comprehensive market insights. The polylactic acid price charts ensure our clients remain at the forefront of the industry.
Frequently Asked Questions About the Polylactic Acid Price Trend Report
The polylactic acid (PLA) prices in July 2026 were 2.39 USD/Kg in Northeast Asia, 2.74 USD/Kg in Europe, 2.32 USD/Kg in Southeast Asia, and 2.36 USD/Kg in North America.
The polylactic acid (PLA) pricing data is updated on a monthly basis.
We provide the pricing data primarily in the form of an Excel sheet and a PDF.
Yes, our report includes a forecast for polylactic acid (PLA) prices.
The regions covered include North America, Europe, Asia Pacific, Middle East, and Latin America. Countries can be customized based on the request (additional charges may be applicable).
Yes, we provide both FOB and CIF prices in our report.
Need more help?
- Speak to our experienced analysts for insights on the current market scenarios.
- Include additional segments and countries to customize the report as per your requirement.
- Gain an unparalleled competitive advantage in your domain by understanding how to utilize the report and positively impacting your operations and revenue.
- For further assistance, please connect with our analysts.
 Request Customization
 Inquire Before Buying
 Speak to an Analyst
 Request Brochure
Benefits of Customization
- Personalize this research
- Triangulate with your data
- Get data as per your format and definition
- Gain a deeper dive into a specific application, geography, customer, or competitor
- Any level of personalization
Get in Touch With Us
UNITED STATES
Phone: +1-201-971-6302
INDIA
Phone: +91-120-433-0800
UNITED KINGDOM
Phone: +44-753-714-6104
Email: [email protected]
Client Testimonials


.webp)


Related Reports
Why Choose Us
IMARC offers trustworthy, data-centric insights into commodity pricing and evolving market trends, enabling businesses to make well-informed decisions in areas such as procurement, strategic planning, and investments. With in-depth knowledge spanning more than 1000 commodities and a vast global presence in over 150 countries, we provide tailored, actionable intelligence designed to meet the specific needs of diverse industries and markets.
1000
+Commodities
150
+Countries Covered
3000
+Clients
20
+Industry
Robust Methodologies & Extensive Resources
IMARC delivers precise commodity pricing insights using proven methodologies and a wealth of data to support strategic decision-making.
Subscription-Based Databases
Our extensive databases provide detailed commodity pricing, import-export trade statistics, and shipment-level tracking for comprehensive market analysis.
Primary Research-Driven Insights
Through direct supplier surveys and expert interviews, we gather real-time market data to enhance pricing accuracy and trend forecasting.
Extensive Secondary Research
We analyze industry reports, trade publications, and market studies to offer tailored intelligence and actionable commodity market insights.
Trusted by 3000+ industry leaders worldwide to drive data-backed decisions. From global manufacturers to government agencies, our clients rely on us for accurate pricing, deep market intelligence, and forward-looking insights.