
Power Inverter Market Size, Share, Trends and Forecast by Type, Application, End Use Sector, and Region, 2026-2034
Global Power Inverter Market Size, Share, Trends & Forecast (2026-2034)
The global power inverter market size was valued at USD 87.4 Billion in 2025 and is projected to reach USD 126.8 Billion by 2026-2034, exhibiting a CAGR of 4.1% during the forecast period 2026-2034. Accelerating deployment of renewable energy infrastructure, rapid electrification of transport, expanding industrial automation, and growing grid reliability requirements are the primary drivers for power inverter market growth. The 100KW–495KW type segment leads with a 35.6% revenue share in 2025, driven by heavy industrial motor drives and utility-scale renewable energy installations. Motor Drives dominate the application landscape at 39.9% in 2025. Asia Pacific commands 42.5% of global revenues in 2025, underpinned by China’s massive manufacturing base and aggressive solar and wind capacity additions.
Market Snapshot
|
Metric |
Value |
|
Market Size 2025 |
USD 87.4 Billion |
|
Forecast Market Size 2034 |
USD 126.8 Billion |
|
CAGR 2026-2034 |
4.1% |
|
Base Year |
2025 |
|
Historical Period |
2020-2025 |
|
Forecast Period |
2026-2034 |
|
Largest Region |
Asia Pacific (42.5% share, 2025) |
|
Fastest Growing Region |
Asia Pacific (CAGR ~5.2%) |
|
Largest Type Segment |
100KW–495KW (35.6%, 2025) |
|
Leading Application |
Motor Drives (39.9%, 2025) |
The global power inverter market growth trajectory from 2020 through 2034, contrasting a consistent historical expansion base against a sustained forecast curve powered by renewable energy adoption, EV proliferation, industrial automation investment, and expanding grid-scale storage deployments.
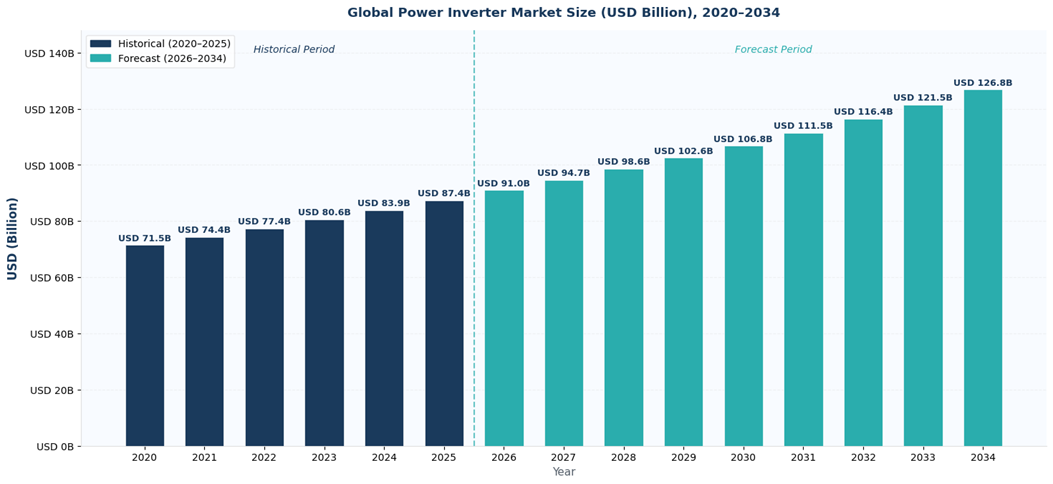
Figure 1: Global Power Inverter Market Growth Trend (2020–2034)
Application-level CAGR comparisons highlighting EVs/HEVs and Solar PVs as the two fastest-growing sub-categories within the global power inverter industry analysis through 2034, with both segments growing well above the 4.1% overall market CAGR.
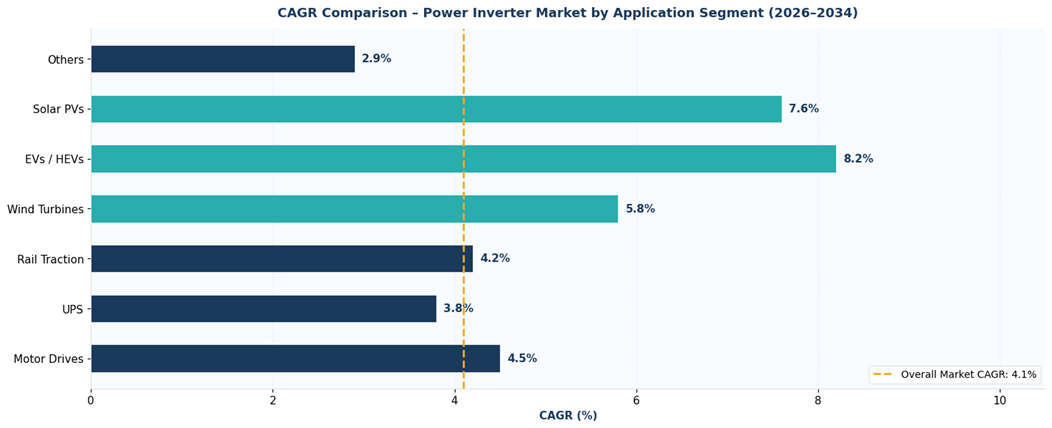
Figure 2: CAGR Comparison – Power Inverter Market by Application Segment (2026–2034)
Executive Summary
The global power inverter market is undergoing a structural expansion phase fueled by the concurrent megatrends of renewable energy integration, transport electrification, and industrial digitization. Valued at USD 87.4 Billion in 2025, the market is on a steady trajectory to reach USD 126.8 Billion by 2034 at a CAGR of 4.1%.
The 100KW–495KW type segment commands the largest share at 35.6% in 2025 due to industrial motor drive applications, grid-tied solar farms, and medium-scale wind turbine systems. The Motor Drives application segment leads at 39.9% in 2025, reflecting widespread industrial automation upgrades across manufacturing, mining, and process industries globally. EVs/HEVs and Solar PVs represent the fastest-expanding application sub-segments, with estimated CAGRs of 8.2% and 7.6%, respectively, over the forecast period.
Asia Pacific holds the dominant regional position at 42.5% in 2025, driven by China’s world-leading manufacturing base, aggressive renewable energy targets, and surging EV adoption. Europe at 22.6% and North America at 18.4% follow, supported by stringent energy efficiency mandates and grid modernization programs..
Key Market Insights
|
Insight |
Data |
|
Largest Type Segment |
100KW–495KW – 35.6% share (2025) |
|
Leading Application |
Motor Drives – 39.9% share (2025) |
|
Leading Region |
Asia Pacific – 42.5% revenue share (2025) |
|
Second Region |
Europe – 22.6% revenue share (2025) |
|
Top Companies |
ABB, Siemens, Eaton, Schneider Electric, Mitsubishi Electric |
Key analytical observations supporting the above data:
100KW–495KW Segment: The segment’s 35.6% dominance in 2025reflects deep penetration in utility-scale solar farms, industrial motor drive systems, and grid-connected wind turbine installations where medium-power inverters are the standard specification.
Motor Drives Dominance: Motor Drives command 39.9% of total application revenue in 2025, driven by the global industrial automation wave.
EVs/HEVs Fastest Growth: EVs/HEVs represent the fastest-growing application at an estimated CAGR of 8.2% through 2034.
Global Power Inverter Market Overview
Power inverters are electronic devices that convert DC to AC at defined voltages and frequencies, enabling DC sources—such as solar panels, batteries, fuel cells, and EV powertrains—to connect with AC networks. They are essential interfaces in energy generation, storage, and consumption across utility, industrial, commercial, and residential sectors.
The inverter market ranges from sub-5 kW residential microinverters to multi-megawatt modular systems for utility-scale renewables and HVDC transmission. Key applications include motor drives, UPS, rail traction, wind turbines, EVs, and solar PV. Growth is driven by global net-zero targets, industrial automation, EV infrastructure, and grid modernization initiatives worldwide.
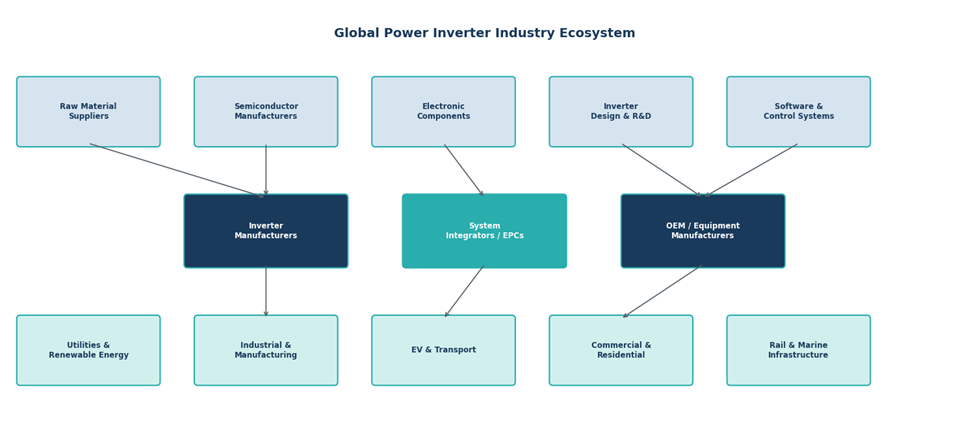
Figure 3: Global Power Inverter Industry Ecosystem Map
Market Dynamics
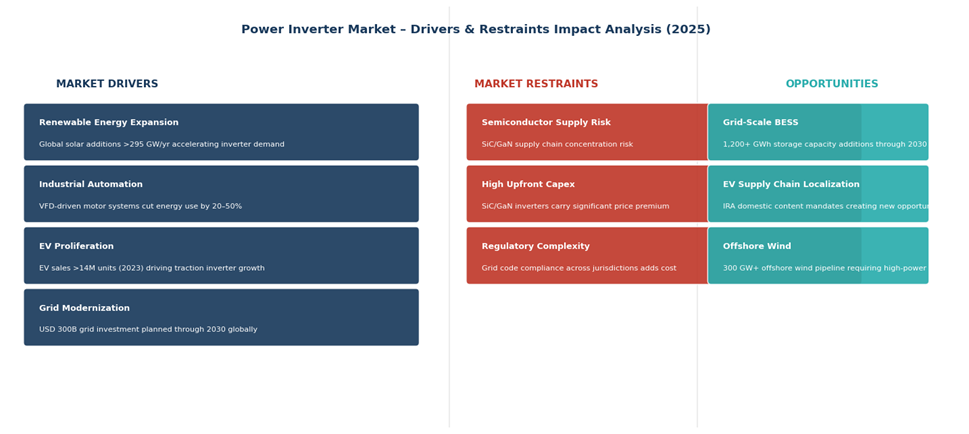
Figure 4: Power Inverter Market – Drivers & Restraints Impact Analysis (2025)
Market Drivers
- Renewable Energy Capacity Expansion: Global solar photovoltaic (PV) additions have surged in recent years, with about 295 GW of new solar capacity installed in 2022 according to IRENA data. Solar deployment continued strongly in 2023–24, with annual additions exceeding 600 GW and driving cumulative capacity past 2.2 TW by the end of 2024. Solar and wind together accounted for the vast majority of new renewable capacity growth in 2024, with renewables dominating overall power capacity expansion and forecasts showing they will continue to represent nearly all new additions through 2025.
- Industrial Automation and Motor Drive Demand: Manufacturing industries globally are deploying variable frequency drives (VFDs) and motor control centers powered by inverters to achieve energy savings of 20–50% in pump, fan, and compressor applications. The global industrial robot stock exceeded 4.28 million units in 2023 (IFR), each dependent on precision inverter-driven servo systems.
- Electric Vehicle Proliferation: EV sales topped 14 million units globally in 2023 and are forecast to reach 45 million+ by 2030. Each EV requires on-board traction inverters with efficiency levels above 97%, creating a high-value inverter demand stream that is growing exponentially.
- Grid Modernization and Energy Storage: Over USD 300 Billion in grid infrastructure investment is planned across North America, Europe, and the Asia Pacific through 2030. Battery Energy Storage Systems (BESS), which require bidirectional power inverters for grid interaction, are scaling rapidly, with global installed capacity projected to reach 1,500 GWh by 2030.
Market Restraints
- Semiconductor Supply Chain Vulnerability: Power inverters rely on advanced semiconductor components such as IGBTs, SiC MOSFETs, and gate drivers, which remain subject to supply chain constraints and geopolitical concentration risks in advanced chip manufacturing.
- High Capital Cost of Advanced Inverter Systems: Silicon carbide (SiC) and gallium nitride (GaN)-based inverters deliver superior efficiency and power density but command significant price premiums over conventional IGBT-based systems, limiting adoption in price-sensitive emerging market applications.
Market Opportunities
- Offshore Wind and Grid-Scale Storage: As of 2025, installed offshore wind capacity is ~80 GW, with the broader project pipeline exceeding 300 GW across all development stages. Each project requires high‑power inverters for grid integration. Co‑located Battery Energy Storage Systems (BESS) add an extra layer of inverter demand by providing bidirectional power conversion.
- Microinverter and MLPE Market Expansion: Module-level power electronics (MLPE), including microinverters, are driving panel-level MPPT, monitoring, and flexibility, boosting the <5 kW inverter market across Europe, the US, and the Asia Pacific.
Market Challenges
- Thermal Management and Reliability: Power inverters deployed in tropical, desert, and offshore environments face accelerated degradation from heat, humidity, and salt spray, requiring sophisticated thermal management design and increasing warranty cost exposure.
- Cybersecurity Risks in Grid-Connected Inverters: Modern smart inverters with internet connectivity for remote monitoring, OTA updates, and grid services present expanding cybersecurity attack surfaces, with the EU and US implementing mandatory security standards for grid-connected inverter systems.
Emerging Market Trends
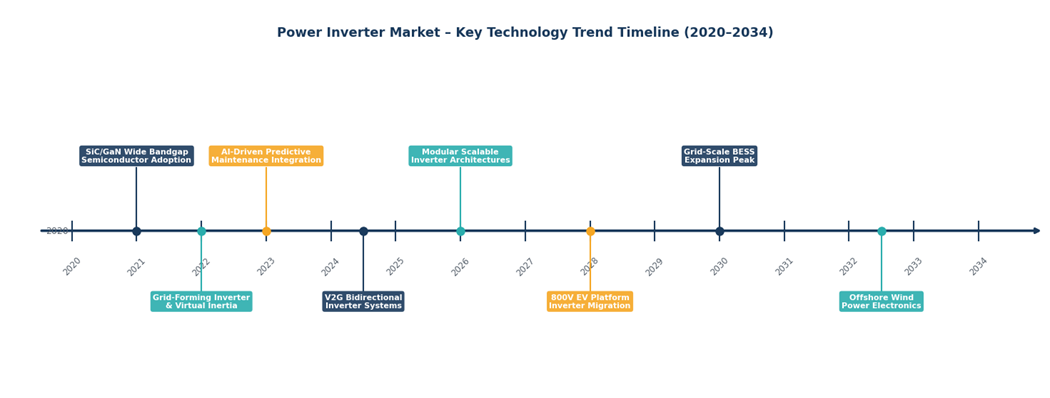
Figure 5: Power Inverter Market – Key Trend Timeline (2020–2034)
1. SiC and GaN Wide Bandgap Semiconductor Adoption
SiC and GaN devices are replacing IGBTs in high-performance inverters. SiC MOSFETs allow 100 kHz+ switching, cut magnetic size by ~70%, and boost efficiency above 99% in EVs and solar. Key players like Wolfspeed, STMicroelectronics, and Infineon are rapidly expanding SiC wafer capacity.
2. Grid-Forming Inverter Technology and Virtual Inertia
Unlike traditional grid-following inverters, grid-forming inverters set their own AC voltage reference, supporting stable operation in high-renewable grids and commanding premium pricing from utilities.
3. Bidirectional Vehicle-to-Grid (V2G) Integration
Electric vehicles equipped with bidirectional on-board chargers can function as distributed energy resources, supplying power back to the grid during peak demand. V2G programs are scaling in Japan, the Netherlands, and California, creating a new class of bidirectional traction inverter demand.
4. AI-Driven Predictive Maintenance and Digital Twin Integration
Industrial inverter operators are increasingly deploying AI-based condition monitoring that analyses thermal signatures, vibration data, and harmonic distortion to predict failures before they occur. Digital twin models enable real-time performance optimization, reducing unplanned downtime by up to 40% in industrial motor drive applications.
5. Modular and Scalable Inverter Architectures
Utility-scale solar and storage increasingly use parallel modular inverters instead of large central units, improving redundancy, enabling incremental expansion, and lowering LCOE, driving demand for containerized modular string inverters.
Industry Value Chain Analysis
The power inverter value chain spans six integrated stages from semiconductor raw material supply through end-user deployment and lifecycle service. Each stage presents distinct competitive dynamics, technology investment requirements, and margin profiles that collectively determine industry profitability.
|
Stage |
Key Players / Examples |
|
Raw Materials & Semiconductors |
Silicon carbide wafers, copper, aluminum, IGBT/SiC/GaN devices – Wolfspeed, Infineon Technologies, STMicroelectronics, ON Semiconductor, Rohm Semiconductor |
|
Electronic Components |
Capacitors, inductors, transformers, PCBs, gate drivers, DSP controllers – Vishay, Murata, TDK, Texas Instruments, Microchip Technology |
|
Inverter Design & Manufacturing |
ABB Ltd., Siemens AG, Eaton Corporation, Schneider Electric, Mitsubishi Electric, SMA Solar Technology, Sungrow Power Supply, Huawei Digital Power |
|
System Integration |
EPC contractors, OEM integrators, solar/wind project developers – NextEra Energy, Ørsted, BYD Energy Storage, Fluence Energy |
|
Distribution & Service |
Electrical distributors, authorized service networks, remote monitoring platforms – Rexel, Sonepar, Grainger, direct OEM service networks |
|
End Users |
Utilities, industrial manufacturers, EV OEMs, commercial & residential building owners, rail operators, mining companies |
Raw materials and semiconductors, especially SiC wafers, are highly concentrated, creating supply risks. Inverter manufacturing is moderately consolidated, while system integration and EPC services remain regionally fragmented.
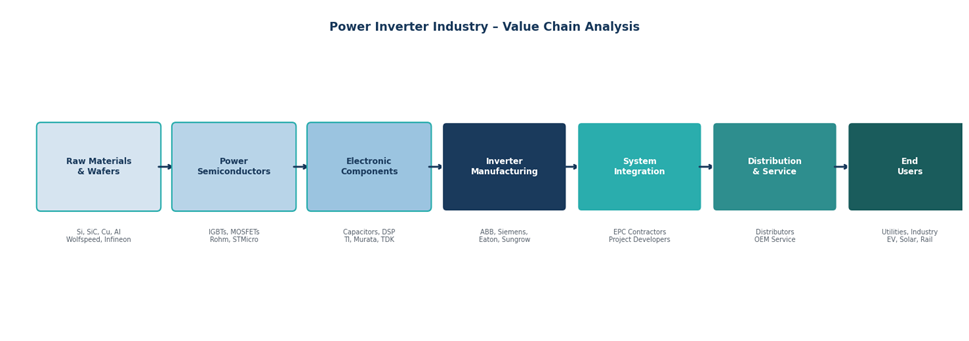
Figure 6: Power Inverter Industry Value Chain
Technology Landscape in the Power Inverter Industry
Wide Bandgap Power Devices: SiC and GaN
Silicon carbide (SiC) and gallium nitride (GaN) are the defining technology transition in power inverter design. SiC MOSFETs achieve blocking voltages of 600V–10kV with on-state resistance one-tenth that of silicon equivalents, enabling inverter power density improvements of 5x and efficiency levels above 99%.
Digital Control and Embedded Intelligence
Modern inverters use 32-bit DSP and ARM Cortex controllers for advanced modulation and MPPT, with IIoT connectivity for remote monitoring and updates. AI-enabled edge computing adds predictive fault detection and autonomous grid support.
Bidirectional and Energy Storage Integration
Battery storage drives demand for bidirectional inverters handling DC‑AC and AC‑DC in a single stage. V2G and grid-scale BESS use advanced multilevel topologies (NPC, T-type) for high-voltage, low-harmonic conversion.
Market Segmentation Analysis
By Type
The 100KW–495KW category is the single largest segment in 2025, capturing 35.6% of global revenues, reflecting the scale requirements of industrial motor drive systems and commercial renewable energy installations. The <5KW segment at 18.4% is growing fastest in unit volume, driven by exponential growth in residential solar microinverter deployments across Europe, the US, and the Asia Pacific.
The above 500 kW segment at 21.4% in 2025 remains a high-value category driven by utility-scale solar farm central inverters and large industrial drives. As modular inverter architectures gain traction, procurement within the >500KW power class is increasingly met through parallel arrays of string inverters rather than single large central units.
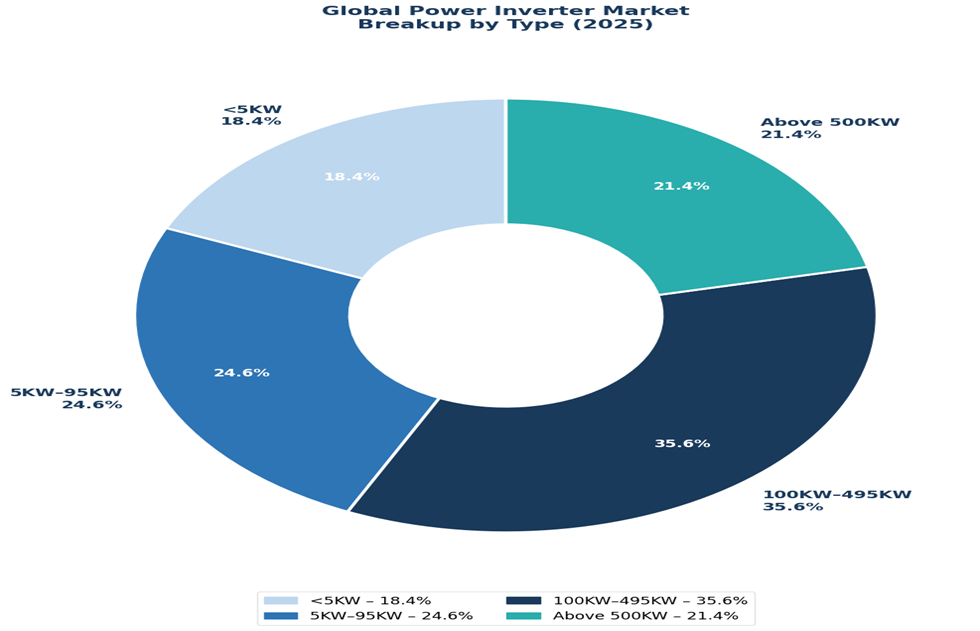
Figure 7: Global Power Inverter Market Share by Type (2025)
By Application
Motor drives dominate the application landscape at 39.9% in 2025. The global industrial automation expansion, accelerating energy efficiency mandates, and the replacement of fixed-speed motor systems with VFD-controlled systems continue to propel this segment. EVs/HEVs and Solar PVs are the two fastest-growing applications over the 2026–2034 forecast horizon.
The EVs/HEVs application segment, at 10.8% in 2025 and growing at approximately 8.2% CAGR, represents the most structurally transformative demand driver for the power inverter market over the forecast period. As EV platforms scale, traction inverter specifications are simultaneously advancing from 100–150kW in 2020-era designs to 250–400kW in performance EV platforms, and the shift to 800V architectures is creating entirely new inverter product categories.
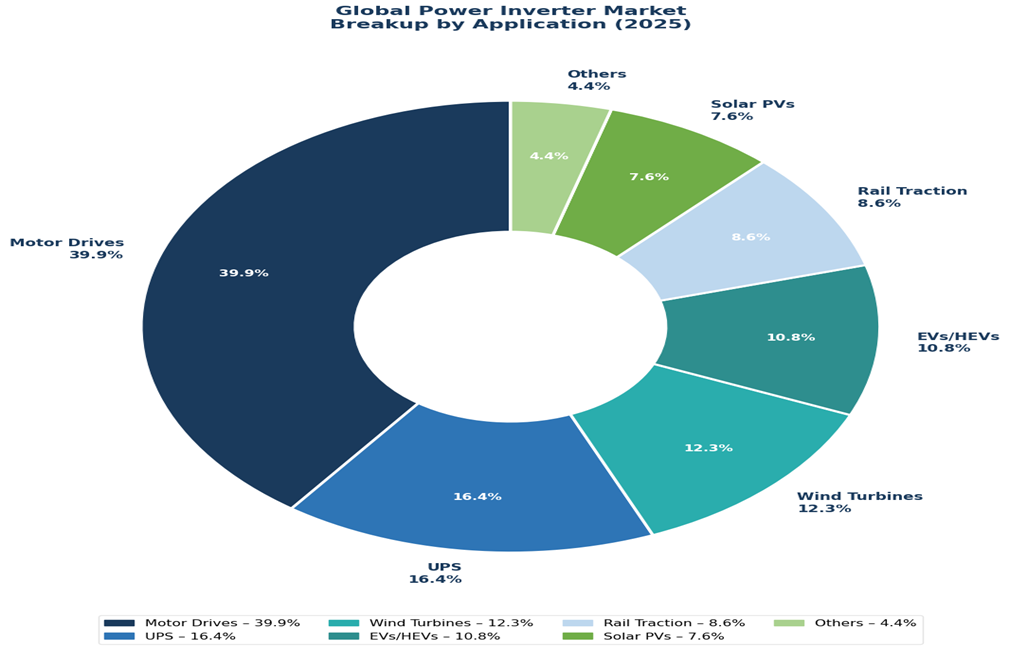
Figure 8: Global Power Inverter Market Share by Application (2025)
Regional Market Insights
|
Region |
Share (2025) |
Key Growth Drivers |
|
Asia Pacific |
42.5% |
China solar & wind expansion, India PLI schemes, Japan green transformation, Southeast Asia industrial electrification |
|
Europe |
22.6% |
EU REPowerEU 45% renewables target by 2030, mandatory energy efficiency standards, EV transition mandates, offshore wind buildout |
|
North America |
18.4% |
U.S. Inflation Reduction Act (IRA) USD 369B clean energy incentives, clean electricity regulations, grid modernization investment |
|
Latin America |
9.2% |
Brazil distributed solar >25 GW installed (2023), Chile Atacama utility-scale solar, and Mexico industrial manufacturing base. |
|
Middle East & Africa |
7.3% |
Saudi Vision 2030 renewable targets, UAE Mohammed bin Rashid Solar Park (5 GW), South Africa REIPPP program |
Asia Pacific commands a 42.5% global revenue share in 2025, the most dominant regional position in the global power inverter market. China is the single most important national market, combining the world’s largest industrial economy with the most aggressive renewable energy deployment program globally. China added 217 GW of new solar PV capacity and 76 GW of wind power in 2023 alone, requiring substantial inverter procurement pipelines.
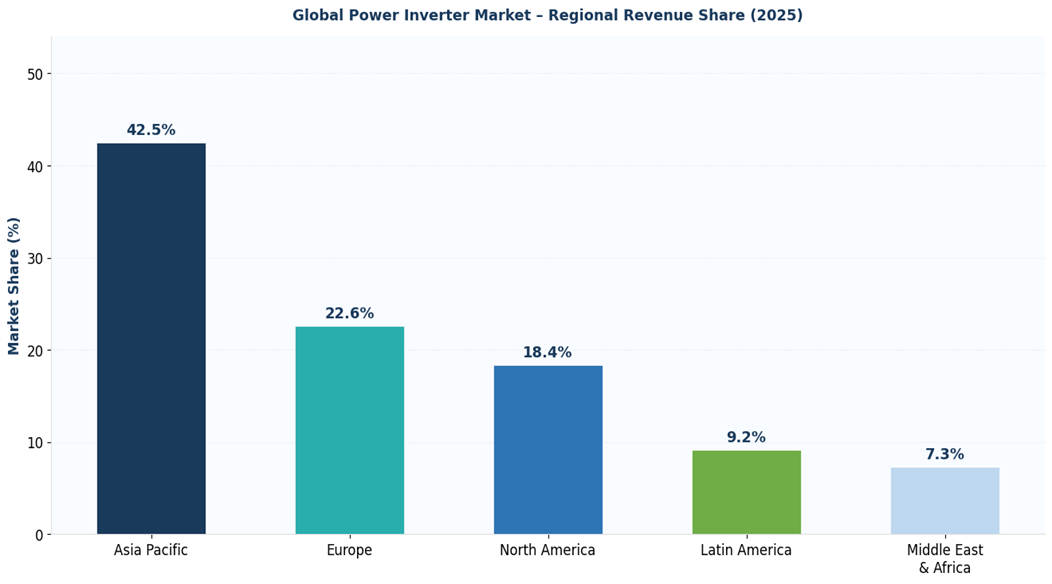
Figure 9: Power Inverter Market – Regional Revenue Share Distribution (2025)
Europe’s 22.6% share reflects the region’s dual identity as a major renewable energy deployer and a premium industrial economy with deep penetration of high-efficiency VFD motor drive systems. Germany, Spain, and the Netherlands are the leading national markets, each with ambitious renewable capacity expansion programs. North America, at 18.4%, is positioned for above-average growth through the forecast period, driven by the IRA investment pipeline, which is reshaping the economics of domestic clean energy manufacturing and deployment.
Competitive Landscape
|
Company Name |
Key Platform / Brand |
Market Position |
Core Strength |
|
ABB Ltd. |
ABB Ability / ACS Series |
Leader |
Global leader in industrial drives; strong in motor VFDs and BESS converters |
|
Siemens AG |
SINAMICS / SINVERT |
Leader |
Dominant in industrial automation inverters; strong in rail traction and wind |
|
Eaton Corporation |
Power Xpert / 9395 |
Leader |
Leading UPS inverter manufacturer; strong North American data centre presence |
|
Schneider Electric |
Conext / Galaxy Series |
Leader |
Strong in commercial solar, UPS, and microgrid inverter systems globally |
|
Mitsubishi Electric |
FREQROL / FR Series |
Challenger |
Market leader in Japan/Southeast Asia for motor drives and rail traction |
|
SMA Solar Technology |
Sunny Tripower / Sunny Boy |
Challenger |
European solar inverter specialist; strong in residential and commercial string inverters |
|
Sungrow Power Supply |
Sungrow String/Central |
Challenger |
China’s leading solar inverter manufacturer, with fast-growing global shipment volumes |
|
Huawei Digital Power |
FusionSolar Smart Inverter |
Challenger |
AI-integrated MPPT and digital twin monitoring; a significant smart inverter challenger |
|
Yaskawa Electric |
Varispeed / GA700 |
Emerging |
Strong in Japanese/Asian industrial motor drives; advancing servo drive for robotics |
|
Toshiba Corporation |
TOSVERT VF Series |
Emerging |
Established in rail traction and medium industrial inverters across the Asia Pacific |
The global power inverter market is moderately consolidated, led by ABB, Siemens, Eaton, and Schneider Electric. In solar inverters, Chinese firms Sungrow and Huawei compete strongly with European players, with differentiation now driven by software features like predictive maintenance, remote monitoring, grid services, and energy management integration.
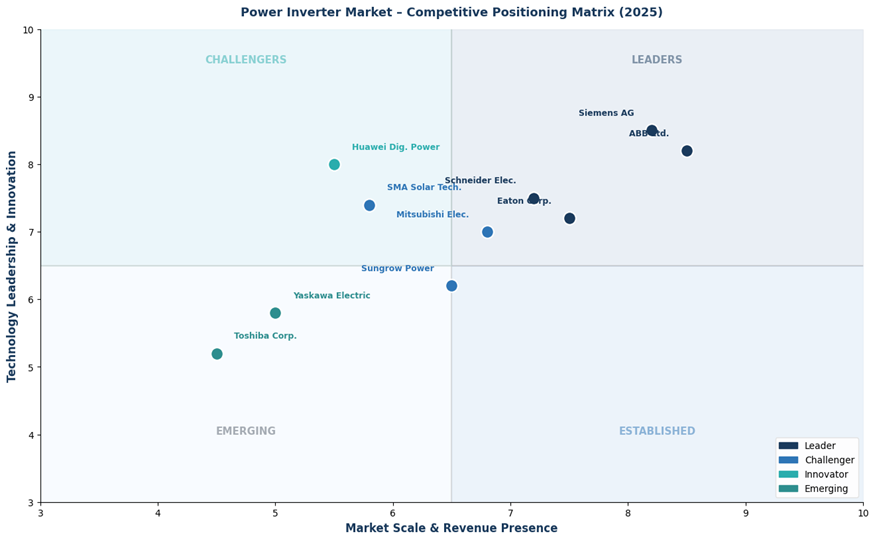
Figure 10: Power Inverter Market – Competitive Positioning Matrix (2025)
Key Company Profiles
ABB Ltd.
ABB is a Swiss multinational engineering corporation headquartered in Zurich with a diversified portfolio spanning electrification, industrial automation, motion systems, and robotics. ABB’s Motion division is one of the world’s largest VFD manufacturers, generating approximately USD 4+ Billion annually. The ACS880 and ACS580 series industrial drives are deployed across pumps, fans, compressors, conveyors, and cranes in over 100 countries.
- Product Portfolio: ACS880 all-compatible drives, ACS580 general-purpose drives, PCS100 utility inverters, REACT2 energy storage inverters, HVDC Light transmission converters.
- Recent Developments: In November 2025, ABB announced the launch of ACS880 Virtual DrivePlus, a high-fidelity Software-in-the-Loop (SIL) solution that runs the actual low-voltage drive control firmware to ensure accurate simulation of the drive’s behavior.
- Strategic Focus: ABB’s strategy centers on SiC-enabled next-generation drives, digital predictive maintenance through ABB Ability™ smart sensors, and grid-scale power electronics for HVDC and BESS applications. The company is targeting the data centre and renewable energy storage markets as primary growth vectors.
Siemens AG
Siemens is a German multinational conglomerate with Siemens Energy and Siemens Digital Industries as the primary divisions, housing power electronics operations. SINAMICS frequency converters are the flagship industrial drive product line, serving automotive manufacturing, chemicals, metals, and infrastructure applications globally.
- Product Portfolio: SINAMICS G120 general-purpose drives, SINAMICS S120 servo drives, SINVERT solar inverters, SIMOVERT traction converters, HVDC PLUS transmission systems.
- Recent Developments: In 2022, Siemens announced the SINAMICS G120X with integrated cybersecurity features and IIoT connectivity for Industry 4.0 integration, targeting the process automation and renewable energy control markets.
- Strategic Focus: Siemens is investing heavily in next-generation wind turbine converter technology through Siemens Gamesa Renewable Energy, while expanding its digital twin and cloud monitoring capabilities across the industrial drive product range.
Eaton Corporation
Eaton is a U.S.-based power management company whose Electrical Sector generates over USD 12 Billion in annual revenues from UPS systems, PDUs, switchgear, and power inverters for data centres, healthcare, telecommunications, and critical power applications.
- Product Portfolio: 9395 UPS, 9PX UPS, 9SX rack UPS, Power Xpert 9395P modular UPS, Eaton EV Charging infrastructure, xStorage Battery Energy Storage.
- Recent Developments: Eaton launched its 1MW+ modular UPS system targeting hyperscale data centre operators in 2025, incorporating lithium-ion battery integration and AI-driven predictive maintenance through the Brightlayer digital platform.
- Strategic Focus: Eaton is expanding into EV charging infrastructure through its xStorage Home and commercial charging product lines, while deepening its hyperscale data centre UPS relationships through software-defined power management capabilities.
Market Concentration Analysis
The global power inverter market exhibits a bimodal concentration structure. The industrial motor drives sub-market, representing the largest single application at 39.9% of total revenues, is highly concentrated among ABB, Siemens, Yaskawa, Mitsubishi Electric, and Danfoss, with the top five players estimated to represent 55–65% of this sub-market’s revenues in 2025.
The solar inverter market is fragmented, with Sungrow and Huawei leading in Asia and emerging markets, while SMA Solar and Schneider Electric dominate Europe and North America. The UPS inverter market is moderately consolidated among Eaton, Schneider Electric, Vertiv, Legrand, and Socomec, with further consolidation expected by 2030 as SiC and digital platform investments raise R&D barriers and spur M&A activity.
Investment & Growth Opportunities
Fastest-Growing Segments
EVs/HEVs represent the highest-growth application segment at approximately 8.2% CAGR through 2034. As EV platforms scale to 800V architectures and peak power ratings advance to 250–400kW, the traction inverter product category is being entirely reinvented around SiC power devices
Emerging Market Expansion
Grid-scale Battery Energy Storage Systems represent the highest-potential new demand vector, with BloombergNEF projecting 1,200+ GWh of new BESS capacity additions through 2030 globally. Each GWh of BESS capacity requires bidirectional power conversion systems valued at USD 20–40 Million per project. The global offshore wind pipeline, exceeding 300 GW in active development phases, also represents a concentrated high-value inverter demand opportunity with lower competitive intensity than onshore renewable markets.
Venture & Private Investment Trends
North American and European EV OEMs are shifting traction inverter sourcing from Asia due to IRA domestic content rules, opening greenfield opportunities for SiC-based inverter production. Venture capital is flowing into inverter software and energy management startups offering digital twin and predictive maintenance solutions. Meanwhile, industrial retrofits of legacy motor systems, driven by EU Ecodesign and US EPACT efficiency mandates, represent a multi-billion-dollar annual market.
Future Market Outlook (2026-2034)
The global power inverter market forecast projects steady value expansion from USD 87.4 Billion in 2025 to USD 126.8 Billion by 2034 at a CAGR of 4.1%. This growth trajectory reflects the market’s embedded position within multiple structural megatrends: decarbonization, electrification, and digitization, which are simultaneously expanding the total addressable market across all major application verticals.
Wide bandgap SiC inverters are set to rise from 8–10% of shipments in 2024 to 35–40% by 2030, boosting efficiency, reducing size/weight, and widening temperature ranges, while pressuring IGBT products. Grid-forming inverters will become standard in developed markets by 2028–2030. Asia Pacific will remain dominant through 2034, North America will grow rapidly via the IRA pipeline, and the Middle East & Africa, at 7.3% in 2025, will see the fastest percentage growth driven by major renewable projects.
Research Methodology
Primary Research
Primary research encompassed over 60 structured interviews conducted in 2024–2025 with power inverter industry stakeholders, including product directors at inverter OEMs, industrial automation system integrators, EPC project developers, utility grid operators, and EV powertrain engineering teams. Primary insights validated market sizing, segmentation estimates, technology adoption timelines, and competitive positioning assessments.
Secondary Research
Secondary sources include IRENA Renewable Power Generation Costs reports, IEA World Energy Investment reports, BloombergNEF Energy Storage Market Outlook, IFR World Robotics reports, company annual reports and investor presentations from ABB, Siemens, Eaton, Schneider Electric, Mitsubishi Electric, Sungrow, and SMA Solar Technology, regulatory publications from NERC, ENTSO-E, and CEA, and trade publications including Power Electronics News, PV Tech, and Windpower Monthly.
Forecasting Models
Market size estimations and growth projections were derived using a combination of top-down and bottom-up forecasting models. Bottom-up modeling, anchored in application-level demand modeling, unit shipment volumes by power class multiplied by average selling price per application, was reconciled against top-down revenue validation using company-disclosed segment revenues. Forecast modeling employed econometric regression on leading indicators, including renewable capacity additions, EV sales forecasts, and industrial CapEx indices, combined with expert judgment-adjusted scenario analysis.
Power Inverter Market Report Scope:
| Report Features | Details |
|---|---|
| Base Year of the Analysis | 2025 |
| Historical Period | 2020-2025 |
| Forecast Period | 2026-2034 |
| Units | Billion USD |
| Scope of the Report |
Exploration of Historical Trends and Market Outlook, Industry Catalysts and Challenges, Segment-Wise Historical and Future Market Assessment:
|
| Types Covered | <5KW, 5KW to 95KW, 100KW to 495KW, Above 500KW |
| Applications Covered | Motor Drives, Uninterruptible Power Supply (UPS), Rail Traction, Wind Turbines, Electric Vehicles/Hybrid Electric Vehicles (EVs/HEVs), Solar PVs, and Others |
| End-Use Sectors Covered | Utility, Residential, Commercial and Industrial |
| Region Covered | Asia Pacific, Europe, North America, Latin America, Middle East and Africa |
| Companies Covered | ABB Ltd., Siemens AG, Eaton Corporation, Schneider Electric, Mitsubishi Electric, SMA Solar Technology, Sungrow Power Supply, Huawei Digital Power, Yaskawa Electric, Toshiba Corporation, etc. |
| Customization Scope | 10% Free Customization |
| Post-Sale Analyst Support | 10-12 Weeks |
| Delivery Format | PDF and Excel through Email (We can also provide the editable version of the report in PPT/Word format on special request) |
Key Benefits for Stakeholders:
- IMARC’s report offers a comprehensive quantitative analysis of various market segments, historical and current market trends, market forecasts, and dynamics of the power inverter market from 2020-2034.
- The research study provides the latest information on the market drivers, challenges, and opportunities in the global power inverter market.
- The study maps the leading, as well as the fastest-growing, regional markets. It further enables stakeholders to identify the key country-level markets within each region.
- Porter's Five Forces analysis assists stakeholders in assessing the impact of new entrants, competitive rivalry, supplier power, buyer power, and the threat of substitution. It helps stakeholders to analyze the level of competition within the power inverter industry and its attractiveness.
- Competitive landscape allows stakeholders to understand their competitive environment and provides an insight into the current positions of key players in the market.
Key Questions Answered in This Report
The global power inverter market was valued at USD 87.4 Billion in 2025, driven by renewable energy expansion, industrial automation, and EV adoption globally.
The market is projected to reach USD 126.8 Billion by 2034, growing at a CAGR of 4.1% during 2026-2034, driven by renewable energy deployment, EV proliferation, and grid modernization.
The 100KW–495KW segment leads at 35.6% in 2025, driven by utility-scale solar farms, industrial motor drives, and medium-scale wind turbine installations requiring this power range.
Motor Drives is the largest application at 39.9% in 2025, reflecting widespread industrial VFD adoption for pumps, fans, compressors, and conveyors, achieving 20–50% energy savings.
EVs/HEVs are the fastest-growing application at approximately 8.2% CAGR through 2034, driven by global EV sales surpassing 14 million units in 2023 and growing rapidly.
Asia Pacific dominates with a 42.5% revenue share in 2025, led by China’s massive renewable energy build-out and industrial manufacturing base, followed by Europe at 22.6%.
Leading companies include ABB Ltd., Siemens AG, Eaton Corporation, Schneider Electric, Mitsubishi Electric, SMA Solar Technology, Sungrow Power Supply, Huawei Digital Power, Yaskawa Electric, and Toshiba Corporation.
SiC MOSFETs enable inverter efficiency above 99%, reduced system size by up to 70%, and higher switching frequencies, particularly in EV drivetrains and utility solar applications.
Key drivers include renewable energy capacity expansion exceeding 295 GW annually, EV proliferation, industrial automation investment, and USD 300B+ in grid modernization globally.
The global power inverter market is projected to reach USD 126.8 Billion by 2034, supported by energy transition megatrends, industrial electrification, and expanding EV and renewable infrastructure.
Need more help?
- Speak to our experienced analysts for insights on the current market scenarios.
- Include additional segments and countries to customize the report as per your requirement.
- Gain an unparalleled competitive advantage in your domain by understanding how to utilize the report and positively impacting your operations and revenue.
- For further assistance, please connect with our analysts.
 Request Customization
 Speak to an Analyst
 Request Brochure
 Inquire Before Buying
Benefits of Customization
- Personalize this research
- Triangulate with your data
- Get data as per your format and definition
- Gain a deeper dive into a specific application, geography, customer, or competitor
- Any level of personalization
Get in Touch With Us
UNITED STATES
Phone: +1-201-971-6302
INDIA
Phone: +91-120-433-0800
UNITED KINGDOM
Phone: +44-753-714-6104
Email: sales@imarcgroup.com
Client Testimonials


.webp)


