
Rugged Tablet Market Size, Share, Trends and Forecast by Type, Operating System, Distribution Channel, End Use Industry, and Region, 2026-2034
Rugged Tablet Market Size and Share:
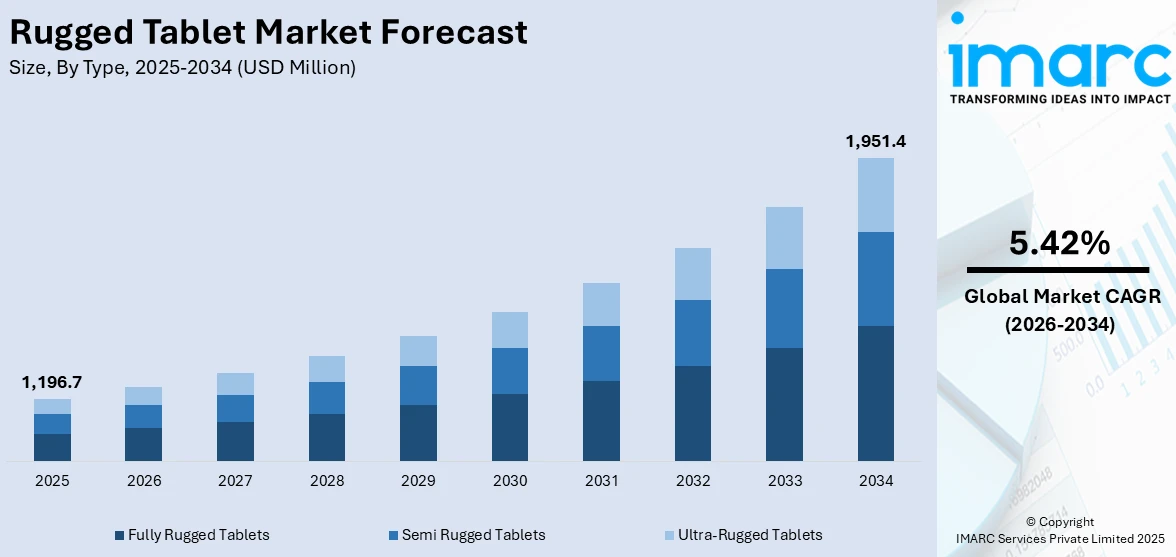
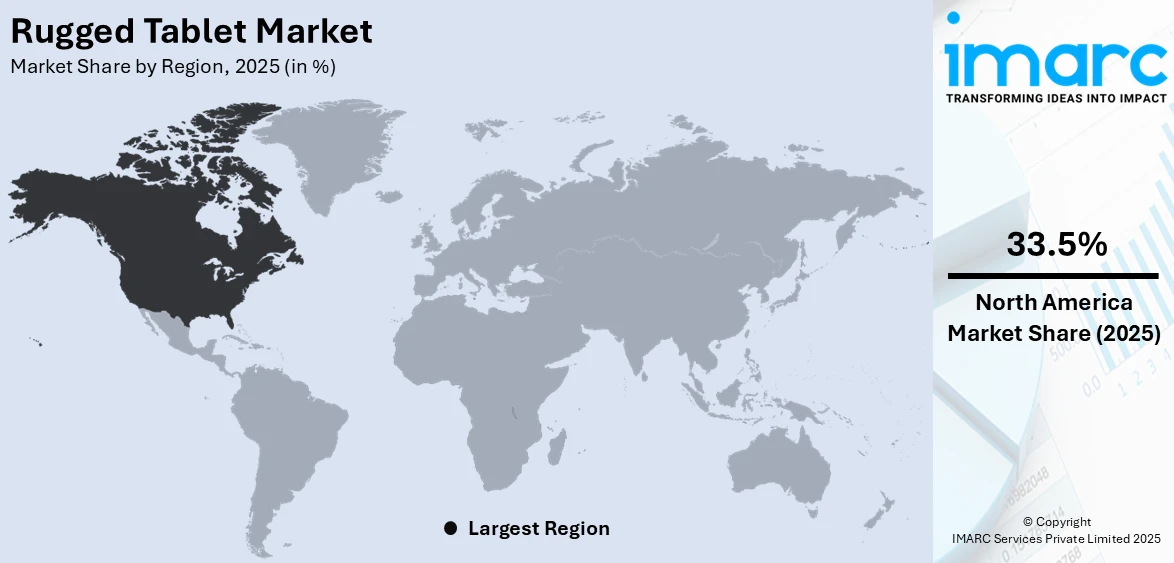
The global rugged tablet market size was valued at USD 1,196.7 Million in 2025. The market is projected to reach USD 1,951.4 Million by 2034, exhibiting a CAGR of 5.42% from 2026-2034. North America currently dominates the market, holding a market share of 33.5% in 2025. At present, increasing occurrences of international conflicts and terrorist actions are positively influencing the market. In addition to this, technological progress is enhancing devices to become more robust, dependable, and appropriate for extreme conditions. This is fueling the rugged tablet market share.
|
Report Attribute
|
Key Statistics
|
|---|---|
|
Base Year
|
2025
|
|
Forecast Years
|
2026-2034
|
|
Historical Years
|
2020-2025
|
|
Market Size in 2025
|
USD 1,196.7 Million |
|
Market Forecast in 2034
|
USD 1,951.4 Million |
| Market Growth Rate (2026-2034) | 5.42% |
At present, due to the increased need for reliable and durable devices in challenging working environments, the market is growing. Tablets that can withstand drops, dust, water, and extreme temperatures are necessary for industries, including mining, construction, logistics, and defense. In the field, these tablets allow mobility and real-time data access, which boosts communication and productivity. For critical tasks where standard devices can malfunction, emergency services and public safety organizations also use rugged tablets. They are beneficial for tracking, diagnostics, and inspections because they may be used with industry-specific software. Because they last longer, rugged tablets reduce downtime and replacement expenses.
To get more information on this market Request Sample
The United States has emerged as a major region in the rugged tablet market owing to many factors. Increasing demand from thriving sectors like defense, construction, logistics, and public safety, where durable and field-ready devices are essential, is fueling the rugged tablet market growth. According to the IMARC Group, the US logistics market size is set to attain USD 1,997.6 Billion in 2025. Rugged tablets support operations in harsh conditions, such as extreme temperatures, moisture, dust, and physical impacts, making them ideal for outdoor and industrial use. Government agencies and emergency services rely on rugged tablets for reliable communication and data access during critical missions. The need for real-time tracking, remote monitoring, and mobile workforce management is further driving adoption. Additionally, the presence of advanced infrastructure and strong investment in technology is leading to faster integration of rugged devices. Their compatibility with specialized software and secure communication systems makes them suitable for mission-critical tasks.
Rugged Tablet Market Trends:
Growing instances of cross-border tensions and terrorist activities
Rising instances of cross-border tensions and terrorist activities are positively influencing the market. As per industry reports, global fatalities from terrorism showed an increase of 22% in 2024. In 2023, 76% of terrorism-related fatalities in Western democracies took place in the United States. Military and law enforcement agencies require rugged tablets that can perform reliably in extreme and unpredictable environments, including deserts, forests, and combat zones. These tablets support critical tasks, such as real-time mapping, mission planning, surveillance, data collection, and secure communication. Their ability to function under shock, vibration, and harsh weather conditions makes them essential tools for field operations. Rugged tablets also integrate with tactical systems and specialized software used in military and emergency response scenarios. As security forces are prioritizing mobility, situational awareness, and operational readiness, the adoption of rugged tablets is becoming essential.
Innovations in technology
Advancements in technology are offering a favorable rugged tablet market outlook. As industries demand high-performance mobile solutions, manufacturers continue to focus on improving hardware and software features to meet specific operational needs. New rugged tablets come with faster processors, better connectivity, and enhanced security systems. Product makers are designing tablets with improved touch responsiveness that works even with gloves or in wet conditions, swappable batteries for extended field use, and biometric authentication like fingerprint scanners for better data protection. In March 2021, Aratek Biometrics introduced the Marshall 8 biometric rugged tablet designed for various field applications related to identification and authentication. With an 8-inch 1280 x 800 screen, the Marshall 8 offered an outstanding user experience along with improved productivity and performance. With continuous innovations, rugged tablets are becoming more versatile and efficient, encouraging broader utilization across industries that require mobile computing solutions capable of functioning flawlessly under unpredictable working conditions.
Growing integration with numerous applications
Businesses and public services rely on rugged tablets to run essential apps that support real-time communication, data collection, navigation, and task management. These tablets are compatible with specialized software tailored to sectors like utilities and emergency response. Android-based rugged tablets support integration with a wide range of applications and are commonly used in fire brigades, police vehicles, ambulances, and military systems to carry out multiple tasks in high-risk environments. For example, in May 2025, Samsung Electronics introduced the new Galaxy Tab Active5 Tactical Edition, broadening the company’s range of Tactical Edition products designed for military utilization. The tablet provided military-grade1 security and compatibility with a range of mission-ready software applications employed by special operations teams in crucial settings. Their ability to function with various tools and systems enhances efficiency, improves response times, and ensures reliable performance under harsh conditions.
Rugged Tablet Industry Segmentation:
IMARC Group provides an analysis of the key trends in each segment of the global rugged tablet market, along with forecast at the global, regional, and country levels from 2026-2034. The market has been categorized based on type, operating system, distribution channel, and end use industry.
Analysis by Type:
- Fully Rugged Tablets
- Semi Rugged Tablets
- Ultra-Rugged Tablets
Fully rugged tablets held 58.5% of the market share in 2025. They offer the highest level of durability and performance in extreme conditions. These tablets are specifically designed to withstand harsh environments, such as dust, water, shock, vibration, and extreme temperatures, making them ideal for industries like defense, construction, mining, oil and gas, and emergency services. Fully rugged tablets are often certified with military-grade standards, which assure users of their reliability in demanding field operations. They feature reinforced frames, toughened screens, sealed ports, and strong battery performance, allowing uninterrupted usage in rough outdoor or industrial settings. Organizations prefer fully rugged tablets for mission-critical tasks where failure is not an option. Their ability to function in high-risk zones with minimal damage or downtime adds significant value. As per the rugged tablet market forecast, with the growing complexity of field operations, the demand for highly durable and dependable computing solutions will continue to increase, leading fully rugged tablets to dominate the market.
Analysis by Operating System:
- Windows
- Android
- Others
Android holds the largest market share. It offers flexibility, ease of use, and cost-effectiveness, which are highly valued in industrial and field applications. Manufacturers prefer Android due to its open-source nature, allowing customization to suit specific industry needs. It supports a wide range of apps and tools that help field workers perform tasks like data entry, asset tracking, and communication efficiently. Android tablets generally have a lower price point compared to other operating systems, making them more accessible for large-scale deployment across sectors like logistics and public safety. The user-friendly interface reduces training time for employees, while regular updates and security features ensure smooth and secure operations. The wide compatibility of Android with various hardware configurations also allows more manufacturers to develop rugged tablets based on it.
Analysis by Distribution Channel:
Access the comprehensive market breakdown Request Sample
- Online
- Offline
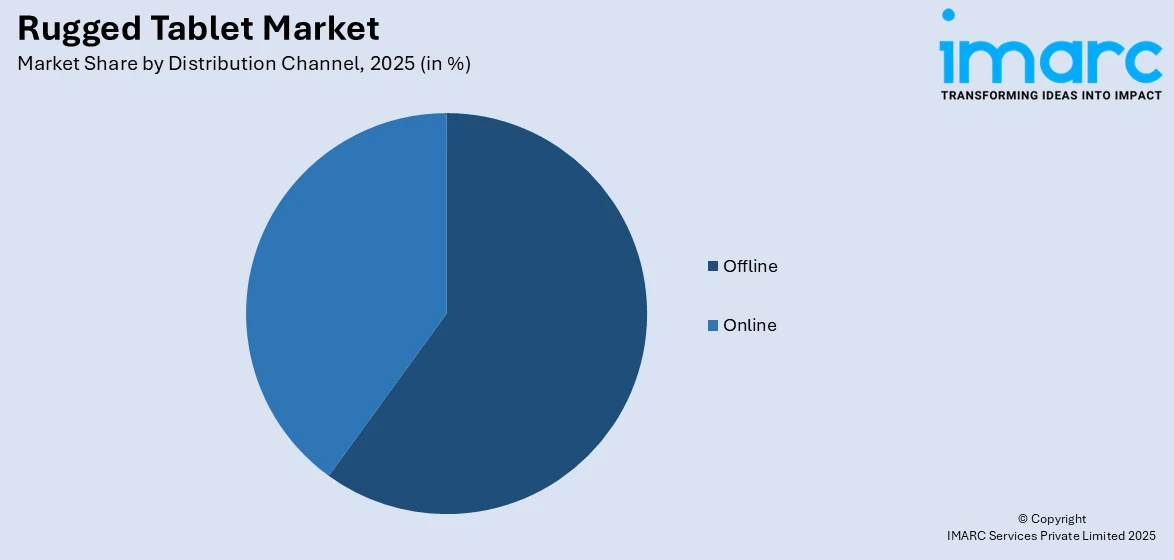
Offline represents the biggest market share. It offers hands-on experience, personalized assistance, and greater trust in product quality, especially for high-investment, technical devices. Buyers of rugged tablets, such as industrial firms, defense agencies, and logistics companies, often prefer to physically inspect the devices before making a purchase to ensure they meet durability and performance standards. Offline channels like specialized electronics stores, authorized dealers, and system integrators provide detailed product demonstrations, technical guidance, and after-sales support, which are critical for devices used in harsh environments. These channels also enable bulk purchasing, customized configurations, and direct negotiation, which are common in business-to-business (B2B) transactions. Moreover, offline distribution ensures faster delivery and installation services, minimizing operational delays. Customers rely on direct relationships with sellers for maintenance, warranty claims, and updates. Since rugged tablets are typically employed in critical applications, buyers value the reliability and assurance that offline channels offer, allowing this segment to maintain a strong lead in the market.
Analysis by End Use Industry:
- Energy
- Manufacturing
- Construction
- Transportation and Logistics
- Public Safety
- Retail
- Medical
- Government
- Military and Defense
- Others
Manufacturing holds the largest market share. It requires durable, efficient, and mobile computing solutions to support daily operations in demanding environments. Rugged tablets are widely used on production floors, in warehouses, and during quality control processes, where exposure to dust, vibrations, moisture, and accidental drops is common. These tablets help workers manage inventory, monitor machinery, access real-time data, and track workflow without needing to return to a stationary terminal. Their portability increases productivity and supports faster decision-making. Rugged tablets also integrate easily with manufacturing systems like barcode scanners, improving accuracy and communication across departments. The ability to perform under extreme conditions without failure decreases downtime and maintenance costs. As manufacturers are adopting digital tools for automation, monitoring, and reporting, rugged tablets are becoming essential assets. Their role in boosting safety and operational visibility makes them a preferred choice in the manufacturing industry, leading the market in end use applications.
Regional Analysis:
To get more information on the regional analysis of this market Request Sample
- North America
- United States
- Canada
- Asia-Pacific
- China
- Japan
- India
- South Korea
- Australia
- Indonesia
- Others
- Europe
- Germany
- France
- United Kingdom
- Italy
- Spain
- Russia
- Others
- Latin America
- Brazil
- Mexico
- Others
- Middle East and Africa
North America, accounting for a share of 33.5%, enjoys the leading position in the market. The region is noted for its strong industrial base, high adoption of advanced technologies, and significant demand from burgeoning sectors like defense, construction, logistics, and public safety. As per industry reports, the US defense market size was projected at USD 309.77 Billion in 2024. The region has a well-established infrastructure that supports the integration of rugged tablets into various field operations. Government agencies, military forces, and emergency services in the US and Canada are actively using rugged devices for secure communication, real-time data access, and field reporting. The presence of key market players and continuous investments in innovations are further strengthening the region’s leadership. High labor costs and the need for efficiency are encouraging organizations to adopt durable and mobile solutions that reduce downtime and repair expenses. In addition, digital transformation across industries is promoting the utilization of rugged tablets to streamline operations, improve productivity, and support remote work.
Key Regional Takeaways:
United States Rugged Tablet Market Analysis
The United States holds 85.10% of the market share in North America. The United States rugged tablet market is fueled by the increasing need for durable, field-ready computing solutions across various industries. In sectors, such as construction, utilities, transportation, and public safety, devices must be able to withstand harsh conditions, including drops, vibrations, moisture, and extreme temperatures. Consequently, numerous organizations are replacing user-grade tablets with MIL-STD-certified devices to ensure reliability and minimize downtime. Moreover, the integration of advanced features like barcode, high-resolution thermal and night-vision cameras, and secure global positioning system (GPS) connectivity is enhancing operational efficiency, particularly in asset tracking, field inspections, and emergency response. Additionally, the demand for rugged tablets is also being propelled by the increasing employment of digital workflows, which require enterprise-grade devices capable of supporting long battery life and cellular or satellite communications. For instance, in September 2024, Zebra Technologies, based in Illinois, unveiled its newest rugged Windows tablets, the ET60W and ET65W, featuring cutting-edge artificial intelligence (AI) functions to improve workflows and efficiency. The tablet provided 5G cellular network connectivity, enabling users to remain connected around the clock. Other than this, the rise of smart manufacturing and Industry 4.0 is also contributing to the market growth, with rugged tablets enabling mobile access to control systems and diagnostics on factory floors.
Europe Rugged Tablet Market Analysis
In Europe, the growth of the market is largely fueled by heightened infrastructure spending, particularly in transportation, energy, and construction, which is driving the demand for devices that can withstand extreme environmental conditions. Connected construction sites are also relying on weatherproof tablets with integrated high-speed 5G to enable real-time coordination and digital reporting in remote areas. Moreover, in agriculture, farmers are deploying rugged tablets for precision farming applications, utilizing GPS guidance, drone mapping, and the Internet of Things (IoT) sensor analytics to optimize yields. Furthermore, the public safety sector, including police, fire, and emergency medical services, is employing these devices for mobile incident management and resilient communication during crises. In December 2024, the German technology company WEROCK Technologies introduced the Rocktab U210 G2, a durable Windows tablet designed specifically for public services, law enforcement, and the defense industry. Featuring a sleek design and cutting-edge processor, the Rocktab U210 G2 catered to the requirements of contemporary security agencies, tackling challenges related to navigation, evidence management, deployment readiness and coordination, and geo-positioning in challenging environments. Other than this, the shift towards digital transformation in utilities and field services is promoting the usage of rugged tablets capable of supporting augmented reality (AR)-based troubleshooting.
Asia-Pacific Rugged Tablet Market Analysis
The Asia-Pacific rugged tablet market is expanding due to rapid industrial growth in sectors, such as mining, oil and gas, and logistics, which is driving the demand for devices that can handle extreme temperatures, dust, and moisture found in remote environments. The rising demand for digital tools in government, defense, and disaster response operations is also supporting industry expansion. Regional defense modernization programs are equipping personnel with rugged tablets for secure communication, navigation, and field data analysis. In January 2024, RuggON Corporation, based in Taiwan, introduced its latest military-grade Ground Control System (GCS) for managing UAVs at CES® 2024. Based on RuggON's acclaimed LUNA 3 8-inch rugged tablet, the GCS allowed users to operate almost any UAV. The system for controlling UAVs was certified to provide tracking and locating services through the global navigation satellite system (GNSS). Governments are also adopting rugged devices for emergency services and disaster relief efforts, where extreme conditions and mobility demands require durable computing solutions.
Latin America Rugged Tablet Market Analysis
The Latin America rugged tablet market is significantly influenced by industrial modernization, infrastructure upgrades, and evolving field operations. Digital transformation initiatives are also driving greater adoption of field-based solutions for asset inspection, inventory management, and predictive maintenance. Moreover, expanding 4G/5G connectivity across urban and rural areas is enabling remote operations and faster data sync. As per industry reports, during Q3 2024, the quantity of 5G network connections in Latin America hit 67 Million, showing a growth rate of 19%. Nonetheless, 4G continued to prevail in the regional landscape, representing 74% of all wireless connections. Besides this, training programs for field personnel are increasing confidence in using tablets for task execution, safety reporting, and compliance verification, propelling widespread adoption.
Middle East and Africa Rugged Tablet Market Analysis
In the Middle East and Africa region, the market is experiencing robust growth owing to the expansion of energy and infrastructure projects, where devices must operate reliably in remote, extreme environments, such as deserts and oil fields. For instance, the value of the infrastructure sector in Saudi Arabia was USD 36 Billion in 2024 and is set to attain USD 44.81 Billion by 2029, according to the Saudi British Joint Business Council. In the Kingdom, infrastructure projects valued at USD 1.8 Trillion were either underway or slated for development, with municipal infrastructure financing anticipated to rise to USD 21.3 Billion in 2025 from USD 17.3 Billion in 2024. Other than this, smart city and utility modernization initiatives are also integrating rugged tablets for field inspections, leak detection, and network management, facilitating industry expansion.
Competitive Landscape:
Key players are continuously innovating and offering advanced, durable devices to cater to the evolving rugged market trends. They are wagering on research and development (R&D) activities to enhance features like battery life, screen visibility, processing power, and resistance to water, dust, and shock. These companies also provide tailored solutions for sectors, such as defense, logistics, healthcare, and public safety, ensuring the tablets meet operational and regulatory requirements. Strong distribution networks and partnerships with system integrators are helping to expand market reach. Key players are also supporting their products with regular software updates, technical support, and training, which improves customer satisfaction and device performance. Through marketing, brand trust, and product reliability, they are influencing buying decisions and setting industry standards, contributing significantly to the growth of the market. For instance, in January 2025, Getac Technology Corporation launched its new ZX10 10-inch fully rugged Android tablet, featuring a user-friendly Android interface and robust AI-based performance in a lightweight design for exceptional field operation. The ZX10 was curated for experts in challenging sectors like public safety, utilities, transport, and logistics, who needed dependable equipment to withstand the tough conditions and scenarios they encountered daily.
The report provides a comprehensive analysis of the competitive landscape in the rugged tablet market with detailed profiles of all major companies, including:
- AAEON Technology Inc. (ASUSTeK Computer Inc.)
- Acer Inc.
- ARBOR Technology Corp.
- Dell Inc.
- Estone Group LLC
- Getac
- Handheld Group
- Honeywell International Inc
- Juniper Systems Inc.
- Leonardo DRS
- Micro-Star INT'L CO., LTD.
- Samsung Electronics Co., Ltd
- Waysion Technology
- Winmate Inc.
- Zebra Technologies Corp.
Latest News and Developments:
- June 2025: RuggON launched the SOL 7, the initial 12-inch tablet featuring Intel Arrow Lake processors and an entirely rugged construction. The SOL 7 provided advanced AI capabilities, robust durability, and smooth connectivity for essential sectors like automotive use, public safety, and warehousing and logistics. It was designed for advanced computing in difficult environments.
- May 2025: ONERugged unveiled the new AI-based rugged technologies, featuring the EM-I14M rugged AI tablet, at COMPUTEX Taipei in Taiwan. The firm also revealed its T1, T1 Max, and T2 Ultra durable tablets. Built to withstand extreme conditions, these durable tablets delivered exceptional performance and reliability for outdoor enthusiasts and professionals.
- April 2025: Samsung Electronics launched the Galaxy Tab Active5 Pro, a business-oriented device designed to meet the demands of contemporary, high-energy, fast-moving work environments. Featuring advanced enterprise functions and robust military-grade toughness, the rugged tablet provided improved 5G connectivity and ensured outstanding performance.
- March 2025: Darveen introduced its RTC-I116 rugged tablet to assist warehouse personnel in tracking inventories and aid maintenance teams in troubleshooting equipment issues to enhance machine availability. Designed for tough industrial settings, the RTC-I116 effectively complied with the IP66 and MIL-STD-810H standards for shock, drop, and water protection. The product was capable of enduring temperatures from a maximum of 60°C to a minimum of -20°C.
Rugged Tablet Market Report Scope:
| Report Features | Details |
|---|---|
| Base Year of the Analysis | 2025 |
| Historical Period | 2020-2025 |
| Forecast Period | 2026-2034 |
| Units | Million USD |
| Scope of the Report |
Exploration of Historical Trends and Market Outlook, Industry Catalysts and Challenges, Segment-Wise Historical and Future Market Assessment:
|
| Types Covered | Fully Rugged Tablets, Semi Rugged Tablets, Ultra-Rugged Tablets |
| Operating Systems Covered | Windows, Android, Others |
| Distribution Channels Covered | Online, Offline |
| End Use Industries Covered | Energy, Manufacturing, Construction, Transportation and Logistics, Public Safety, Retail, Medical, Government, Military and Defense, Others |
| Regions Covered | Asia Pacific, Europe, North America, Latin America, Middle East and Africa |
| Countries Covered | United States, Canada, Germany, France, United Kingdom, Italy, Spain, Russia, China, Japan, India, South Korea, Australia, Indonesia, Brazil, Mexico |
| Companies Covered | AAEON Technology Inc. (ASUSTeK Computer Inc.), Acer Inc., ARBOR Technology Corp., Dell Inc., Estone Group LLC, Getac, Handheld Group, Honeywell International Inc, Juniper Systems Inc., Leonardo DRS, Micro-Star INT'L CO., LTD., Samsung Electronics Co., Ltd, Waysion Technology, Winmate Inc., Zebra Technologies Corp., etc. |
| Customization Scope | 10% Free Customization |
| Post-Sale Analyst Support | 10-12 Weeks |
| Delivery Format | PDF and Excel through Email (We can also provide the editable version of the report in PPT/Word format on special request) |
Key Benefits for Stakeholders:
- IMARC’s report offers a comprehensive quantitative analysis of various market segments, historical and current market trends, market forecasts, and dynamics of the rugged tablet market from 2020-2034.
- The research study provides the latest information on the market drivers, challenges, and opportunities in the global rugged tablet market.
- The study maps the leading, as well as the fastest-growing, regional markets. It further enables stakeholders to identify the key country-level markets within each region.
- Porter's Five Forces analysis assists stakeholders in assessing the impact of new entrants, competitive rivalry, supplier power, buyer power, and the threat of substitution. It helps stakeholders to analyze the level of competition within the rugged tablet industry and its attractiveness.
- Competitive landscape allows stakeholders to understand their competitive environment and provides an insight into the current positions of key players in the market.
Frequently Asked Questions About the Rugged Tablet Market Report Report
The rugged tablet market was valued at USD 1,196.7 Million in 2025.
The rugged tablet market is projected to exhibit a CAGR of 5.42% during 2026-2034, reaching a value of USD 1,951.4 Million by 2034.
As field operations are becoming more digital, organizations are adopting rugged tablets to improve efficiency, communication, and data accuracy. The shift towards automation, remote monitoring, and paperless workflows is further driving the demand for rugged devices. Features like longer battery life, reinforced frames, sunlight-readable screens, and strong wireless connectivity make rugged tablets suitable for both indoor and outdoor tasks.
North America currently dominates the rugged tablet market, accounting for a share of 33.5% in 2025, driven by strong demand from defense, construction, and public safety sectors, advanced infrastructure, high technology adoption, and the presence of key players that offer reliable and durable solutions for field-based and industrial operations.
Some of the major players in the rugged tablet market include AAEON Technology Inc. (ASUSTeK Computer Inc.), Acer Inc., ARBOR Technology Corp., Dell Inc., Estone Group LLC, Getac, Handheld Group, Honeywell International Inc, Juniper Systems Inc., Leonardo DRS, Micro-Star INT'L CO., LTD., Samsung Electronics Co., Ltd, Waysion Technology, Winmate Inc., Zebra Technologies Corp., etc.
Need more help?
- Speak to our experienced analysts for insights on the current market scenarios.
- Include additional segments and countries to customize the report as per your requirement.
- Gain an unparalleled competitive advantage in your domain by understanding how to utilize the report and positively impacting your operations and revenue.
- For further assistance, please connect with our analysts.
 Request Customization
 Speak to an Analyst
 Request Brochure
 Inquire Before Buying
Benefits of Customization
- Personalize this research
- Triangulate with your data
- Get data as per your format and definition
- Gain a deeper dive into a specific application, geography, customer, or competitor
- Any level of personalization
Get in Touch With Us
UNITED STATES
Phone: +1-201-971-6302
INDIA
Phone: +91-120-433-0800
UNITED KINGDOM
Phone: +44-753-714-6104
Email: [email protected]
Client Testimonials


.webp)


